Play on LevelsGALAnalysis
Closed at 552.99 (01-01-2026)
Liquidity Sweep around 350 - 360;
Now 2 Important Supports are
S1 around 550 - 552
S2 around 522 - 525
Immediate resistance seems to be around 580 - 585
& then around 620 - 640
Dowtheory

DOW THEORY – THE FOUNDATION OF TREND READING1. The Market Moves in Trends – Not Randomly
Price does not move randomly. What looks like chaos is simply organized collective behavior.
A trend exists only when price structure is respected:
Uptrend: Higher Highs & Higher Lows
Downtrend: Lower Highs & Lower Lows
As long as this structure remains intact, the trend is still valid, regardless of news, opinions, or emotions.
2. Every Trend Has Three Levels of Movement
Markets operate across multiple time layers simultaneously:
Primary Trend: The dominant direction (weeks to months)
Secondary Move: Corrections against the main trend
Minor Swings: Short-term noise
Most traders lose money because they trade against the primary trend, reacting emotionally to minor fluctuations and mistaking them for reversals.
3. The Three Psychological Phases of a Trend
A trend evolves through three distinct phases:
🔹 Accumulation
Smart money builds positions quietly
Sideways price action, low volatility
Minimal public interest
🔹 Participation
Trend becomes obvious
Breakouts occur
This is where most profits are made
🔹 Distribution
Late buyers enter emotionally
Volatility increases
Smart money exits
Understanding these phases helps traders avoid buying tops and selling bottoms.
4. Structure Is the Only Valid Trend Confirmation
A trend is not confirmed by indicators.
A trend is confirmed when:
- Price breaks structure in the trend direction
- Pullbacks respect previous swing levels
- Momentum continues after corrections
If structure is not broken, there is no reversal only a correction.
This is why predicting tops and bottoms is dangerous.
5. Volume Confirms Direction — Not Timing
Volume does not tell you when to enter — it tells you whether the move is real:
- Rising volume with the trend → confirmation
- Weak volume during pullbacks → healthy correction
- High volume against structure → warning sign
Price leads. Volume confirms.
HOW TO APPLY DOW THEORY IN REAL TRADING
A simple, repeatable framework:
1. Identify the dominant trend (HH/HL or LH/LL)
2. Wait for a correction, not a reversal
3. Enter only after structure resumes in trend direction
4. Place stop-loss where structure becomes invalid
5. Hold until the market changes structure
No prediction. No guessing.
Just reading what price is already telling you.

Most Traders Lose Because They Don’t Know What a Trend Really IsDOW THEORY – THE FOUNDATION OF TREND READING
1. The Market Moves in Trends – Not Randomly
- Price does not move randomly. What looks like chaos is actually structured movement driven by collective behavior.
A trend exists when the market consistently creates:
+ Higher Highs & Higher Lows → Uptrend
+ Lower Highs & Lower Lows → Downtrend
As long as this structure remains intact, the trend remains valid regardless of news, opinions, or emotions.
2. Every Trend Has Three Levels of Movement
- Understanding timeframe hierarchy is critical.
Markets move in three simultaneous layers:
+ Primary Trend – the dominant direction (weeks to months)
+ Secondary Move – corrective phases against the main trend
+ Minor Swings short-term noise
Most traders lose money because they trade against the primary trend, reacting to minor swings and mistaking them for reversals.
3. The Three Phases of a Trend
A trend does not start or end suddenly. It evolves through three psychological phases:
1️⃣ Accumulation Phase
Smart money quietly builds positions
Price moves sideways, volatility is low
Public interest is minimal
2️⃣ Participation Phase
Trend becomes clear
Breakouts occur
Most trend-following profits are made here
3️⃣ Distribution Phase
Late buyers enter emotionally
Volatility increases
Smart money exits
Understanding these phases helps traders avoid buying tops and selling bottoms.
4. Structure Is the Only Valid Trend Confirmation
A trend is not confirmed by indicators alone.
A trend is confirmed when:
+ Price breaks structure in the trend direction
+ Pullbacks respect previous swing levels
+ Momentum continues after corrections
If structure is not broken, there is no reversal only a correction.
This is why predicting tops and bottoms is dangerous.
5. Volume Confirms Direction, Not Timing
Volume does not tell you when to enter — it tells you whether the move is real.
- Rising volume in the direction of the trend = confirmation
- Weak volume during pullbacks = healthy correction
- High volume against structure = warning sign
Price leads. Volume confirms.
6. A Trend Continues Until Proven Otherwise
This is the most ignored rule and the most important.
A trend does NOT end because:
- Price “already went too far”
- Indicators are overbought/oversold
- Social media says “top is in”
A trend ends only when structure breaks and fails to recover.
HOW TO APPLY THIS IN REAL TRADING
Simple, repeatable framework:
- Identify the dominant trend (HH/HL or LH/LL)
- Wait for a correction not a reversal
- Enter only after structure resumes in trend direction
- Place stop-loss where structure becomes invalid
- Hold until the market changes structure
No prediction. No guessing. Just reading what price is already telling you.
FINAL THOUGHT
Most traders don’t lose because they lack indicators.
They lose because they don’t understand trend behavior.
When you stop predicting and start reading structure,
the market becomes clear, calm, and repeatable.

DOW THEORY – THE FOUNDATION OF TREND READINGDOW THEORY – THE FOUNDATION OF TREND READING
1. The Market Moves in Trends – Not Randomly
- Price does not move randomly. What looks like chaos is actually structured movement driven by collective behavior.
A trend exists when the market consistently creates:
+ Higher Highs & Higher Lows → Uptrend
+ Lower Highs & Lower Lows → Downtrend
As long as this structure remains intact, the trend remains valid regardless of news, opinions, or emotions.
2. Every Trend Has Three Levels of Movement
- Understanding timeframe hierarchy is critical.
Markets move in three simultaneous layers:
+ Primary Trend – the dominant direction (weeks to months)
+ Secondary Move – corrective phases against the main trend
+ Minor Swings short-term noise
Most traders lose money because they trade against the primary trend, reacting to minor swings and mistaking them for reversals.
3. The Three Phases of a Trend
A trend does not start or end suddenly. It evolves through three psychological phases:
1️⃣ Accumulation Phase
Smart money quietly builds positions
Price moves sideways, volatility is low
Public interest is minimal
2️⃣ Participation Phase
Trend becomes clear
Breakouts occur
Most trend-following profits are made here
3️⃣ Distribution Phase
Late buyers enter emotionally
Volatility increases
Smart money exits
Understanding these phases helps traders avoid buying tops and selling bottoms.
4. Structure Is the Only Valid Trend Confirmation
A trend is not confirmed by indicators alone.
A trend is confirmed when:
+ Price breaks structure in the trend direction
+ Pullbacks respect previous swing levels
+ Momentum continues after corrections
If structure is not broken, there is no reversal only a correction.
This is why predicting tops and bottoms is dangerous.
5. Volume Confirms Direction, Not Timing
Volume does not tell you when to enter — it tells you whether the move is real.
- Rising volume in the direction of the trend = confirmation
- Weak volume during pullbacks = healthy correction
- High volume against structure = warning sign
Price leads. Volume confirms.
6. A Trend Continues Until Proven Otherwise
This is the most ignored rule and the most important.
A trend does NOT end because:
- Price “already went too far”
- Indicators are overbought/oversold
- Social media says “top is in”
A trend ends only when structure breaks and fails to recover.
HOW TO APPLY THIS IN REAL TRADING
Simple, repeatable framework:
- Identify the dominant trend (HH/HL or LH/LL)
- Wait for a correction not a reversal
- Enter only after structure resumes in trend direction
- Place stop-loss where structure becomes invalid
- Hold until the market changes structure
No prediction. No guessing. Just reading what price is already telling you.
FINAL THOUGHT
Most traders don’t lose because they lack indicators.
They lose because they don’t understand trend behavior.
When you stop predicting and start reading structure,
the market becomes clear, calm, and repeatable.

2POINTZERO (ADX) | Bullish Continuation Setup After Healthy PullGreetings Traders,
Price has completed a corrective move and is showing early signs of bullish continuation.
🔹 Technical View:
• Strong support formed near 2.55–2.60, aligned with the 200-day MA
• Higher low structure suggests buyers stepping in
• RSI recovering from lower levels, indicating improving momentum
🔹 Trade Plan:
• Buy: Above 2.85 with volume confirmation
• Take Profit 1: 3.15
• Take Profit 2: 3.40 (strong resistance zone)
• Stop Loss: Below 2.54
🔹 Outlook:
A confirmed breakout above 2.85 may open the door for a move toward the upper resistance zone. Manage risk carefully near key resistance levels.
This is a technical setup, not financial advice.
📈 Happy Trading & Stay Disciplined!

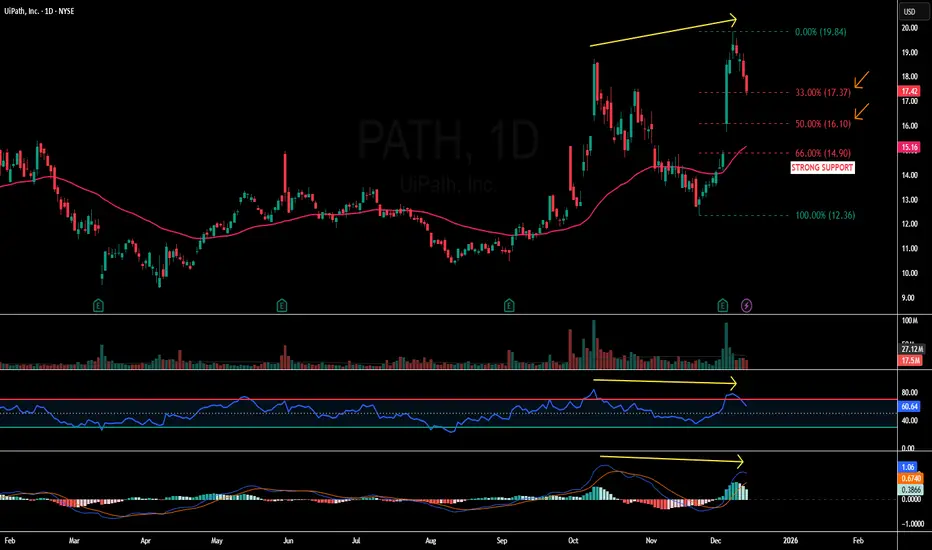
PATH - 14.90 – The Line That MattersPATH - CURRENT PRICE : 17.42
UiPATH (PATH) – Previous Targets Achieved, Buy-on-Dips Setup After Healthy Pullback
The previous technical buy call on UiPATH has successfully achieved all stated upside targets (refer to the earlier analysis via the shared link for reading context). Following this strong rally, the stock has now entered a pullback phase, which is technically expected after an extended upside move.
The current retracement is accompanied by a bearish divergence between price and momentum indicators (RSI & MACD) , as highlighted by the yellow arrows on the chart. Bearish divergence occurs when price makes a higher high while momentum indicators fail to confirm with higher highs, often signaling short-term exhaustion and a corrective move rather than a trend reversal. This explains the ongoing pullback and supports the view that the decline is corrective in nature.
From a structural perspective, the pullback remains constructive and healthy. Price has retraced approximately 33% of the prior advance, which aligns well with Dow Theory, where strong trends commonly retrace one-third or one-half before resuming the primary trend. Importantly, price continues to trade above the 50-day EMA, while both RSI and MACD remain in bullish territory, indicating that the broader bullish momentum is still intact despite near-term consolidation.
A critical level to watch is 14.90, which serves as STRONG SUPPORT. This level represents a two-thirds (≈66%) retracement under Dow Theory, coincides with a previous gap-up demand zone, and is located near the rising 50-day EMA, creating a strong confluence of technical support.
Trading Plan (Buy-on-Dips Approach):
At current levels, traders may consider initiating HALF of the intended position.
If price retraces further toward the 50% retracement level, the remaining half position may be added, as this remains a healthy pullback within an uptrend.
A decisive break below 14.90 (66% level) would invalidate the setup and should be treated as a cut-loss level.
As long as price holds above this support zone, the pullback can be viewed as a buy-the-dip opportunity, with the potential for the primary uptrend to resume.
FIRST TARGET : 18.50
SECOND TARGET : 19.80
SUPPORT : 14.90
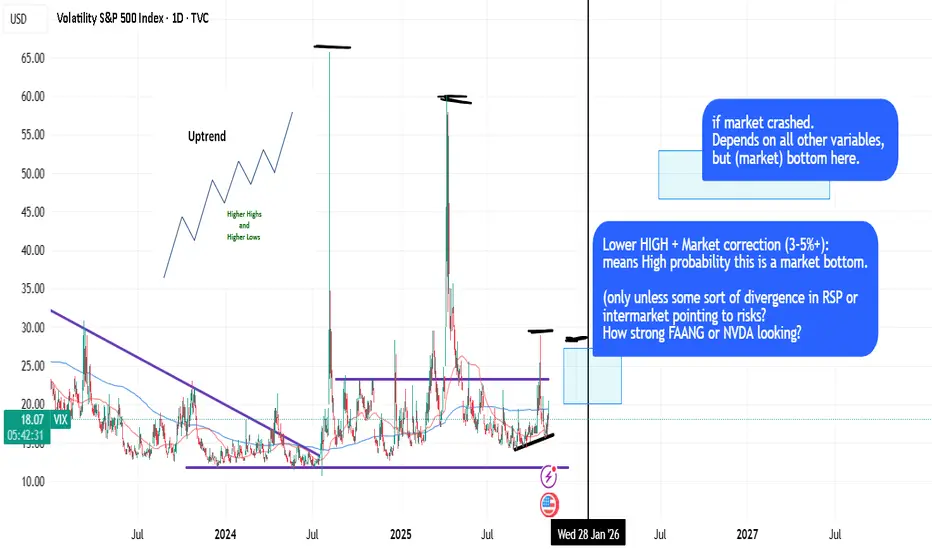
Using HLOW/LHIGH (Dow) + LOGIC to pinpoint probabilities.DOW Theory is the king of the stock market (Higher Lows, Lower Highs, uptrending, etc.) and it's quite basic concept to apply with logic.
Sometimes you can time the market (based on 50dma/200dma crosses, price extensions) and LHIGH dynamics and logic -> to pinpoint probabilities. Like, look at VIX dynamics during 2023/2024.
in short: DOW + LOGIC = PROBABILITY.
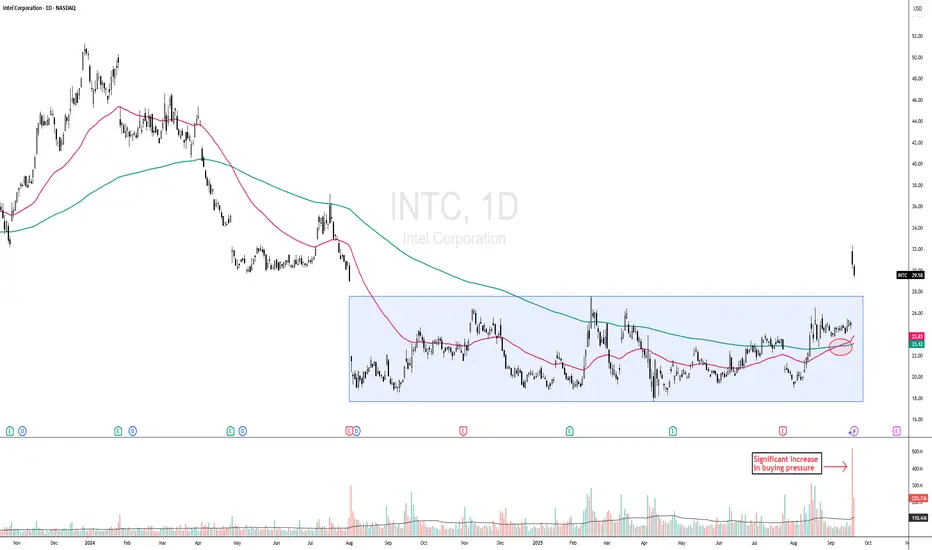
DOW THEORY PLAY - INTC CONFIRMS BREAKOUT FROM ACCUMULATION PHASEINTC - CURRENT PRICE : 29.58
Key Technical Highlights:
1. Breakout from Accumulation Phase with Strong Volume
Intel has successfully broken out of a prolonged sideways accumulation zone. The breakout is accompanied by significantly higher-than-average volume , indicating strong buying interest and institutional participation.
2. New 52-Week High Achieved
Price has breached the previous 52-week high, signaling bullish momentum and the potential start of a new price discovery phase. Historically, such breakouts often attract trend-following traders.
3. Golden Cross Formation (look at the red circle)
A Golden Cross has formed for the first time in a long period, where the 50-day EMA has crossed above the 200-day EMA — a classic long-term bullish confirmation. Notably, the last occurrence of this pattern was in July 2023 , making this the first reappearance in over two years, further reinforcing its significance as a potential turning point in market sentiment.
4. Dow Theory Alignment – Public Participation Phase
According to Dow Theory, this marks the second phase of a major uptrend — the Public Participation Phase — where broader market participants begin to enter following early accumulation by smart money. This phase typically sees strong price advances.
ENTRY PRICE : 28.00 - 30.00
FIRST TARGET : 35.00
SECOND TARGET : 42.00
SUPPORT : 25.00 (CUTLOSS below 25.00 on closing basis)
Note : This is related to point no 1. Markets have a tendency to "fall of their own weight." At bottoms, however, markets require a significant increase in buying pressure, reflected in greater volume, to launch a new bull market. A more technical way of looking at this difference is that a market can fall just from inertia. Lack of demand or buying interest on the part of traders is often enough to push a market lower; but a market does not go up on inertia. Prices only rise when demand exceeds supply and buyers are more aggressive than sellers.
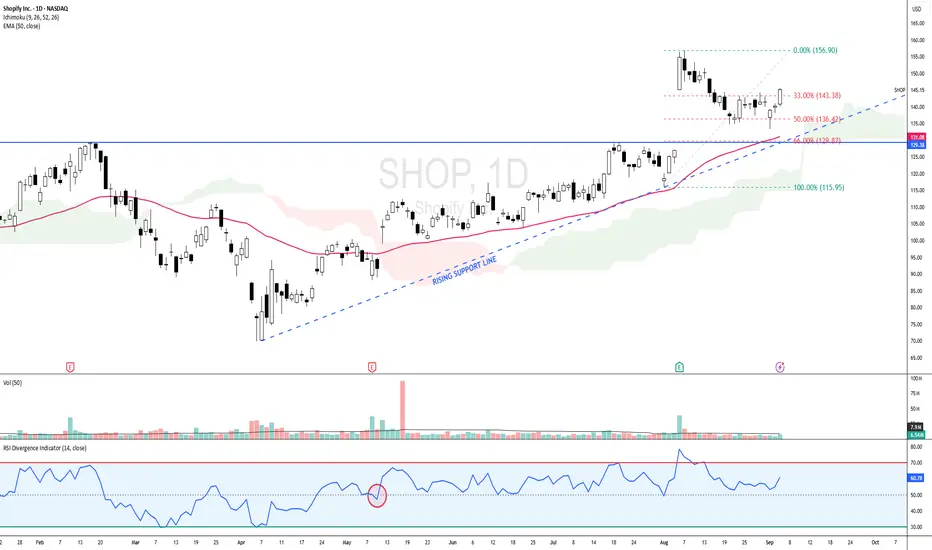
SHOP - BULLISH SCENARIO since 12 MAY 2025 SHOP - CURRENT PRICE : 145.15
SHOP is bullish as the share price is above 50-day EMA. Price action on 12 MAY 2025 is considered starting of bullish scenario because supported by several key indicators :
Share price gap up
Price broke out 50-day EMA
Price moving above ICHIMOKU CLOUD
RSI moving above 50
From 1 August (near 50-day EMA support) to 6 August, the stock recorded a strong upward rally. Following this advance, prices entered a corrective phase and retraced approximately 50% of the prior upswing. According to Dow Theory, such a retracement is considered a normal and healthy correction within an ongoing uptrend. Retracements in the range of one-third to two-thirds of the prior move are typical, with the 50% level often serving as a natural equilibrium point where buyers re-enter the market. Sustaining above the 50% retracement level would reinforce the bullish structure, while a recovery from this zone could pave the way for a retest of the recent highs. However, a decisive break below the 61.8% retracement may imply weakening momentum and a deeper corrective phase.
Take note that until now the share price is still above 50-day EMA and ICHIMOKU CLOUD while RSI also moving steadily above 50 level. There is also rising support line - strengthening bullish outlook.
ENTRY PRICE : 141.00 - 145.50
TARGET : 159.00 and 175.00
SUPPORT : 50-day EMA (CUTLOSS below 50-day EMA on closing basis)
Bullish
Bullish Divergence on Daily tf.
Immediate resistance is around 83 - 83.50
Very important to cross & sustain 86 - 87
for further upside.
However, should not breakk 65.50 , otherwise
we may witness further selling pressure.

US30 Trade Plan – Range Breakout + Smart Money ManipulationI’m currently watching the US30 (Dow Jones Index) 🏦. On the 4-hour timeframe, we can see a strong uptrend forming — higher highs and higher lows 📈. Whether this trend continues remains to be seen, but having a solid trading plan is key ✅.
Here’s mine: On the 30-minute timeframe, price is currently moving within a defined range. If we see a break above the range, followed by a retracement and failed retest of the range high, I’ll be looking for a long opportunity 🚀.
If price instead breaks below the range, there could also be a short opportunity, though my preference is to stay long given the higher-timeframe bullish structure ⚙️.
⚠️ Keep an eye out for market manipulation — smart money algorithms often trigger fake breakouts to draw in buyers before sweeping liquidity and continuing the move. Stay alert and manage risk carefully.
📉 Disclaimer: This content is for educational purposes only and not financial advice.

The ugliest crash in our history close? I truly believe with western powers developing digital IDs and other technology, etc. to monitor and control the public... and in some cases replace the human race... it's in line with what I believe will be one of the biggest market crashes in human history, equal or bigger to 1929.
GET READY.
IT WILL HAPPEN WITHIN THE BLACK ZONE.
The powers in control know!
The 2030 Agenda is prepared for this.
And they are keeping the public distracted.
History repeats!
There is a purpose to everything!

TradeCityPro Academy | Support & Resistance Part 1👋 Welcome to TradeCityPro Channel
🎓 Educational Section Technical Analysis Training Series
Welcome to the Educational Content Section of our channel!
Here, we aim to teach you technical analysis from A to Z through structured playlists.
We’ll cover everything from risk and capital management, Dow Theory, support and resistance, trends, and market cycles, to more advanced concepts.
Our lessons are based on both real market experience and The Handbook of Technical Analysis.
🎨 What is Technical Analysis?
Technical Analysis (TA) is a method used to forecast price movements in financial markets by analyzing historical data, especially price and volume.
It’s based on the idea that history tends to repeat itself, and that recurring patterns can reveal profitable trading opportunities.
🧩 The Human Concept of Support and Resistance
Support and resistance aren’t just numbers on a chart — they’re the result of collective human behavior.
When large groups of traders make similar decisions — buying or selling — at a certain level, that area becomes psychologically important in the market.
Support forms where fear of missing out (FOMO) drives people to buy.
Resistance forms where fear of loss motivates people to sell.
💭 The Psychology Behind Formation
In a downtrend, when prices fall too much, traders start thinking “It can’t go any lower”, and buying pressure increases — forming support.
In an uptrend, when prices rise sharply, traders think “It’s too expensive now”, and selling pressure builds — forming resistance.
So, these levels reflect emotions like fear, greed, and FOMO, rather than being purely technical.
🌍 Real-World Example
When the USD price drops so low that everyone rushes to buy it — that’s support.
When gold becomes so expensive that no one wants to buy anymore — that’s resistance.
Markets operate on these same human instincts — only visualized through candlesticks and numbers.
🧩 Introduction
In technical analysis, two key concepts exist in nearly every strategy:
Support and Resistance.
These are areas on the chart where the probability of price reaction or reversal is high.
🟢 What is Support?
A support level is where buying pressure is expected to increase and prevent further price decline.
It acts like a floor that supports price.
📘 Example:
If Bitcoin repeatedly bounces from the $60,000 level, that area is considered a support zone.
🔴 What is Resistance?
A resistance level is where selling pressure increases, preventing further price growth.
It acts like a ceiling that stops price movement upward.
📘 Example:
If Ethereum fails multiple times to break above $3,800, that area is a resistance zone.
📈 How to Identify Support and Resistance
There are several methods to detect these levels:
Previous Highs and Lows:
The most common method — look for areas where price has reacted before.
Trendlines:
In an uptrend, connecting higher lows gives you a dynamic support line.
Moving Averages (MA):
MAs like MA50 or MA200 often act as dynamic support or resistance.
Supply and Demand Zones:
Areas where heavy buying or selling previously occurred.
⚙️ Market Psychology
Support and resistance are emotional memory points for traders.
When price reacts to a level once, it becomes mentally significant, leading to similar reactions in the future.
That’s why these zones often repeat over time.
🔄 Breakouts and Role Reversal
When price breaks a support or resistance level with strong volume and momentum, that level changes its role:
Broken resistance → becomes new support
Broken support → becomes new resistance
This concept is known as Role Reversal.
🎯 Importance of Timeframes
Support and resistance zones on higher timeframes (Daily, Weekly) carry greater significance, since more traders and larger volumes are involved.
🧠 Pro Tips
✅ Always treat support and resistance as zones, not fixed price points.
✅ If price approaches a level with strong momentum, it’s more likely to break it.
✅ Combine S/R with candlestick reactions, volume, and indicators for confirmation.
✅ Levels that repeat multiple times usually grow stronger over time.
💬 Summary
Support and resistance are the foundation of technical analysis.
Understanding them helps you find better entry and exit points and gain a deeper insight into market psychology.
Continuously making HH HLBTC Analysis
CMP 112510.14 (12-10-2025 02:58AM PST)
Continuously making HH HL & is Still Bullish in the
longer run.
as shared on 02-06-2025, Cup & Handle Target hit
around 115000 - 120000 & then dropped.
3 Important Support levels are :
S1 around 108000 - 108450
S2 around 95000 - 95200
S3 around 86000 - 86500
S2 seems to be a Stronger Support as this range is
also around Channel Bottom.
Upside Targets seems to be around 132000 - 132300
initially.
BTC seem safe as long as it stays above 74000; if it
breaks this level, we may witness trend reversal.

SPEL PSX📈 SPEL (PSX) – Buy Call (1-Day Outlook)
Technical View
Previously: Stock has broken out of a long-awaited rectangle consolidation pattern. And target was hit.
Structure now shifting into higher highs (HHs) and higher lows (HLs) → trend confirmation.
Price is currently holding in the golden zone (retest area after breakout).
Momentum is bullish and intact as long as structure of HH/HL holds.
Trading Plan
Look for a bullish candlestick rejection in the golden zone as entry trigger.
Targets:
Short-term traders: book partial profits at the first resistance above breakout.
Mid-term traders: hold for continuation toward next resistance zones as long as HH/HL structure stays intact.
Confirmation Checklist
✅ Breakout candle closes strong (preferably with above-average volume).
✅ Retest of breakout zone holds with bullish rejection.
❌ Invalidation if price loses HL structure or breaks below retest support.
Fundamentals (Quick Pulse)
Company is profitable with revenue and income growth.
Operates in packaging/auto components → demand relatively stable.

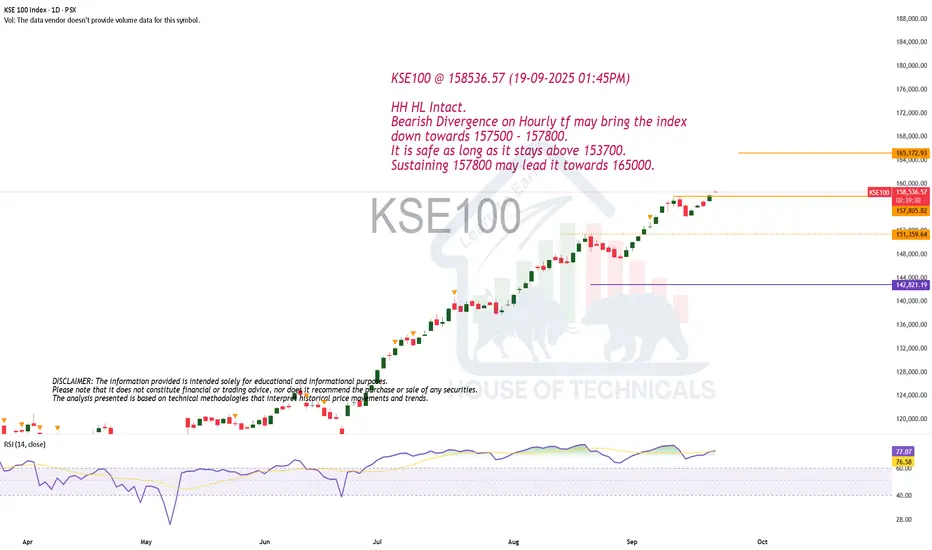
HH HL Intact.KSE100 @ 158536.57 (19-09-2025 01:45PM)
HH HL Intact.
Bearish Divergence on Hourly tf may bring the index
down towards 157500 - 157800.
It is safe as long as it stays above 153700.
Sustaining 157800 may lead it towards 165000.
BTCUSD🚀 BTCUSD – 1H Time Frame Setup
📈 BTC is making HHs & HLs (short-term bullish structure).
🔑 Tried to break resistance 111,835 – 112,000 thrice ❌ — possible breakout on the 4th or 5th attempt.
⏳ 4H & Daily trend still bearish ⚠️ → trade with caution.
Currently Ranging!
💡 Trading Plan:
✅ Look for a bullish candle confirmation before entry.
🎯 Partial booking recommended at TP1 → must manage risk after first target.
🛑 Always protect profits / adjust SL.
📊 Best setup if BTC comes near 0.5 Fib (≈ 6.08 level) and then breaks above 111,835 – 112,000 🔓

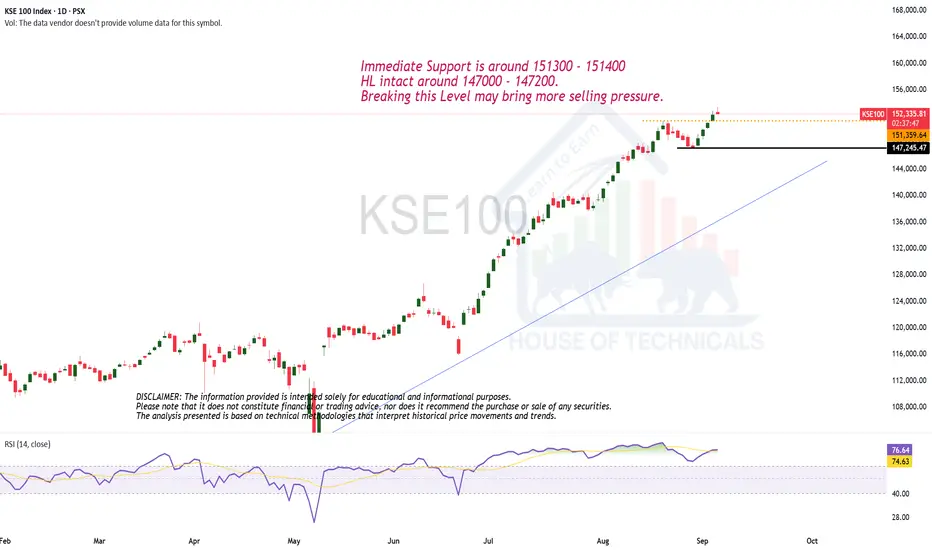
HH HL Still Intact but...Immediate Support is around 151300 - 151400
HL intact around 147000 - 147200.
Breaking this Level may bring more selling pressure.
HL printed.SEARL Analysis
Closed at (01-09-2025)
HL printed.
Upside targets can be around 123
& then 130
102 - 107 was a very strong Support level.
However, 106 should be the SL now.

XAUUSD📈 XAUUSD – 1H Timeframe
🟢 Long Call/ Bullish Candle
🔹 Gold is forming HH & HL (Higher Highs & Higher Lows) on the 1H chart → Uptrend structure intact.
🔹 Fib Retracement Setup → Perfect dip-buy opportunity from CMP (Current Market Price).
💡 Plan:
👉 Buy from CMP 🎯
👉 Book partial profits on resistance levels 🪙
👉 SL below Fib retracement 🔒
🌍 Weekly Fundamental Drivers:
1️⃣ Fed remains cautious on rate cuts, supporting safe-haven demand 🏦
2️⃣ Geopolitical uncertainty & central bank gold buying continue to give long-term bullish momentum 🌐
⚠️ Risk Management: Stay disciplined — let structure + fundamentals guide your trade.

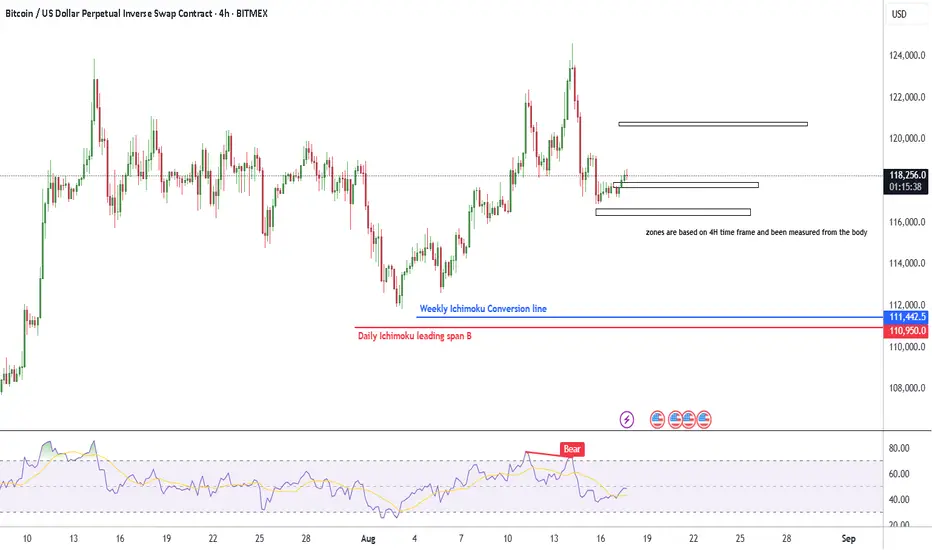
My analysis on BTC based on Fibs and IchimokuPic is self explanatory , my bet is short term short and long term long , If the price breaks through the highest zone then the possibility of retracing lower shrinks
If it fakes it , then the chances are rising
Gold Price Drops After Rally – What’s Next?Hello everyone, let's take a closer look at today's gold price
Gold has unexpectedly dropped significantly today after a notable rise early last Friday. The market's initial concerns stemmed from rumors that the U.S. would impose an import tax on gold, which caused some panic. However, after the White House officially clarified its position and assured the market, the initial worries eased
From a technical perspective, gold has broken through the upward trendline and is moving swiftly. According to Dow Theory, a short-term correction might occur soon, but if the price remains below key resistance levels, the decline could extend toward the Fibonacci 1.272 region, or even down to the Fibonacci 1.618 level if the downtrend persists.
Do you agree with this outlook? Share your thoughts in the comments below.
Good luck and happy trading!

