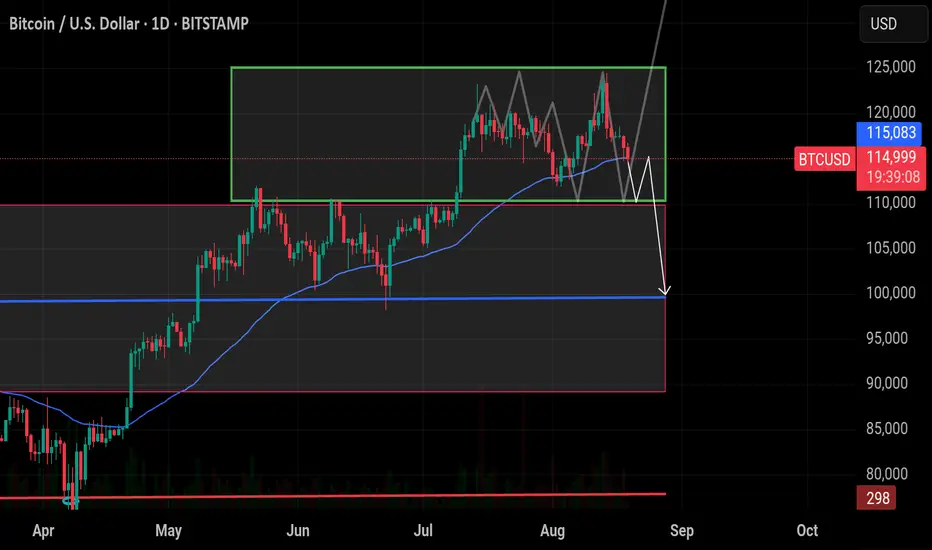
BITCOIN’S FINAL TRAP – THE SENTIMENT SWITCH IS COMING FASTIn my last BTC post I said a dump was likely based on data, and that thesis still stands. If anything, it’s even stronger now. .
On 13 August, CME made a high at 123,590.
That high was weak, no excess, flat TPO top, unfinished auction.
Binance topped at 124,474, Coinbase at 124,522.
CME opened with a gap down, leaving that poor high unrepaired with unfinished business and clean liquidity sitting above.
From 26 September, BTC started grinding up.
I expected a run of the 18 September high and a reversal around 118–119K, but price extended the move to the 1.618 extension. See my last analysis.
Structure was weak, spot CVD flat, futures CVD ripping, open interest climbing.
That shows perps were driving it, not real spot demand.
This week CME finally cleaned it up.
CME ripped through 125,025, taking out the August high at 123,590.
That level matched the old highs on Binance and Coinbase almost perfectly.
CME swept the old poor high left behind by spot and perps, completing the auction.
This is typical CME behavior, it hunts untested reference points during RTH and often reverses right after.
Flow data confirms the setup:
Spot CVD down means real buyers not following.
Stablecoin CVD pushing up means overleveraged longs chasing.
Coin-margined CVD rolling means profit taking or hedge flow.
Open interest flat at the top means trapped longs with no squeeze left.
The move looks like a leveraged markup driven by perps, cleaned up by CME liquidity, and now hanging on air.
CME repaired the August inefficiency, swept the prior spot high, and left another weak high with no excess, a textbook sign of distribution.
There’s still a chance we see one more SFP around 126K before momentum flips, but unless spot demand picks up aggressively, that should be the final liquidity grab.
My targets are 104K and 99K if 104K fails to hold, with potential for an even deeper drop beyond that level.
Dump
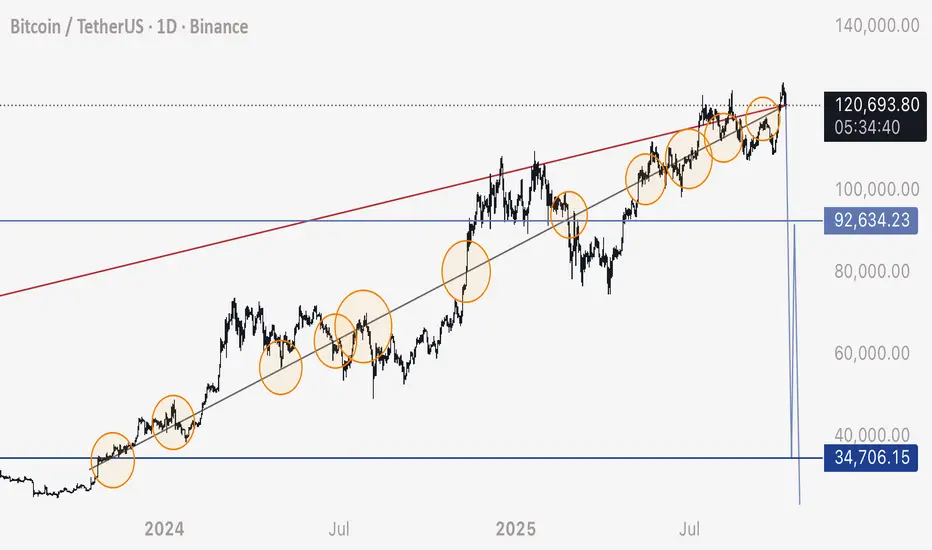
BTC - Explanation of My 35,000 Drop Prediction Here is a broken down explanation of why I’ve been predicting Bitcoin dropping to 35,000
1. We can see this diagonal ascending trendline and how price has been respecting it by looking at the various contact points circled in orange.
2. Bitcoin has been consolidating on either side of this trendline since the beginning of it.
3. Liquidity has been building and building in the form of sell orders / long stop losses all the way down as price has made no substantial recovery of these zones.
4. Eventually Bitcoin will stick it as resistance and as soon as those order blocks are hit, there is enough orders in place (stop losses and liquidations) to drop the price to 35,000 in a very short time period. Essentially, the limit orders are in place like a staircase all the way down, they will fill one after the next and the chart has all the fuel and propellant needed to make a wick to that level.
5. The only reason we would see price consolidate so truly to a bearish line like this is to attract buys and longs as it slowly moves up - this mechanic of the market makes it not only possible but highly likely to happen and we don’t need any sort of black swan or bad news. The orders are ready to set off.
6. This is way more likely than people seem to think. Every long opened has a stop loss order or liquidation order for the entire position size. We can CLEARLY see, just by looking at the chart, these wide open gaps on the chart are filled with these orders. They have been left intact PURPOSELY in order to design a natural, fast wick of a movement.
7. This wick will reclaim all of the market makers and liquidity providers liquidity to them, and de-leverage all open positions.
I truly believe this will happen exactly as I say it will.
- Drop to 35,000
- Very fast drop (2-12 hours for the whole movement - if not, 1 hour)
I’d encourage readers to at least be mindful of the rational behind this analysis and take proper precautions to protect yourselves.
Respectfully,
- DD
MvrkGATEIO:MVRKUSDT
🔹 Support and Resistance Levels🔹
🔹 Resistance (R1) $0.0891 Main horizontal resistance — previous rejection zone where price failed to break through multiple times.
🔹 Mid-term Target / Minor Resistance $0.1024 Next target if $0.0891 breaks — aligns with prior consolidation top.
🔹 Support (S1) $0.0730 Strong horizontal support — multiple bounces and wick rejections from this zone.
🔹 Deeper Support (S2) $0.0660–0.0680 If $0.0730 fails, this is the next liquidity pocket from previous accumulation.🔹
Disclaimer : Not Financial Advice

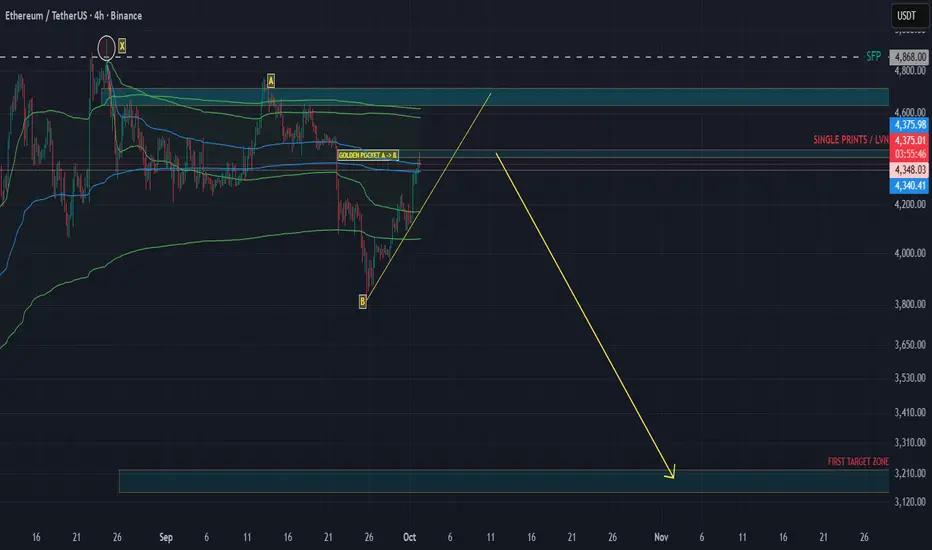
ETHEREUM - THE TRAP IS UNFOLDING – EXPECT A BLOODBATH!As I mentioned in my latest Bitcoin and ChainLink analysis , I believe the crypto market is setting up for a huge long squeeze. Let’s break down why this move looks fragile and why you should be cautious.
What do we need for a healthy rally?
Spot demand – Real buyers (spot market) need to step in and absorb supply. Without this, rallies are built on leverage and tend to collapse quickly.
Controlled leverage – A healthy move isn’t fueled by overleveraged longs. If open interest keeps spiking while spot demand is flat or negative, that’s a recipe for a squeeze.
Auction structure support – Price should build strong bases (value areas, balanced profiles) instead of just ripping up through inefficiencies.
Right now? We don’t have these ingredients.
Step 1: Look at CRYPTOCAP:TOTAL3
For those unfamiliar, CRYPTOCAP:TOTAL3 is the crypto market cap excluding BTC and ETH. It’s a great index to measure the “altcoin market” and often shows where broader crypto is heading.
Now let’s apply some tools:
Anchored VWAP (AVWAP): Tracks the average position of buyers/sellers from a specific swing (like a cost-basis anchor).
Fixed Range Volume Profile (FRVP): Shows where most trading occurred (value area, POC, low/high volume nodes).
What CRYPTOCAP:TOTAL3 shows:
The upper AVWAP band from the swing low (A) is at 1.12T.
The upper AVWAP band from the swing high (B) is also at 1.12T.
Price is retracing into the Value Area High (VAH). This lines up with:
An ascending trendline retest and a Fib retrace (0.75–0.786 zone).
When AVWAP bands from opposite swings collide like this, it’s a double-sided supply zone.
Longs from the low see this area as “expensive” → they reduce risk.
Shorts from the top defend their break-even.
This creates a congestion zone where strong reversals often happen unless fresh spot demand breaks through.
Example: Imagine two teams pushing on opposite sides of a door at the same time. Unless one side gets backup (spot demand), the door doesn’t move — it slams shut.
Step 2: Apply This to CRYPTOCAP:ETH
Now, let’s clear one thing up: CRYPTOCAP:TOTAL3 excludes both Bitcoin and Ethereum. It’s basically the “altcoin index,” showing how the rest of the market behaves without the two giants.
But here’s why it still matters for ETH:
ETH often moves in strong correlation with altcoins, especially during risk-on or risk-off events.
When CRYPTOCAP:TOTAL3 is at a critical resistance or AVWAP collision zone, it usually signals that risk appetite across alts is stretched.
And since ETH trades like a “bridge asset” between BTC and alts, it tends to get caught in the same flows.
So while ETH isn’t included in CRYPTOCAP:TOTAL3 , the technical structure of CRYPTOCAP:TOTAL3 gives us strong hints about where ETH and the altcoin market could be heading.
Step 3: Check USDT Dominance (USDT.D)
Yes, you can chart USDT dominance, and it’s often a leading indicator. Why?
If USDT.D goes up → money flows into stablecoins → crypto selling pressure.
If USDT.D goes down → money flows into crypto → bullish risk-on move.
Right now:
USDT.D broke out of a descending trendline and is retesting the breakout region.
It’s also printing a harmonic pattern that suggests upside continuation.
Step 4: Order Flow – who’s really buying ETH?
This is where the story gets clear:
Aggregated Spot CVD = trending down heavily.
Price goes up while spot CVD goes down = spot is selling into strength → no real demand.
Futures CVD (stablecoin-margined) = trending up heavily.
This means perps are pushing price higher with leverage.
Futures CVD (coin-margined) = trending down.
Another divergence → no strong confirmation from that side either.
Stablecoin OI:
First impulse up = OI dropped → shorts closing, not buyers entering.
Since Oct 1, OI rising → new longs piling in.
ByBit Order Flow: heavy leveraged longs entering, but looks like absorption.
For those that don't understand it:The rally is built on FOMO leverage longs, not real buyers. That’s fragile.
Conclusion
All the ingredients are here for a mega squeeze:
CRYPTOCAP:TOTAL3 at double AVWAP + VAH + Fib confluence,
ETH backfilling inefficiencies into double AVWAP supply,
USDT dominance signaling risk-off,
Order flow showing no spot demand, only leveraged perp longs.
When this unwinds, it won’t just be ETH. Expect broad crypto to follow.
The trap is unfolding. Don’t get caught on the wrong side.
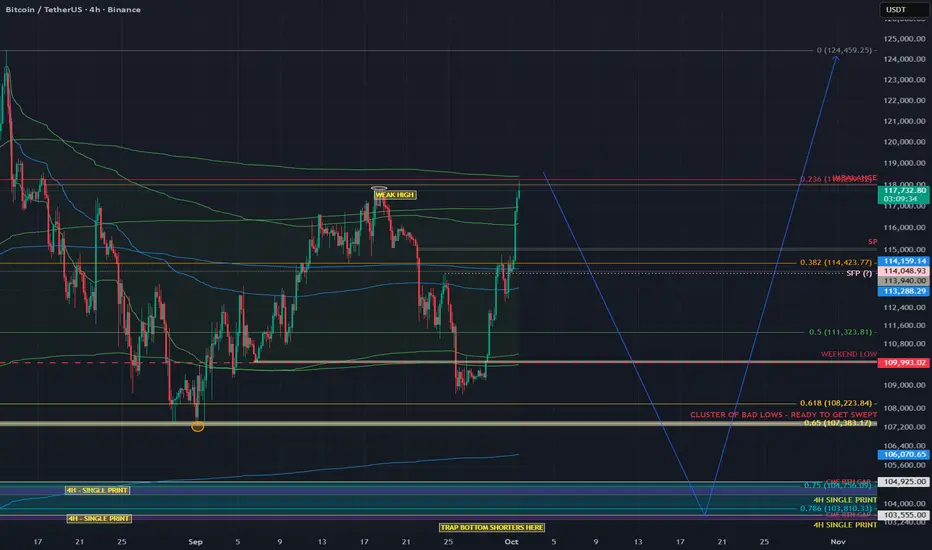
BITCOIN’S PUMP BEFORE THE DUMP — CRYPTO ABOUT TO CRASHTRADERS, WE ARE STARING RIGHT INTO THE EYE OF THE STORM. BITCOIN’S “TOO GOOD TO BE TRUE” RALLY IS BEING PROPPED UP BY LEVERAGED PERPS, NOT REAL SPOT BUYING. THE CHART IS SCREAMING EXHAUSTION: AVWAP BANDS COLLIDING, ORDER FLOW MAXED OUT WITH AGGRESSIVE LONGS, AND A DANGEROUS IMBALANCE AROUND 118K. THIS IS THE PERFECT BREEDING GROUND FOR A MEGA LONG SQUEEZE THAT WILL NOT ONLY RIP THROUGH BITCOIN BUT DRAG THE ENTIRE CRYPTO MARKET DOWN WITH IT. THE PUMP IS THE TRAP. THE DUMP IS LOADING
TLDR;
This leg looks futures-driven, not spot-backed. We’re pushing into AVWAP outer-band confluence with imbalances near 118k while leveraged longs pile in. Base case: sweep the mid-Sept Weak High, fail, rotate down toward 104k (and maybe 98.5k). I’ll flip only if spot CVD takes the lead and price accepts above the AVWAP band cluster.
Why I think the “mega long squeeze” is loading
1) Who’s actually buying? (Spot CVD vs Futures CVD)
Spot CVD: still negative/underwhelming across the push → real buyers (spot) aren’t lifting.
Futures CVD (stablecoin-margined): rising with Open Interest → perps are doing the heavy lifting.
Translation: Leverage is pushing price, not genuine spot accumulation. These moves are fragile and unwind hard when OI compresses.
2) AVWAP confluence (the auction math)
I’m tagging anchored VWAPs from opposing pivots (swing low→high and swing high→low).
The outer bands from these anchors are overlapping in the same zone → both bottom-anchored longs see it as expensive (profit-taking), and top-anchored shorts defend their break-even.
That overlap = double-sided supply. Historically, these reject unless fresh spot demand blows through (which we don’t have… yet).
Still have bad September lows that are likely to be swept at 107k~
3) 118k imbalance
There’s an inefficient push / imbalance around 118k. Thin structure often gets tapped/swept, then mean-reverts if the follow-through is purely leveraged.
4) Order flow is too aggressive (late longs)
OI up + positive delta into resistance = new longs chasing.
On footprint, you can see buy-side aggression meeting absorption near the top of the move. That’s classic trap fuel if we print an SFP.
Trade idea (conceptual, not financial advice)
Base case path (bearish):
✅ Sweep the Weak High (mid-Sept) into 117.8–118.8k (imbalance + AVWAP band confluence).
✅ Print a Swing-Fail Pattern (SFP) / rejection wick on 5–15m with:
Spot CVD NOT confirming (stays flat/negative),
OI spikes while delta stalls (late longs absorbed).
Short after the reclaim/failure back below the swept high; stop above the SFP high.
Targets / magnets:
113.2–114.1k (0.382 zone / local AVWAP midlines)
111.3k (0.5 retrace / prior balance edge)
109.9–109.3k (weekend low / prior node)
106.0–104.9k (SP + LVN cluster, high-prob test area)
Stretch: 103.5k (4H single print) → 98.5k if liquidation cascade extends.
validation / flip criteria:
Acceptance above the AVWAP outer-band cluster and 118.8k with:
Spot CVD turning positive and making higher highs,
OI stable or down on further upside (less leverage dependence).
If that happens, I stand down on the short idea and reassess for continuation
HYPE SHORT #Update2Hello everyone 😍
💁♂️ Let's have an update for the HYPE-USDT cryptocurrency
👉 In the first analysis, we identified two paths, one is a decline from the same area,
The second is a decline from a higher area after consuming liquidity
From the first area, it fell by 18% and then moved up and consumed the high liquidity and the main decline started and fell again by 33%. 🔥
👉 It seems that the first and second targets, which are the lower orange areas, are within reach.
The first orange area is the $36.5 area.
The second orange area is the $31.5 area.
The third area is the $26 area (low probability) compared to the two areas above.
The blue path is the path I identified in the first analysis.
The red line is also a head and shoulders pattern on the daily and 4-hour time frames (the head and shoulders are inside the red circle)
The upper blue area is also the QM-level.
🤔 Did you use this analysis?
⚠️The analysis may not reach the final target, so at each target, if you make a good profit and see signs of a trend change, you can exit the trade or manage your capital.
⚠️ None of the analysis is a recommendation to buy or sell, but simply my personal opinions on the charts. You can use the charts and choose any that interest you and take a position if you wish.
To support me, I would appreciate it if you boost the analysis and share it with your friends so that I can analyze it with more energy for you, my dears. Thank you all. 💖

M-USDT SHORT #Update1Hello everyone 😍
💁♂️ Let's go for an exciting update
The M-USDT cryptocurrency touched 3 of its targets with a Sharpie move
It fell 34% from where I placed the analysis and 40% from where the trigger entered until now 🔥🔥🔥
In the previous analysis, I said what the signs of the decline were
It wouldn't be bad to review it together once again
💁♂️ Signs of trend weakness:
The slope of the tops is decreasing
The tops are getting closer
The chart's movement angle is also decreasing and becoming negative
Lower tops are forming
Lower bottoms are forming
Did you use this analysis?
⚠️The analysis may not reach the final target, so at each target, if you make a good profit and see signs of a trend change, you can exit the trade or manage your capital.
⚠️ None of the analysis is a recommendation to buy or sell, but simply my personal opinions on the charts. You can use the charts and choose any that interest you and take a position if you wish.
To support me, I would appreciate it if you boost the analysis and share it with your friends so that I can analyze it with more energy for you, my dears. Thank you all. 💖

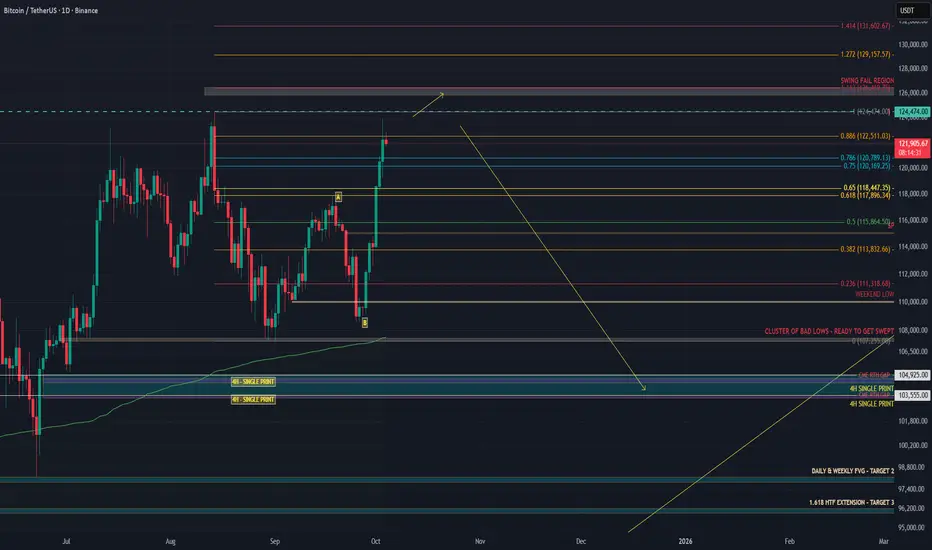
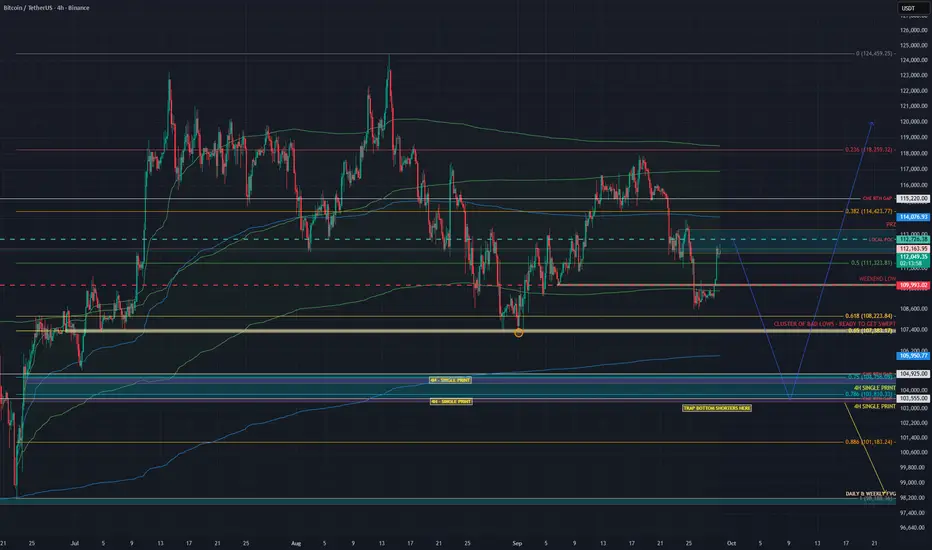
SHORT BITCOIN – THE TRAP IS BELOW, NOT ABOVE!Traders,
From the current levels around $112.8K–$113K, I believe Bitcoin is setting up for another leg down into the $104K region.
Why? Because at current levels we already have multiple Anchored VWAPs (AVWAPs) lining up from different swing high → low auctions, which makes this area heavy resistance.
That means the probability of retracing higher is limited, and instead, the market is more likely to drop into $104K — where there’s significant unfinished business — before a proper bounce can occur.
🔮 Hypothesis
From current levels ($112.8K–$113K), price will reject and move down toward $104K.
Retracement higher than $113K is unlikely given AVWAP confluence + resistance stack.
The $104K region will act as a bounce zone, potentially with a Swing Failure Pattern (SFP) wick.
📊 Data & Confluence
🔻 Why $104K Is a Magnet
HTF Point of Control (POC): The high-volume node where markets naturally seek equilibrium.
HTF AVWAP: Anchored VWAP from major pivots aligns here, marking fair value.
4H TPO Single Prints + Fib Retracements (0.75–0.786): Gaps in auction structure converge with key Fibonacci levels.
CME Gap: The $104K CME RTH gap still needs filling — markets often return here for balance.
Sept 1st Low (Weekly TPO): Poor excess signals unfinished auction business, pulling price back down.
🔼 Why Current Levels Won’t Hold
Clustered AVWAPs (different swing high → low auctions): Acting as strong dynamic resistance.
Multiple POCs at current zone: Volume saturation suggests exhaustion.
Fibonacci confluence + harmonic pattern: Pointing to lower continuation.
💵 Macro Flows
USDT Dominance (USDT.D): Breaking higher → capital shifting to stablecoins → bearish BTC.
Aggregated CVD: Spot CVD drifting slightly higher, but futures CVD flat with no OI expansion.
→ No real demand behind the move.
📌 My Take
Bitcoin is most likely to:
Reject from current AVWAP resistance ($112.8K–$113K).
Drop into $104K, clearing imbalances and luring in shorts below the 0.786 fib.
Trigger a wick/squeeze move up (Swing Failure Pattern) to trap those late shorters.
⚠️ If $104K fails to hold, next target is the imbalance zone around $98.5K.
✅ Conclusion
The market is loaded with resistance at current levels. Until that’s broken with conviction, the path of least resistance is down into $104K.
That’s where the real battle will be.
Trade safe, manage risk, and don’t get trapped on the wrong side of the wick.
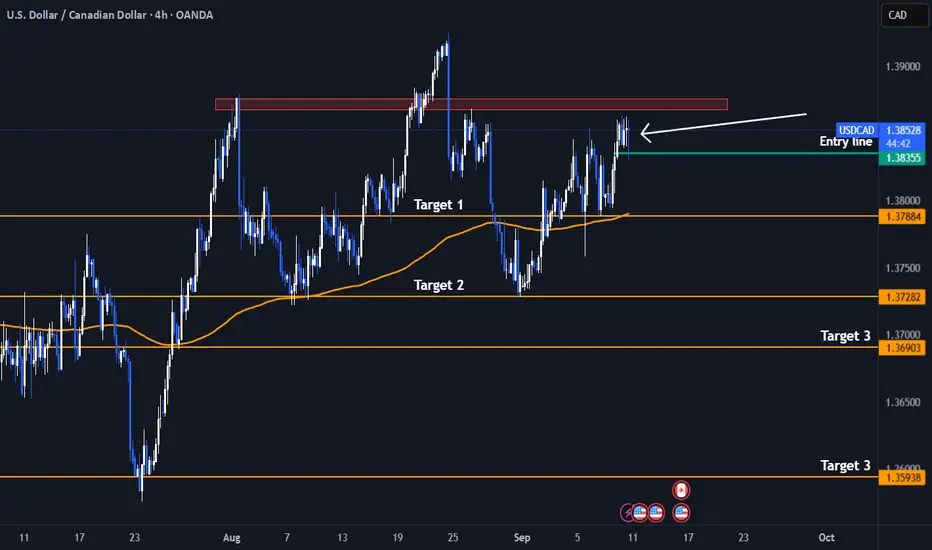
Short! Short! USDCAD - Double Head and Shoulder PatternI have identified a clear head and shoulders pattern forming within a larger head and shoulders structure on the daily timeframe for USD/CAD, indicating a potential bearish reversal.
From a fundamental perspective, several key factors are contributing to the current weakness in the Canadian dollar against the US dollar:
Canada's labor market showed significant weakness in August 2025, with a notable loss of 65.5 thousand jobs and a rise in unemployment to 7.1%, the highest in years. This has increased market expectations for monetary easing from the Bank of Canada (BoC).
Although core inflation remains above target, the weak jobs data is pushing the BoC towards potential rate cuts or a more accommodative policy stance, which weighs on the Canadian dollar.
The market is currently pricing in a very high chance (around 98%) of an additional rate cut by the BoC in September, following previous reductions to 2.75%. This dovish stance contrasts with the Federal Reserve’s more cautious or hawkish approach, creating a wider interest rate differential that supports US dollar strength.
Additionally, declining oil prices, a major export for Canada, are exerting further downward pressure on the CAD.
While recent US economic data has been mixed, the Fed is generally seen as less dovish than the BoC, sustaining demand for the USD.
Trade tensions and geopolitical risks between the US and Canada add to concerns over Canada’s growth outlook, contributing to CAD depreciation risk.
Trade Tip
A strong close below the Entry line will be a perfect entry /4hr TF
Stoploss : Above the Left Shoulder (Red Rectangle)
In summary, the combination of a weakening Canadian economy, dovish BoC bias, lower oil prices, and interest rate divergence between the US and Canada all support a bearish outlook for USD/CAD, which aligns well with the bearish head and shoulders pattern I have spotted on the chart.
Not an Investment Advise
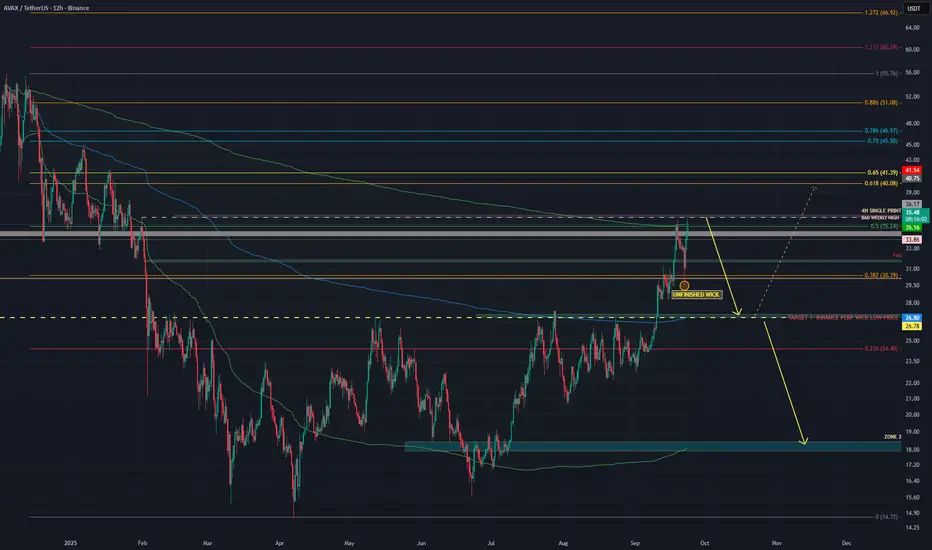
$AVAX – ARBITRAGE DUMP DETECTED – READY TO BALANCE?Traders,
Last time we nailed CRYPTOCAP:AVAX from 22.80 → 30 → 35 almost pixel perfect.
Now the setup may be flipping. Let’s break it down with the THETA method:
🔹 Imbalances
Perps vs Spot: Binance Perps wicked down to $26.83, Spot hasn’t filled it yet → liquidity gap below.
Market Profile: Price swept the 31 Jan weekly high, a “bad high” (too much excess, unstable).
Oscillators: RSI shows bearish divergences on multiple timeframes → momentum fading.
Context: Market is repairing imbalance above to build liquidity, which can later be used to fix the unfinished business below.
🔹 Order Flow & AVWAP
Aggressive buyers stepping in at $34–36 (since CME open).
Price is now trading at the upper band of the HTF AVWAP, a zone that often signals overextension vs volume-weighted positioning.
The unfilled wick imbalance at $26.83 is also the price of the HTF AVWAP itself (blue line) → strong confluence for a revisit.
If downside continues, those aggressive buyers will be trapped, fueling the move lower.
Next key check: At $26.90, we need to watch data + price action to define if AVAX stabilizes there or breaks further.
✅ Conclusion
Price is showing signs of distribution at the HTF AVWAP upper band. Liquidity is being absorbed above, and the confluence of the wick imbalance + HTF AVWAP at $26.83 strengthens the case for a downside move.
👉 Key takeaway: Longs chasing into AVWAP extremes = potentially trapped buyers, with the market likely rotating back to $26.90–26.83 before the next decision point.
EURUSD: Price Exit from Pennant and DropHello everyone, here is my breakdown of the current Euro setup.
Market Analysis
From a broader perspective, the price has been consolidating in a wide range between the 1.1600 support level and the 1.1720 resistance level. This extended period of balance has now tightened, leading to the current, more compressed pattern where a significant move is becoming more likely.
Currently, the price action is coiling within a pennant pattern. This compression of volatility suggests that energy is building for a breakout. The price is now trading very close to the apex of this pennant, testing the upper boundary near the major horizontal Resistance Zone.
My Scenario & Strategy
While a breakout from a pennant might seem likely, the overhead resistance at the 1.1720 level is historically significant. I'm watching for a situation where the market fakes a move to the upside to trap optimistic buyers before revealing its true intention.
Specifically, I'm watching for a brief dip, followed by a rally that pushes the price just above the pennant's resistance line and into the 1.1720 - 1.1730 resistance area. The key signal would be a swift and forceful rejection from this area, pushing the price back below the breakout point. And the primary target for the resulting decline is the 1.1600 level, which aligns with the major horizontal support zone.
That's the setup I'm tracking. Thank you for your attention, and always manage your risk.

BTC - Following Crash PlanBTC has been following my analysis of predicting a potential crash here.
We can use DXY to anticipate when a significant liquidity grab / flash crash will occur.
Since DXY is retesting a major breakdown on the weekly - monthly, it would be wise to watch for volatility today on Bitcoins price, noting these liquidity regions if we are about to enter a bull run ranging out 3-5 years.
Targets and potential corrective patterns marked on this chart.
Happy trading.

#Bitcoin Weakness Alert: $BTC is showing weakness as it struggle#Bitcoin Weakness Alert:
CRYPTOCAP:BTC is showing weakness as it struggles around the 115K (50 EMA) level.
🔸 Key Support:
If BTC loses the 115K support and resists below the 50 EMA, downside pressure increases. The next critical level is 110K.
🔸 Upside Target:
Holding above 115K with strength can trigger a move back toward 120K and possibly extend to 125K.
🔸 Risk Level :
A confirmed break below 110K will likely open the path for a dump toward 100K.🚨
🔸 Outlook:
Monitor 115K closely. If price holds above, upside continuation is possible. If broken, expect a deeper correction with 110K as the last major support before 100K.
American Eagle looks like Litecoin did before its pump in 2017.Buying American Eagle looks really smart here. We could see a Litecoin-esque pump similar to 2017. This would, of course, lead to a large bear market, but in the meantime, the stock is looking very bullish and ready for a parabolic run. Loving this setup.
As always, stay profitable.
- Dalin Anderson

Avalanche (avax)Avax usdt Daily analysis
Time frame daily
As you see on the chart , if decrease of avax stops on 17.5 $ the pattern (double bottom)will create.
So we will see the end of decreasing and avax will reach to 25$
On the other hand , if price breaks down and reach 15 EURONEXT:OR less , this pattern will failed

Ravencoin ( RVN)RVN usdt Daily analysis
Time frame 4hours
Risk rewards ratio >1.5
Target = 0.01133
Short position for short time

Bull Trap Confirmed: GBPUSD's 8% Rally Faces ExhaustionLets Face it we had a great 6 months already clocking 60%+ Returns already.
And after sitting ducks for almost 2 months now we finally have a trade.
- Its a very self explanatory chart
- Trading at resistance
- Head & Shoulder pattern
And the best part the right shoulder is still yet to be formed! My favourite type of entry.
1.It gives a better risk reward ratio (1:7 expected)
2.Better Entry (No long red candles)
3. And even if the pattern fails it we may still reach the neck line which is target 1.
Entry Criteria
- A Red candle at the entry Line Marked
- Stoploss Above the Entry Candle
Target 1- 1.3361
Target 2- 1.3252
Target 3- 1.3169
Keep Your Risk Reward Intact! Not An investment Advice

Gold Dumped | HaHa!We anticipated gold to dump heavily, during either London or New York Session. Yes, it dumped during New York Session. Entry was taken on 1 minute after FVA got disrespect/run through.

USDT - Hope AheadMorning my friends,
Figured I'd share a little bit of this USDT chart.
Deff showing a downtrend, even though our beloved coins are still suffering. Thats mainly because of BTC.D.
Once USDT moves lower, signaling a breakdown we should get a big relief, that if maybe paired with BTC.D moving lower as it is also near very strong resistance a bull market for alts will begin.
Keep an eye on this descending triangle breakdown.
Trade thirsty, my friends!

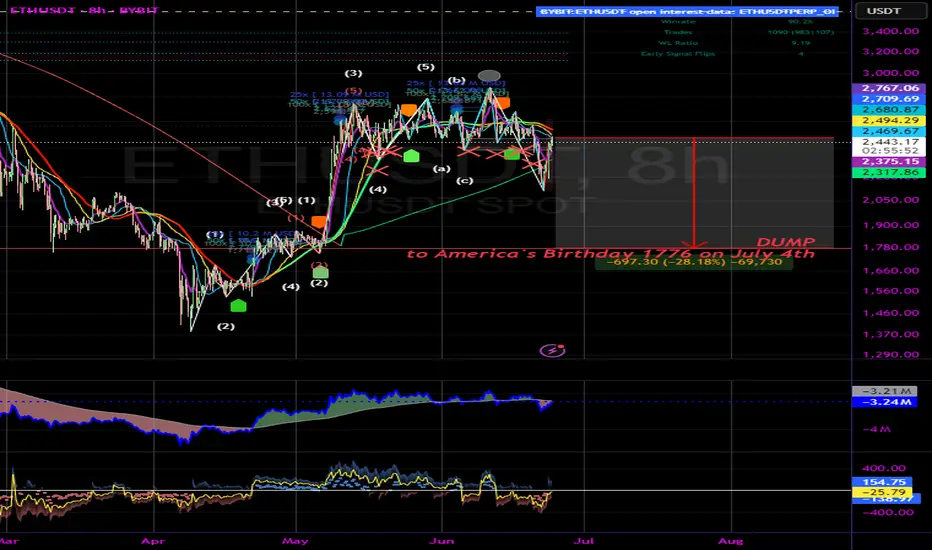
ETH Dumping to 1776 in honor of America's birthdayBART express incoming. Nice liquidity grab down there as well.
Not financial advice.
Happy July 4th!
Dogecoin is dead, short it to zeroDead coin already RIP
Doge coin can't go any higher and had lost fame and momentum

$BTC/USDT MAJOR PUMP? or MAJOR DUMP?BTC, the worlds biggest and fastest growing coin. With a market cap in the Trillions, we are facing a major moment.
Will price dump? or will it pump and go above and beyond.
Lets find out in this analysis!
1. Trend Overview
HTF Bullish:
Price remains above the long-term bullish trendline, showing strong macro support.
Recent price action is consolidating within a major supply zone and liquidity cluster — signaling indecision before a breakout or breakdown.
📈 2. OBV (On-Balance Volume) Analysis
OBV is coiling in a symmetrical triangle, indicating a volume squeeze.
This tightening range typically precedes a major breakout or breakdown, matching the price consolidation near resistance.
🔄 Market Structure
Price has formed a potential top just under the supply/liquidity zone (~$110,000–$112,000).
Swing High is defined just below $112K.
Key structure zones are:
Resistance zone at current levels.
Support zones:
1D FVG ($97K) and Weekly FVG ($87K–$93K)
🟪 Supply & Demand Zones
Supply Zone: $100k - $112k — multiple rejections here indicate this is a key short-term ceiling.
Demand Zone: Deep support between $50-$57K, aligns with trendline and historical value area.
🔵 Fair Value Gaps (FVGs)
1D FVG: $97K area — may act as magnet if price breaks below resistance.
1W FVG: $87K–$93K — stronger structural level to watch.
If both are filled, price may meet the bullish trendline around $90K.
🧠 Liquidity Zones
Above current price: ~$112K is marked as a liquidity grab area — stop hunts may occur before major reversal.
Below: FVG zones could trigger a liquidity sweep downwards before reversal.
🔴 Volume Profile
Strong high-volume node (HVN) around $80K–$97K: acceptance zone, likely to act as magnetic support.
Above $110K is a low-volume node (LVN): if broken cleanly, price may accelerate quickly toward $120K+.
✅ Bullish Scenario
Break above $112K → sweep liquidity → continuation toward $120K–$125K. (Price Discovery)
OBV breakout upwards would confirm.
Hold above FVG 1D if retested = healthy bullish continuation structure.
❌ Bearish Scenario
Rejection at supply → drop to FVG 1D ($97K), then potentially Weekly FVG (~$93K).
If OBV breaks downward, it confirms bearish volume divergence.
Breakdown below trendline could target deeper into demand zone (~$70K+).
📌 Summary
Bias: Neutral-bullish short term, bullish macro (above trendline).
Key Breakout Level: $112K.
Critical Support: $91K–$97K (FVG cluster).
Confirmation: OBV breakout + clean structure break.
Invalidation: Weekly close below long-term trendline and FVG zones.

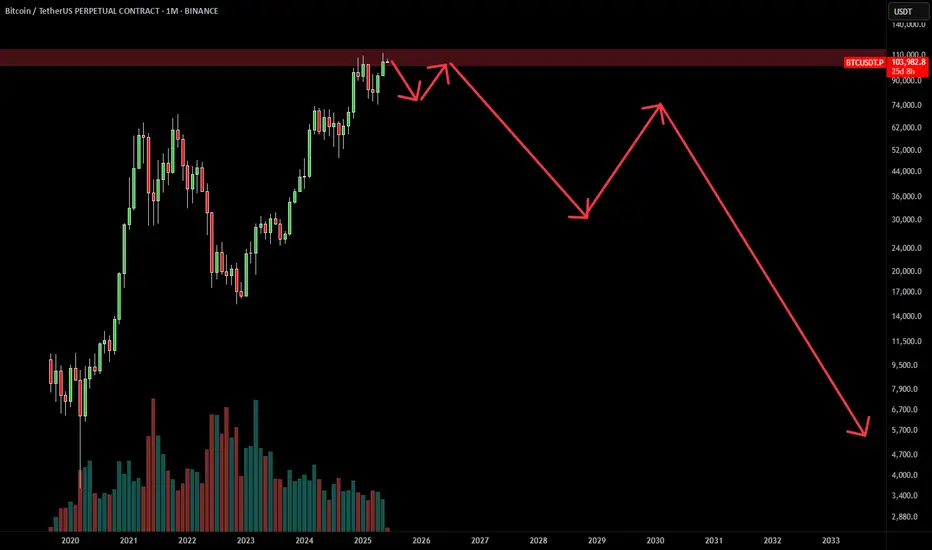
The Collapse of the Bitcoin ExperimentFew are prepared for this scenario, yet it's the most probable one: Bitcoin is heading for a major crash in the coming years.
What was once a revolutionary idea has become a centralized shitcoin, failing nearly every purpose envisioned by its creator. Aside from gamblers and speculators, hardly anyone truly believes in Bitcoin anymore.
The experiment has failed — it's time to accept its fate.
This will be the biggest short trade in the history.
05 June, 2025
Doomsie