GC Futures – Are We Flipping Bearish Into Midweek?Tuesday closed below Monday’s low, hinting at a potential shift in sentiment.
Currently, price is approaching a 1H FVG inside the prior Asian range, just below the Weekly Low (W-L) and Daily High (D-H) — a perfect liquidity pocket.
I’m watching for signs of rejection here to confirm a bearish continuation. If price holds above this area, we may see a short squeeze back into higher value.
Bias remains bearish, but confirmation is key.
What are you seeing here — are we setting up for continuation or a fakeout?
#Gold #Futures #GC #DayTrading #SmartMoney #OrderFlow #ICT #NoFOMO
DXY

DXY RISING TRENDLINE BELOW|LONG|
✅DXY Price is respecting the rising trendline, showing consistent higher lows. Expect bullish continuation toward the target zone after the retest, as price seeks to rebalance inefficiency left from prior impulsive moves. Time Frame 7H.
LONG🚀
✅Like and subscribe to never miss a new idea!✅

DXY Approaching 98.900 — Weak Labor Market Could Push Fed DovishHey Traders, in today’s trading session we’re monitoring DXY for a potential selling opportunity around the 98.900 zone.
The index continues to trade within a descending channel and is currently in a correction phase, approaching the upper boundary near 98.900, which aligns with channel resistance.
Fundamentals: Recent data continues to show signs of a weakening U.S. labor market, with job growth slowing and unemployment ticking higher. This softening backdrop increases pressure on the Federal Reserve to adopt a more dovish stance in upcoming meetings, potentially weighing further on the dollar.
Next move: Watching for bearish confirmations around the 98.900 zone — rejection here could resume the broader downtrend.
💬 What’s your outlook on the Fed’s next move? Drop your thoughts in the comments!

EUR/USD – Buyer Zone Activation | Wave Projection 🌊We’re currently watching EUR/USD retrace into the buyer zone (1.1620–1.1645).
This area aligns perfectly with Wave D of the ongoing corrective structure, setting up for a potential Wave C impulse toward 1.16925.
📊 Technical Outlook:
Structure: ABCD completion before impulsive C
Key Support Zone: 1.1620–1.1645
Target Zone: 1.1690–1.1700
Bias: Bullish from buyers’ zone
Timeframe: 1H
⚠️ Invalidation:
If price closes below 1.1620, structure may extend into a deeper correction.
🧠 Insight:
Smart money often accumulates within such retracement zones before the next impulsive leg. Patience at key levels builds confidence and accuracy.

XAUUSD - Will Gold Continue to Fall?!Gold is trading below the EMA200 and EMA50 on the 30-minute timeframe and is trading in its descending channel. The reduction in its downward momentum in the demand range will provide us with a better risk-reward buying position. A move towards the supply range above the channel will be our next short trade!
Gold prices fell below $4,000 per ounce for the first time since October 10, following a sharp $125 decline.
According to a Reuters survey, the average gold price in 2026 is expected to reach $4,275 per ounce, while silver prices are projected to average $50 per ounce in the same year.
For 2025, the survey anticipates an average gold price of $3,400, up from $3,220 in the previous poll, while the average silver price is forecasted to rise to $38.45 from $34.52 previously.
Analysts at Nomura stated that U.S.–China relations have entered a repetitive cycle of tension, escalation, and temporary détente, likely forming a “new normal” in the long term.
Lu Ting, Nomura’s chief China economist, noted that the world’s two largest economies appear to be settling into a predictable pattern of “strain–escalation–pause”, which may define the framework of their relationship in the foreseeable future.
Recent trade talks in Kuala Lumpur hinted at a temporary easing of friction, with both sides reportedly considering limited concessions, such as extending tariff suspensions and resuming soybean imports from the U.S.
However, deep-seated disputes remain unresolved — including export restrictions on rare earth elements, compliance with trade commitments, and broader geopolitical disagreements — all of which cloud the outlook for bilateral relations.
Lu cautioned that while short-term cooperation may continue due to mutual economic dependence, long-term strategic competition between Washington and Beijing is expected to intensify.
Nomura believes this recurrent cycle of conflict and reconciliation will likely become the enduring pattern of U.S.–China relations.
Such a backdrop implies persistent volatility in global markets, particularly in commodities and technology sectors, which are highly sensitive to trade developments between the two nations.
Investors should prepare for alternating periods of optimism and renewed tension.
Meanwhile, Donald Trump’s proposed tariffs against Canada may turn into a major self-inflicted setback, as the move faces both a legal challenge before the U.S. Supreme Court and bipartisan opposition.
Next week, the Supreme Court is set to hear a case focusing on Trump’s use of the International Emergency Economic Powers Act (IEEPA) to justify these tariffs. Trump initially invoked an emergency declaration related to fentanyl to impose them — despite the fact that such powers are typically reserved for sanctions against U.S. adversaries.
The case represents not only a test of the tariffs’ legality, but also a measure of Trump’s and MAGA’s influence over the Court.
Notably, Senator Lisa Murkowski, a Republican, joined over 200 Democrats in sending a letter to the justices urging them to strike down the tariffs.
The oral arguments are scheduled for November 5, and the final ruling, which could serve as a major market mover, is expected sometime next year.
Currently, prediction markets estimate a 38% probability that the tariffs will be overturned.
At the same time, Morgan Stanley reported that U.S. dollar positioning has turned positive for the first time in several months, reflecting renewed investor confidence in the U.S. economic outlook.
This shift comes amid rising political instability in Japan and France, which has diminished the appeal of non-dollar assets and strengthened capital flows toward the greenback.
Strategists at the bank added that demand for downside protection against the dollar has declined, indicating that investors perceive a low risk of a sharp correction in the near term.
Nevertheless, Morgan Stanley warned that this uptrend might not be sustainable — if U.S. economic data, particularly employment figures, fail to show significant improvement, the dollar could again face renewed downward pressure, and rate-cut expectations from the Federal Reserve could rise.
Finally, Treasury Secretary Scott Bassent confirmed that five candidates have been shortlisted to succeed Jerome Powell as Federal Reserve Chair:
Christopher Waller, Michelle Bowman, Kevin Warsh, Kevin Hassett, and Rick Rieder.
Bassent stated that one more round of interviews will take place, and he plans to submit the final shortlist to President Trump after Thanksgiving, with a final decision expected before year-end.

USDCAD Faces Pressure as DXY Correction Nears Key Resistance!!Hey Traders, in today’s trading session we are monitoring USDCAD for a potential selling opportunity around the 1.40200 zone.
The pair remains in a broader downtrend and is currently in a correction phase, approaching the trendline and resistance area at 1.40200.
From a macro perspective, the US Dollar Index (DXY) is testing its 98.900 channel resistance, where upside momentum may fade amid a weakening U.S. labour market and rising expectations for a dovish shift from the Fed.
A potential DXY rejection from that level could amplify downside pressure on USDCAD, especially if oil continues to find demand and supports the Canadian Dollar.
Next move: Watching for bearish confirmation near 1.40200 for potential continuation of the broader downtrend.
💬 What’s your view on USDCAD and the Dollar outlook this week? Share your thoughts below!

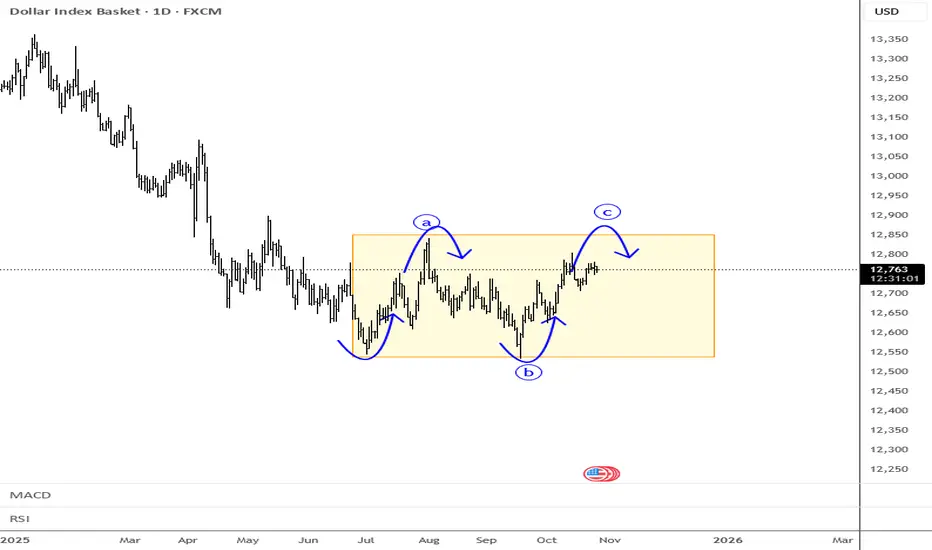
DXY Long-Term big surprise revealed by Gold! Hi Guys,
I've been doing some research on the DXY and Gold charts and I've been reading news headlines
For the past 20 years and trying to link it with both DXY and Gold charts and I've found out
Some interesting facts that literally flipped the market upside down.
So I pointed each even with the corresponding candle and I would love to know what do you guys
Think about this so feel free to comment and share your opinion on what's really going on behind
The scenes.

DXY FRGNT Daily Forecast -Q4 | W44 | D28| Y25 |📅 Q4 | W44 | D28| Y25 |
📊 DXY FRGNT Daily Forecast
🔍 Analysis Approach:
I’m applying Smart Money Concepts, focusing on:
Identifying Points of Interest on the Higher Time Frames (HTFs) 🕰️
Using those POIs to define a clear trading range 📐
Refining those zones on Lower Time Frames (LTFs) 🔎
Waiting for a Break of Structure (BoS) for confirmation ✅
This method allows me to stay precise, disciplined, and aligned with the market narrative, rather than chasing price.
💡 My Motto:
"Capital management, discipline, and consistency in your trading edge."
A positive risk-to-reward ratio, paired with a high win rate, is the backbone of any solid trading plan 📈🔐
⚠️ Losses?
They’re part of the mathematical game of trading 🎲
They don’t define you — they’re necessary, they happen, and we move forward 📊➡️
🙏 I appreciate you taking the time to review my Daily Forecast.
Stay sharp, stay consistent, and protect your capital
— FRNGT 🚀
TVC:DXY

DXY FRGNT Daily Forecast -Q4 | W44 | D27| Y25 |📅 Q4 | W44 | D27| Y25 |
📊 DXY FRGNT Daily Forecast
🔍 Analysis Approach:
I’m applying Smart Money Concepts, focusing on:
Identifying Points of Interest on the Higher Time Frames (HTFs) 🕰️
Using those POIs to define a clear trading range 📐
Refining those zones on Lower Time Frames (LTFs) 🔎
Waiting for a Break of Structure (BoS) for confirmation ✅
This method allows me to stay precise, disciplined, and aligned with the market narrative, rather than chasing price.
💡 My Motto:
"Capital management, discipline, and consistency in your trading edge."
A positive risk-to-reward ratio, paired with a high win rate, is the backbone of any solid trading plan 📈🔐
⚠️ Losses?
They’re part of the mathematical game of trading 🎲
They don’t define you — they’re necessary, they happen, and we move forward 📊➡️
🙏 I appreciate you taking the time to review my Daily Forecast.
Stay sharp, stay consistent, and protect your capital
— FRNGT 🚀
TVC:DXY

Bullish reversal?The US Dollar Index (DXY) is reacting off the pivot which aligns with the 50% Fibonacci retracement and could bounce from this level to the major resistance.
Pivot: 98.55
1st Support: 98
1st Resistance: 99.53
Disclaimer:
The above opinions given constitute general market commentary, and do not constitute the opinion or advice of IC Markets or any form of personal or investment advice.
Any opinions, news, research, analyses, prices, other information, or links to third-party sites contained on this website are provided on an "as-is" basis, are intended only to be informative, is not an advice nor a recommendation, nor research, or a record of our trading prices, or an offer of, or solicitation for a transaction in any financial instrument and thus should not be treated as such. The information provided does not involve any specific investment objectives, financial situation and needs of any specific person who may receive it. Please be aware, that past performance is not a reliable indicator of future performance and/or results. Past Performance or Forward-looking scenarios based upon the reasonable beliefs of the third-party provider are not a guarantee of future performance. Actual results may differ materially from those anticipated in forward-looking or past performance statements. IC Markets makes no representation or warranty and assumes no liability as to the accuracy or completeness of the information provided, nor any loss arising from any investment based on a recommendation, forecast or any information supplied by any third-party.

Stop!Loss|Market View: EURUSD🙌 Stop!Loss team welcomes you❗️
In this post, we're going to talk about the near-term outlook for the EURUSD currency pair☝️
Potential trade setup:
🔔Entry level: 1.15381
💰TP: 1.14051
⛔️SL: 1.16279
"Market View" - a brief analysis of trading instruments, covering the most important aspects of the FOREX market.
👇 In the comments 👇 you can type the trading instrument you'd like to analyze, and we'll talk about it in our next posts.
💬 Description: A breakout of the support area of 1.15000 - 1.16000 remains the main and more reliable sell scenario. More aggressive sell scenarios suggest entering near the current price, that is, from the local maximum of 1.16600. It is anticipated that the price will rapidly approach the 1.14000 area if the support area indicated is broken, as buyers liquidate their positions that have accumulated in large quantities below this level.
Thanks for your support 🚀
Profits for all ✅
❗️ Updates on this idea can be found below 👇

Gold Sitting on the Edge – Liquidity Sweep Before the Bounce?Monday didn’t give much movement, and price is now hovering around last week’s low.
I’m expecting a liquidity sweep of the current levels — likely taking out the Daily Low before moving to fill the full Weekly FVG below.
Short-term bias is bearish for the Asian session, but I’ll be watching closely for a shift once that FVG is filled.
If absorption shows up after the sweep, I’ll flip long for the bigger move higher into midweek.
#FuturesTrading #Gold #ICT #LiquiditySweep #NOFOMO

EUR/USD – Triangle Breakout (CPI Data ahead)EUR/USD – Buy Entry (M30- Channel Breakout Pattern)
The EUR/USD Pair, Price has been trading within a Triangle Breakout Pattern on the M30 chart, forming consistent higher highs and higher lows. Price action is now testing the upper boundary of the Pattern, signalling a possible breakout.
✅Market Context:
1️⃣Strong Upward Structure Inside the Pattern.
2️⃣Buyers are showing strength near Resistance.
3️⃣Breakout above the Trendline indicates Momentum continuation toward higher zones.
✅Trade Plan:
Entry: Buy after Confirmed Breakout above the Resistance (m30 candle close above trendline or retest of the breakout).
💰Take Profit (TP): At the Key Zone – a Major Resistance area identified ahead.
🛑Stop Loss (SL): Below the Pattern Structure.
✅Psychological Discipline :
1️⃣Stick to plan – No Revenge Trades.
2️⃣Accept losing trades as Part of the Strategy.
3️⃣Risk only 1–2% of your account balance per trade.
💬 Support the community: If you found this useful, drop a 👍 like and share your thoughts in the comments!
⚠️ Disclaimer: This analysis is for educational purposes only and does not constitute financial advice. Forex trading involves high risk. Trade only with capital you can afford to lose and always do your own research.

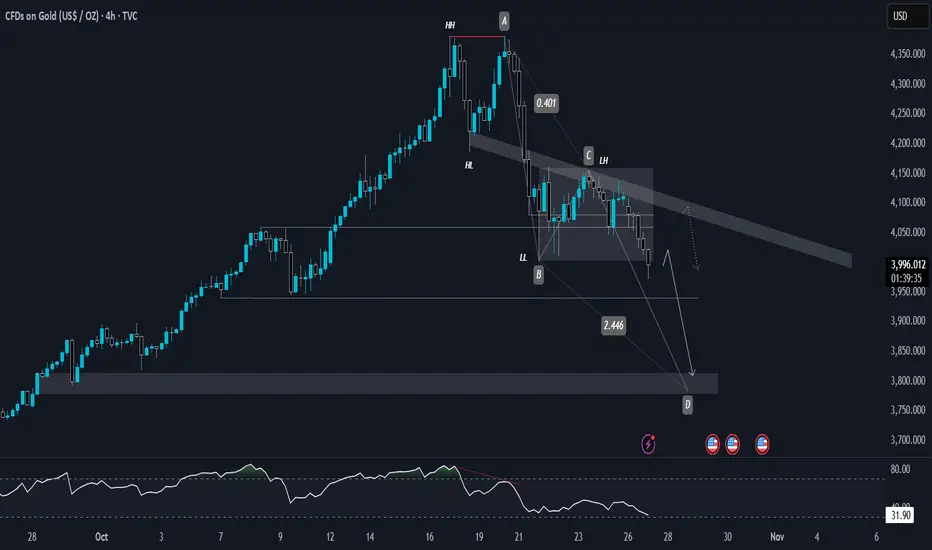
GOLD 4H | Harmonic AB=CD Bearish Reversal in PlayGold recently formed a clear double top at the all-time high (ATH), accompanied by a bearish divergence on higher timeframes — signaling exhaustion of bullish momentum. That divergence has played out perfectly, aligning with the current bearish market structure.
The price has now broken below the key accumulation range between 4000 and 4149, confirming a shift in sentiment. With the trend consistently printing lower lows (LL) and lower highs (LH), the overall market bias remains bearish.
🔹 Technical Breakdown
We currently have a bearish AB=CD pattern completing near the 3800 zone, which aligns with the Fibonacci golden ratio (0.618) on the D leg.
Although AB=CD is traditionally a bullish harmonic pattern, here it’s being used within a downtrend context to identify a potential reversal or continuation zone — depending on market reaction at D.
Key Zone to Watch:
🟡 3800 – 3840 → Major potential reaction zone (Fib confluence + AB=CD completion).
If sellers hold this level, we could see further downside momentum.
🔹 Daily Chart View
On the daily timeframe, bullish momentum looks weak — every recovery candle is smaller, and volume favors sellers. With the AB=CD pattern confirmation and price failing to reclaim the 40050 zone, the bias stays bearish.
🔹 Weekly Chart Insight
Historically, gold tends to retrace after 9 consecutive straight bullish weekly candles.
From 1990 to 2025, each 9-week rally phase has been followed by a notable correction ranging from 6% to 14%, showing that extended rallies often precede profit-taking phases.
This current rally phase mirrors that same behavior patterns — making a corrective move toward 3800–3700 highly probability.
🧭 Final BIAS
The technical confluence between the bearish structure, double top + divergence, and AB=CD D-leg near golden ratio and 9 week rally gives a high-probability bearish setup.
If 3940 fails to hold, next potential downside target lies near 3900-3775, aligned with long-term structure support.
BTCUSD — Coiled Energy vs Dollar | Volume Flow Meets Patience🧭 Context
Bitcoin started the week on the front foot, pressing toward the Flat TPO Top at 116 077.
Meanwhile, the U.S. Dollar Index (DXY) notched its fourth consecutive inside week, boxed between 97.56 and 99.19 — a quiet coil ahead of the Fed.
Crypto stretches while fiat meditates — a calm standoff where market psychology meets structure geometry.
📐 Technical Map
BTCUSD trades inside a bearish weekly range, yet buyers defend every dip.
Volume confirms accumulation from imbalance lows.
Key zones: 112.845 low → 116 077 high — measured-move corridor + prior TPO distribution shelf. A wick through 116 077 completes this week’s 10 % rotation
🌐 Fundamental Pulse
DXY strength = tightening risk appetite.
Fed decision mid-week sets November’s flow regime.
Until then, Bitcoin trades inversely: Dollar up → Crypto breathes out.
📊 Volume & Order Flow Map
Professional suite: Bookmap
Tracking bid/ask delta pressure around 112 845 and 116 077.
Liquidity depth shows absorption below range highs.
Volume clusters reveal short-covering rotations — not new conviction (yet).
Institutional footprint signals patience, not chase.
🎯 Plan
Full bias shift only if BTC closes above 116 077 with confirmed volume expansion.
If not, we reassess lower — control risk, collect flow, and stay structured.
“The Market Therapist”
Every trader thinks the market is emotional.
It’s not. You are.
The market doesn’t care about your caffeine, your new monitor, or your conviction.
It only respects structure, flow, and timing — and it punishes anyone who confuses belief with evidence.
So if Bitcoin grinds higher while the Dollar sleeps in a coil — breathe.
Nothing’s changed yet.
Pros wait. Amateurs anticipate. Only one gets paid.

XAUUSD - Gold awaits a decisive week?!Gold is trading below the EMA200 and EMA50 on the hourly timeframe and is trading in its range. A break below or above this range will lead to a continuation of the trend in the same direction. A correction towards the demand range will provide us with a better risk-reward buying opportunity. And a rise will provide us with the next short position!
After experiencing one of the worst trading sessions for gold in recent years and failing to achieve its tenth consecutive week of gains, many traders, analysts, and retail investors are now wondering where the gold market is headed next.
Mark Leibovit, publisher of the VR Metals/Resource Letter, took a cautious stance, saying:
“At the moment, I prefer not to hold any position in the market. I’m simply observing and waiting to see how conditions unfold.”
With the U.S. federal government shutdown still ongoing, the release of economic data next week is expected to be limited. As a result, market attention will once again shift toward central banks, particularly the Federal Reserve’s upcoming interest rate decision.
On Tuesday, the U.S. Consumer Confidence Index for October will be released. However, the main market movements are expected on Wednesday, when the Bank of Canada’s policy decision and the U.S. pending home sales data will be published — followed by the Federal Reserve’s policy announcement. Later, the Bank of Japan will provide an update on its monetary stance, and finally, the week will conclude with the European Central Bank’s (ECB) policy decision on Thursday, which could also influence the euro’s direction.
It is widely expected that the Federal Open Market Committee (FOMC) will cut its benchmark interest rate by 0.25 percentage points at the conclusion of its two-day meeting on Wednesday.
The Fed aims to lower borrowing costs and support the labor market through this move. Having kept rates elevated for an extended period to combat stubborn inflation, policymakers now view labor market stability as a higher priority, given that recent data show inflation remains persistent but under control.
According to the CME FedWatch Tool, which tracks rate expectations through federal funds futures, the FOMC is likely to reduce the federal funds rate to a range of 3.75%–4.00%, marking a second consecutive rate cut.
While many Fed officials have expressed readiness to ease rates, opinions still differ on the pace and extent of future reductions.
The outlook for upcoming policy actions remains uncertain, as the Fed continues to balance its dual mandate from Congress — containing inflation while maximizing employment.
A rate cut would bring the federal funds rate closer to a neutral level, where it neither stimulates nor restrains economic activity. Although the Fed kept rates high to fight inflation, the recent weakening in the labor market has become a more pressing concern.
Even though inflation remains above the Fed’s 2% annual target, officials are increasingly worried about the health of the labor market, as job creation has nearly stalled in recent months.
By lowering the federal funds rate, the Fed seeks to reduce short-term borrowing costs, encourage lending and investment, and bolster employment.
At the same time, trade tariffs are contributing both to rising prices and slower job growth. These import taxes have created uncertainty among business leaders, discouraging expansion plans and pushing higher costs onto consumers.
The Fed now faces the challenge of making interest rate decisions without access to many key economic reports it typically relies upon. In fact, the September Consumer Price Index (CPI) may be the last major economic data release the central bank receives for some time.
Other crucial government reports — including employment and GDP growth data — have been delayed or suspended due to the ongoing federal government shutdown, and may not be released at all for October.

NZDUSD Eyes 0.57350 as Fed Turns Dovish! Hey Traders,
In today’s trading session, we’re monitoring NZDUSD for a buying opportunity around the 0.57350 zone. The pair is trading in an uptrend and currently in a correction phase, approaching the 0.57350 support and resistance area, which aligns with the trend structure.
On the fundamental side, the U.S. labor market continues to show signs of cooling, with recent comments from Fed officials acknowledging that the slowdown “needs to be reflected in policy decisions.” This softer tone ahead of this week’s FOMC meeting could reinforce a dovish stance and weigh on the U.S. Dollar, potentially providing support for NZDUSD upside.
Trade safe,
Joe

Dollar In Range-And It May Not Be Broken Soon...Stocks are pushing nicely to the upside after some optimism that a deal could be reached between the US and China regarding tariffs, as reported this weekend by Trump himself. He’s clearly driving the market into a risk-on mode.
However, it’s interesting to see that the dollar is still going nowhere; the only FX market showing a more decisive move is the Aussie, which is naturally benefiting from this story.
Looking at the dollar index, no one knows where it wants to move but basic analysis in ranges is simple; "down from resistance, up from the support".
Keep in mind we’re still missing the latest US jobs data, so the outlook for further cuts remains uncertain, and that could keep the dollar moving sideways for now.
Have a nice trading week!
GH
Stop!Loss|Market View: NZDUSD🙌 Stop!Loss team welcomes you❗️
In this post, we're going to talk about the near-term outlook for the USDCAD currency pair☝️
Potential trade setup:
🔔Entry level: 0.57463
💰TP: 0.56839
⛔️SL: 0.57955
"Market View" - a brief analysis of trading instruments, covering the most important aspects of the FOREX market.
👇 In the comments 👇 you can type the trading instrument you'd like to analyze, and we'll talk about it in our next posts.
💬 Description: The New Zealand dollar continues to trade in a mid-term downtrend. Currently, this currency pair, as a commodity currency, is one of the most promising buying instruments for the USD, with further strengthening expected in the near future. Current prices are favorable for potential selling, but a false breakout near 0.57550 is possible, which would provide an even more reliable sell signal.
Thanks for your support 🚀
Profits for all ✅
❗️ Updates on this idea can be found below 👇

DXY WEEKLY FRGNT FORECAST - Q4 | W44 Y25 |📅 Q4 | W44 Y25 |
📊 DXY WEEKLY FRGNT FORECAST
🔍 Analysis Approach:
I’m applying Smart Money Concepts, focusing on:
Identifying Points of Interest on the Higher Time Frames (HTFs) 🕰️
Using those POIs to define a clear trading range 📐
Refining those zones on Lower Time Frames (LTFs) 🔎
Waiting for a Break of Structure (BoS) for confirmation ✅
This method allows me to stay precise, disciplined, and aligned with the market narrative, rather than chasing price.
💡 My Motto:
"Capital management, discipline, and consistency in your trading edge."
A positive risk-to-reward ratio, paired with a high win rate, is the backbone of any solid trading plan 📈🔐
⚠️ Losses?
They’re part of the mathematical game of trading 🎲
They don’t define you — they’re necessary, they happen, and we move forward 📊➡️
🙏 I appreciate you taking the time to review my Daily Forecast.
Stay sharp, stay consistent, and protect your capital
— FRNGT 🚀
TVC:DXY

Gold | Oil | Dollar | Silver | Natural Gas Price ForecastGold | Oil | Dollar | Silver | Natural Gas Price Forecast
AMEX:BOIL AMEX:KOLD NYMEX:CL1! COMEX:GC1!

U.S. Dollar Index | Countertrend Break Aligning Toward ExpansionThe Market Flow | October 26, 2025
Technical Overview
Monthly:
• The bearish countertrend from the 108.50 pivot remains active but is slowing after completing a 138.2% Fibonacci projection.
• Price structure is consolidating above the 95.99 breakout base, showing early signs of phase rotation.
• A monthly close above 100.80 would confirm a higher timeframe structural shift.
Weekly:
• The down impulse reached the 138.2% target near 95.99 and turned higher into corrective structure.
• The active weekly pivot at 98.54 defines current bias.
• The correction phase persists toward the 38.2% retracement at 101.43 , with 106.64 as weekly expansion resistance.
• Structure favors continuation within a developing countertrend recovery channel.
Daily:
• The daily trend remains bullish above 98.54 , with higher lows intact.
• Price currently trades within the 61.8% Fibonacci retracement zone (98.75–98.85) , overlapping with the H4 expansion base — a structural sweet spot of alignment between the daily and H4 expansion phases.
• A sustained move above the green countertrend line confirms continuation toward 99.97 → 100.81 → 101.43 .
• The active daily pivot at 98.12 defines primary invalidation for the short-term bullish structure.
H4:
• Consolidation within the 61.8% Fibonacci zone supports accumulation before potential expansion.
• A confirmed H4 close above 99.25 (EXP) initiates the expansion phase toward 99.97 → 100.81 → 101.43 → 101.94 .
• Failure to hold 98.12 (D Pivot) neutralizes the short-term phase alignment and reopens 97.70 .
Trade Structure & Levels
• Bias: Long above 97.70
• Trigger = H4 > 99.25 → clean H4 breakdown (EXP line)
• Primary Invalidation = 98.12 (D Pivot)
• Secondary Invalidation = 98.54 (W Pivot)
• Path → 99.97 → 100.81 → 101.43
• Phase: Countertrend Break → Expansion Setup (Daily–H4 Confluence Zone)
Risk & Event Context
• U.S. macro data (PCE inflation, Treasury auctions, and Fed commentary) may drive volatility near key resistance zones.
• Momentum confirmation above 99.25 aligns all active timeframes in expansion phase.
Conclusion
DXY sits within a confluence of daily and H4 61.8% target Fibonacci zone — a structural sweet spot supporting continuation of the expansion phase. A H4 break above 99.25 would validate alignment across both timeframes, targeting the 100–101.40 zone.

DXYDXY can have one more up and without breaking the top it can breakdown one more time.
Disclosure: We are part of Trade Nation's Influencer program and receive a monthly fee for using their TradingView charts in our analysis.
