GBP/USD – BoE Rate Decision Ahead |(06.11.2025)🧠 Setup Overview:
GBP/USD is trading inside a descending channel, with price recently rebounding from a strong support zone near 1.3000.
Ahead of the Bank of England (BoE) interest rate decision, the pair is positioned for a possible bullish breakout if the BoE maintains rates and highlights inflation risks.
📊 Trading Plan:
Bullish Scenario:
If the BoE holds rates and remains cautious on inflation → expect GBP/USD to rebound toward 1.3120 – 1.3180.
Breakout confirmation above channel resistance will strengthen the bullish view.
Bearish Scenario:
If the BoE signals dovish tone or hints at future rate cuts, GBP/USD could drop below 1.3000, targeting 1.2850 – 1.2710.
⚙️ Technical Levels:
🟢 1st Resistance: 1.3133
🟢 2nd Resistance: 1.3171
🔴 Support Zone: 1.3000 – 1.3020
Pattern: Falling Channel → Potential Breakout
🧩 Fundamental Insight (Today – 6 Nov 2025)
1.Markets price a 1-in-3 chance of a BoE rate cut to 3.75%, but consensus expects a hold at 4.00%.
2.UK inflation at 3.8% YoY remains above the BoE’s target, supporting a hawkish stance.
3.A surprise dovish tone, however, could hit the pound hard against the USD, especially as US data remains resilient and the dollar stays firm.
#GBPUSD #BoE #Forex #TechnicalAnalysis #PriceAction #ChartPatterns #KABHI_TA_TRADING #FundamentalAnalysis #BankOfEngland #InterestRates #FXMarket #TradingPlan #ForexSetup #ChartsDontLieTradersDontQuit #GBP #USD #TradingView
⚠️ Disclaimer:
This analysis is for educational purposes only and not financial advice. Always do your own analysis and manage risk carefully before trading news events.
💬 Support My Work ❤️
If you find this chart helpful — LIKE 👍, COMMENT 💭, and FOLLOW 🔔 to stay updated with more daily Forex setups and price action insights!
DXY

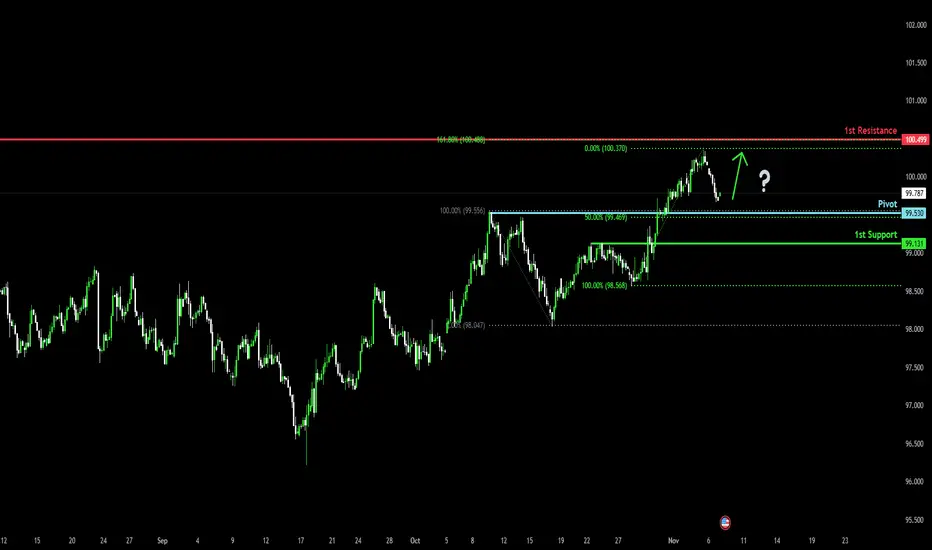
Bullish bounce off 50% Fibonacci support?The US Dollar Index (DXY) is falling towards the pivot, which has been identified as a pullback support that aligns with the 50% Fibonacci retracement and could bounce to the 1st resistance.
Pivot: 99.53
1st Support: 99.13
1st Resistance: 100.49
Disclaimer:
The above opinions given constitute general market commentary, and do not constitute the opinion or advice of IC Markets or any form of personal or investment advice.
Any opinions, news, research, analyses, prices, other information, or links to third-party sites contained on this website are provided on an "as-is" basis, are intended only to be informative, is not an advice nor a recommendation, nor research, or a record of our trading prices, or an offer of, or solicitation for a transaction in any financial instrument and thus should not be treated as such. The information provided does not involve any specific investment objectives, financial situation and needs of any specific person who may receive it. Please be aware, that past performance is not a reliable indicator of future performance and/or results. Past Performance or Forward-looking scenarios based upon the reasonable beliefs of the third-party provider are not a guarantee of future performance. Actual results may differ materially from those anticipated in forward-looking or past performance statements. IC Markets makes no representation or warranty and assumes no liability as to the accuracy or completeness of the information provided, nor any loss arising from any investment based on a recommendation, forecast or any information supplied by any third-party.
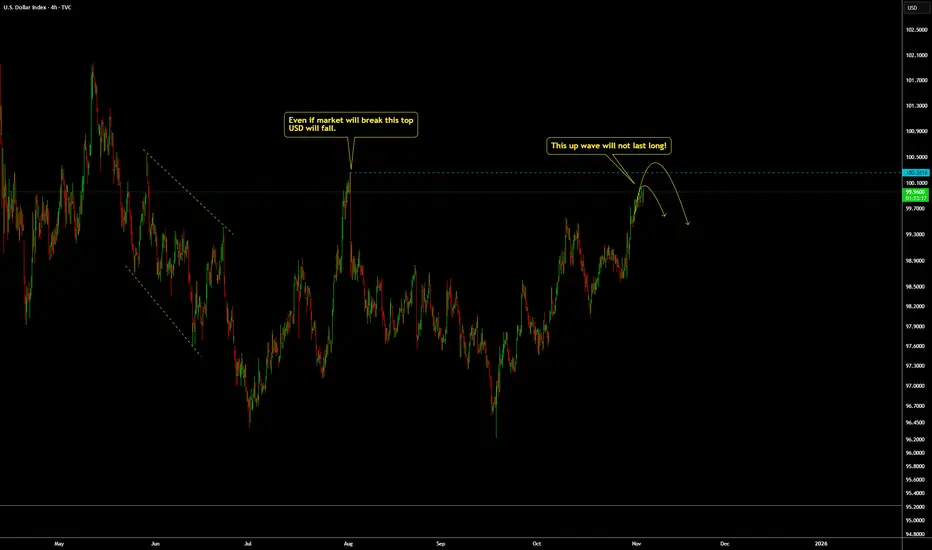
DXY(Dollar Index): This up wave will not last long.For TVC:DXY , don't be trapped with this up wave, it should not last long. What is happening now is only manipulation based on what we see.
Fed will continue to cut rates if not this year, next year and they are printing money, ending the QT and also things are not okay. Based on that, on the fundamental part of things and We Trade Waves wave analysis concept. Any sell setup we get for DXY we will go for it BUT:
Always remember WTW 4 Golder Rules:
1) Do not jump in
2) Do not over risk/trade
3) Do not trade without Stop Loss
4) Never ever add to a losing position!
Trade with care
We Trade Waves
WTW Team
Disclosure: We are part of Trade Nation's Influencer program and receive a monthly fee for using their TradingView charts in our analysis.
DOLLAR INDEX (DXY): Too Overbought Now
Looks like Dollar Index finally starts correction.
A test of a significant hisotric daily resistance triggered
a bearish movement and an intraday change of character
on a 4H time frame.
I think that the market may drop lower.
Goal - 99.8
❤️Please, support my work with like, thank you!❤️

DXY Near 100 as Rate-Cut Odds Fade and Uptrend Remains IntactHey Traders,
In today’s trading session we are monitoring the US Dollar Index (DXY) for a buying opportunity around the 100.000 zone. The Index is trading in a broader uptrend and currently is in a correction phase, approaching the trend support/resistance area near 100.000.
Structure:
The prevailing trend remains bullish, though price is consolidating and retesting the support/resistance level at 100.000. A solid rebound here could signal a resumption of the upward trajectory.
Fundamentals:
Recent commentary from the Federal Reserve indicates that a rate cut in December is increasingly unlikely. This hawkish tilt supports the Dollar and reinforces the up-trend scenario.
Next move:
Watching how price behaves around 100.000 — if the level holds, the bias remains bullish; a break below would call structural risk into question.
Trade safe,
Joe.

URUSD Faces Pressure Near 1.15100 as DXY Holds Strong Above 100!Hey Traders,
In today’s trading session we are monitoring EURUSD for a selling opportunity around the 1.15100 zone. The pair is trading within a broader downtrend and is currently in a correction phase, approaching the trend resistance at 1.15100.
Structure:
EURUSD continues to form lower highs and lower lows, suggesting that sellers remain in control. The 1.15100 zone stands as a key resistance where bearish momentum could resume.
Fundamentals:
This setup aligns with the recent DXY analysis, where the Dollar Index is holding firm around 100.000 after hawkish Fed remarks downplayed the likelihood of a December rate cut. A resilient Dollar backdrop strengthens the bearish case for EURUSD as policy divergence continues to favor the greenback.
Next move:
We’ll be watching price action at 1.15100 for potential rejection and continuation lower.
Trade safe,
Joe.

DXY — London Session🧭 Market Context
Dollar capped down overnight from 99.762 to 99.704 but still trades above the key bullish structure point at 99.525. The structure remains bullish overall, yet price keeps failing to break through 99.875 — the current cap. London session has filled yesterday’s balance range, leaving us in neutral territory.
We’re sitting on zero deviation — meaning equal chance to push higher or rotate lower.
Before taking any position, we need confirmation.
📈 Technical Frame DSM + VFA
Structure stays constructive but momentum is fading.
Volume shows thinning participation near 99.875 — professionals aren’t chasing.
If we see clear volume conviction through that level, we likely drive higher and fill the capped zone. If price slips below 99.525, expect a liquidity sweep into the lower volume pocket near 99.40. Right now, this is observation mode — not engagement mode.
🌍 Fundamental Frame (Macro Logic)
Overnight softness came from mild risk-on sentiment — Asia equities up, yields down.
Still, the Fed’s tone stays restrictive, and dollar demand remains under the surface.
This move looks more like positioning ahead of NFP than any real shift in trend.
🏛️ Coach’s Lens
When the market sits in balance, patience becomes the edge.
Professionals wait for clarity; amateurs act on hope.
Bias follows structure — not emotion.
🎯 Operator Rule
Confirmation defines conviction.
— CORE5DAN
Institutional Logic. Modern Technology. Real Freedom.

DXY Daily Outlook — Bullish Order Flow Toward Equal HighsHello traders 👋
On the DXY daily chart, we can clearly see that price showed a strong bullish reaction after grabbing liquidity below 96.37, initiating a bullish order flow that, in my view, is still in progress.
The equal highs above the current price act as a potential draw on liquidity and serve as my first bullish target.
However, keep an eye on the trendline liquidity forming below the current price — there’s a possibility that price may sweep this liquidity before continuing higher.
Overall, my bias remains bullish for now.
💌It is my honor to share your comments with me💌
🔎 DYOR
💡Wait for the update!

EURGBP - GBPUSD - AUDUSD - EURUSD - DXY FULL MARKET BREAKDOWN 📅 Q4 | W45 | D6| Y25 |
📊 EURGBP - GBPUSD - AUDUSD - EURUSD - DXY FULL MARKET BREAKDOWN FRGNT Daily Forecast
🔍 Analysis Approach:
I’m applying Smart Money Concepts, focusing on:
Identifying Points of Interest on the Higher Time Frames (HTFs) 🕰️
Using those POIs to define a clear trading range 📐
Refining those zones on Lower Time Frames (LTFs) 🔎
Waiting for a Break of Structure (BoS) for confirmation ✅
This method allows me to stay precise, disciplined, and aligned with the market narrative, rather than chasing price.
💡 My Motto:
"Capital management, discipline, and consistency in your trading edge."
A positive risk-to-reward ratio, paired with a high win rate, is the backbone of any solid trading plan 📈🔐
⚠️ Losses?
They’re part of the mathematical game of trading 🎲
They don’t define you — they’re necessary, they happen, and we move forward 📊➡️
🙏 I appreciate you taking the time to review my Daily Forecast.
Stay sharp, stay consistent, and protect your capital
— FRNGT 🚀

DXY Bullish Continuation Risks Challenge the 100.20-ResistanceOn the daily chart, the DXY’s rebound from its 17-year support near 96 resembles an inverted head-and-shoulders breakout, currently testing the 100.20 resistance.
A confirmed close above this level would complete the pattern, targeting the 101.80 and 103.40 levels — moves that could potentially pressure GBPUSD toward 1.2940 and 1.2740, as detailed in the following charts.
From the downside, if the DXY retreats below 99.40, the selling pressure on major currencies may ease. In that scenario, the DXY is expected to retest the neckline and validate the inverted head-and-shoulders formation, with the trendline connecting consecutive lower highs from May to August, between 98.50 and 98.00.
- Razan Hilal, CMT

Stop!Loss|Market View: NZDUSD🙌 Stop!Loss team welcomes you❗️
In this post, we're going to talk about the near-term outlook for the NZDUSD currency pair☝️
Potential trade setup:
🔔Entry level: 0.56811
💰TP: 0.56127
⛔️SL: 0.57165
"Market View" - a brief analysis of trading instruments, covering the most important aspects of the FOREX market.
👇 In the comments 👇 you can type the trading instrument you'd like to analyze, and we'll talk about it in our next posts.
💬 Description: Like the Australian dollar, the New Zealand dollar is looked for one of the most interesting short options amid the strengthening of the US currency. Here, the most likely conservative short position is near 0.56840, and it's best to consider entering through a false breakout, which will increase the entry's strength. The downside target is 0.56110, while in the medium term, 0.55000 can be considered.
Thanks for your support 🚀
Profits for all ✅
❗️ Updates on this idea can be found below 👇

Stop!Loss|Market View: AUDUSD🙌 Stop!Loss team welcomes you❗️
In this post, we're going to talk about the near-term outlook for the AUDUSD currency pair☝️
Potential trade setup:
🔔Entry level: 0.64398
💰TP: 0.63482
⛔️SL: 0.64782
"Market View" - a brief analysis of trading instruments, covering the most important aspects of the FOREX market.
👇 In the comments 👇 you can type the trading instrument you'd like to analyze, and we'll talk about it in our next posts.
💬 Description: The likelihood of a strengthening USD in the medium term remains, meaning major pairs will likely remain under pressure from the American currency until the end of the year. One of the best alternatives for the strength of the US dollar seems to be the AUDUSD. Currently, the most promising sell scenario appears to be a breakout of support near 0.64480, with downside targets at 0.64000 and 0.63500.
Thanks for your support 🚀
Profits for all ✅
❗️ Updates on this idea can be found below 👇

DXY FRGNT Daily Forecast -Q4 | W45 | D6| Y25 |📅 Q4 | W45 | D6| Y25 |
📊 DXY FRGNT Daily Forecast
🔍 Analysis Approach:
I’m applying Smart Money Concepts, focusing on:
Identifying Points of Interest on the Higher Time Frames (HTFs) 🕰️
Using those POIs to define a clear trading range 📐
Refining those zones on Lower Time Frames (LTFs) 🔎
Waiting for a Break of Structure (BoS) for confirmation ✅
This method allows me to stay precise, disciplined, and aligned with the market narrative, rather than chasing price.
💡 My Motto:
"Capital management, discipline, and consistency in your trading edge."
A positive risk-to-reward ratio, paired with a high win rate, is the backbone of any solid trading plan 📈🔐
⚠️ Losses?
They’re part of the mathematical game of trading 🎲
They don’t define you — they’re necessary, they happen, and we move forward 📊➡️
🙏 I appreciate you taking the time to review my Daily Forecast.
Stay sharp, stay consistent, and protect your capital
— FRNGT 🚀
TVC:DXY

Bullish continuation setup?The US Dollar Index (DXY) is falling towards the pivot which is a pullback support that aligns with the 38.2% Fibonacci retracement and could bounce to the 1st resistance.
Pivot: 99.53
1st Support: 98.55
1st Resistance: 101.46
Disclaimer:
The above opinions given constitute general market commentary, and do not constitute the opinion or advice of IC Markets or any form of personal or investment advice.
Any opinions, news, research, analyses, prices, other information, or links to third-party sites contained on this website are provided on an "as-is" basis, are intended only to be informative, is not an advice nor a recommendation, nor research, or a record of our trading prices, or an offer of, or solicitation for a transaction in any financial instrument and thus should not be treated as such. The information provided does not involve any specific investment objectives, financial situation and needs of any specific person who may receive it. Please be aware, that past performance is not a reliable indicator of future performance and/or results. Past Performance or Forward-looking scenarios based upon the reasonable beliefs of the third-party provider are not a guarantee of future performance. Actual results may differ materially from those anticipated in forward-looking or past performance statements. IC Markets makes no representation or warranty and assumes no liability as to the accuracy or completeness of the information provided, nor any loss arising from any investment based on a recommendation, forecast or any information supplied by any third-party.

EURGBP - GBPUSD - AUDUSD - EURUSD - DXY FULL MARKET BREAKDOWN 📅 Q4 | W45 | D5| Y25 |
📊 EURGBP - GBPUSD - AUDUSD - EURUSD - DXY FULL MARKET BREAKDOWN FRGNT Daily Forecast
🔍 Analysis Approach:
I’m applying Smart Money Concepts, focusing on:
Identifying Points of Interest on the Higher Time Frames (HTFs) 🕰️
Using those POIs to define a clear trading range 📐
Refining those zones on Lower Time Frames (LTFs) 🔎
Waiting for a Break of Structure (BoS) for confirmation ✅
This method allows me to stay precise, disciplined, and aligned with the market narrative, rather than chasing price.
💡 My Motto:
"Capital management, discipline, and consistency in your trading edge."
A positive risk-to-reward ratio, paired with a high win rate, is the backbone of any solid trading plan 📈🔐
⚠️ Losses?
They’re part of the mathematical game of trading 🎲
They don’t define you — they’re necessary, they happen, and we move forward 📊➡️
🙏 I appreciate you taking the time to review my Daily Forecast.
Stay sharp, stay consistent, and protect your capital
— FRNGT 🚀

XAU/USD | Gold’s Sharp Breakdown – Bears Still in Control!By analyzing the Gold (XAUUSD) chart on the 2-hour timeframe, we can see that after several days of consolidation, price finally broke down sharply, hitting all our targets at $3,999, $3,985, and $3,947, and extending to $3,928 — delivering over 700 pips in profit.
After reaching the marked demand zone, gold bounced slightly and is now trading around $3,940. However, unless we see strong bullish momentum soon, a deeper decline remains likely. The next potential downside targets are $3,930, $3,915, and $3,905.
Further targets and updates will be shared in the next analysis.
Please support me with your likes and comments to motivate me to share more analysis with you and share your opinion about the possible trend of this chart with me !
Best Regards , Arman Shaban

DXY-USD Game PlanDXY-USD Game Plan
📊 Market Sentiment
On 29/10, the FED lowered rates by 25BPS as expected. However, Powell’s remarks introduced uncertainty regarding December’s potential cut, stating that decisions will depend on upcoming data.
One FED member dissented, preferring no cut, a shift from September’s unanimous decision.
As a result, rate cut expectations dropped from 95% to 68%, sparking short-term bullish sentiment for the USD, as traders adjusted portfolios toward defensive positioning.
📈 Technical Analysis
The Dollar Index (DXY) hit its HTF Weekly Bullish Trendline and got rejected, forming a structural reversal pattern.
We’ve now seen a break of short-term daily bearish trend, confirming strength and a potential leg higher toward 102.00 (Monthly FFVG).
📌 Game Plan / Expectations
Expecting price to wick or close above 100.25, then potentially retrace before resuming the bullish leg.
Primary upside target: Monthly FFVG zone at 102.00.
Sentiment remains bullish for the dollar short term, which may pressure risk assets (stocks and crypto) temporarily.
💬 If this DXY breakdown supports your macro view, like, comment, and follow.
For deeper insights and liquidity-based macro models, subscribe to my Substack (free access available).
⚠️ Disclaimer
This analysis is for educational purposes only and does not constitute financial advice. Always conduct your own research before trading or investing.

DXY & final liquidityFundamental Analysis :
Based on the current macroeconomic backdrop, the U.S. Dollar Index (DXY) appears to be entering a short-term corrective move to the upside, potentially toward the 100–101 liquidity zone, before resuming its broader bearish trend.
This aligns with the visible Head & Shoulders structure and the small Quasimodo (QM) zone that’s likely to attract liquidity before a larger downside move.
Short-Term View (Correction Toward 101):
Recent U.S. employment and retail sales data have shown relative strength, leading markets to delay expectations for Fed rate cuts.
U.S. 10-year Treasury yields have seen a mild recovery, prompting short-term dollar demand as investors rebalance risk exposure.
The Federal Reserve’s “data-dependent” stance keeps the market uncertain ahead of the next inflation releases, providing a temporary bid for the dollar.
➤ This corrective phase corresponds to the small QM zone (100–101) where liquidity collection and retesting of previous resistance are likely.
Medium- to Long-Term View (Bearish Reversal After 101):
Core inflation (PCE) continues to trend lower, approaching the Fed’s 2.5% target range.
Labor market softness is becoming more visible through higher unemployment and slowing wage growth.
The probability of rate cuts beginning in early 2026 is increasing, which would significantly reduce the dollar’s yield advantage.
Meanwhile, other major economies (Europe, China, Japan) are stabilizing, which could rebalance global demand away from the USD.
Additionally, rising U.S. government debt and fiscal deficit concerns are weighing on real yields and long-term dollar sentiment.
➤ These factors suggest that once liquidity is collected near 101, DXY could begin a new bearish leg toward the 95–92.5 demand zone.
The current upward move in the dollar is likely a final liquidity grab before the next major decline.
From a fundamental perspective, this aligns with short-term resilience in economic data, followed by an eventual shift toward monetary easing and weaker growth momentum — perfectly in line with technical scenario.

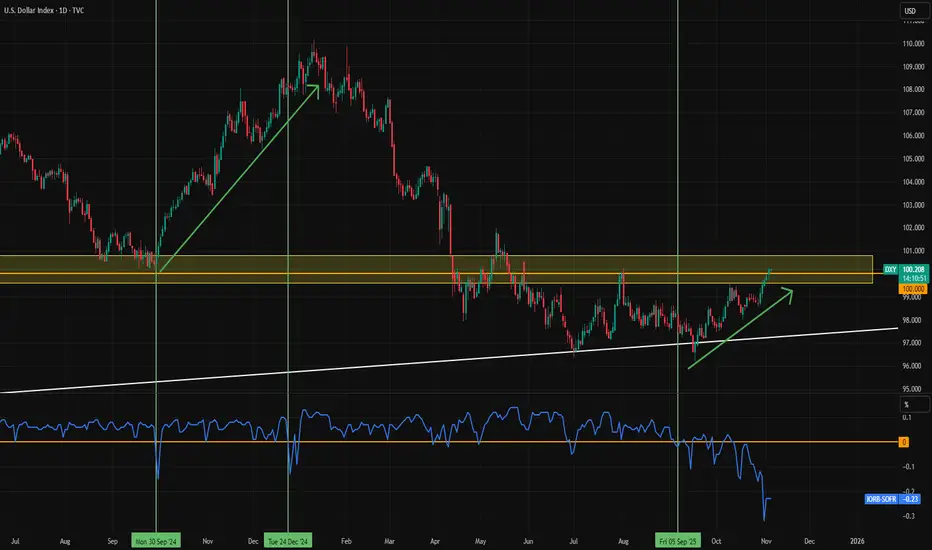
Dollar Rises Amid Record US Shutdown and Liquidity ShortageThe dollar index is climbing as the US faces its longest government shutdown on record. The FRED:SOFR rate is trading 0.23 percentage points above the FRED:IORB , signaling a liquidity shortage. Unfortunately, TradingView data doesn’t cover the 2019 liquidity crunch, but the current situation looks similar.
Earlier this week, Logan highlighted the elevated repo rate and noted that the Fed may need to step in and purchase assets if conditions persist. The liquidity shortage is putting upward pressure on the dollar index. A breakout above 101 could accelerate that pressure further.
If the US shutdown ends, renewed government spending could ease the liquidity strain, allowing the dollar to retreat. Until then, upward momentum is likely to continue.
EUR/CAD: Bullish Outlook📈EURCAD formed a significant inverted head and shoulders pattern on a 4-hour timeframe.
The neckline for this pattern is identified between 1.6226 and 1.6210.
Should the price successfully break and close above this neckline, it would indicate a strong bullish signal.
In such a scenario, the market could potentially advance towards the 1.6560 level.
Please note that the neckline currently acts as a robust demand area. Shorting opportunities should only be considered after a confirmed breakout of this level.

DXY FRGNT Daily Forecast -Q4 | W45 | D5| Y25 |📅 Q4 | W45 | D5| Y25 |
📊 DXY FRGNT Daily Forecast
🔍 Analysis Approach:
I’m applying Smart Money Concepts, focusing on:
Identifying Points of Interest on the Higher Time Frames (HTFs) 🕰️
Using those POIs to define a clear trading range 📐
Refining those zones on Lower Time Frames (LTFs) 🔎
Waiting for a Break of Structure (BoS) for confirmation ✅
This method allows me to stay precise, disciplined, and aligned with the market narrative, rather than chasing price.
💡 My Motto:
"Capital management, discipline, and consistency in your trading edge."
A positive risk-to-reward ratio, paired with a high win rate, is the backbone of any solid trading plan 📈🔐
⚠️ Losses?
They’re part of the mathematical game of trading 🎲
They don’t define you — they’re necessary, they happen, and we move forward 📊➡️
🙏 I appreciate you taking the time to review my Daily Forecast.
Stay sharp, stay consistent, and protect your capital
— FRNGT 🚀
TVC:DXY

DXY Institutional Pullback Setup – Smart Money Buying the Dip!💰 DXY: The Dollar Flexing Hard - Institutional Swing Play! 🎯
📊 Market Overview
The U.S. Dollar Index (DXY) is showing serious institutional strength! After a clean pullback to the 786 Triangular Moving Average, we're locked and loaded for a bullish continuation play. This setup screams "smart money accumulation" and we're positioning for the ride up! 💪
🎯 The Setup: Bullish Confirmation ✅
Asset: DXY (U.S. Dollar Index CFD)
Bias: 🟢 BULLISH - Confirmed on institutional timeframes
Strategy Type: Swing/Day Trade Hybrid
📈 Technical Confluence:
✅ 786 TMA Pullback - Textbook institutional support zone
✅ Price action holding above key structure
✅ Volume profile showing accumulation
✅ Smart money footprint evident
🎲 The "Layered Entry" Gameplan (Thief Style 😎)
Instead of going all-in at one price, we're using multiple limit orders (layering strategy) to build our position like the institutions do:
💵 Entry Zones (Layer Your Orders):
Layer 1: 98.400
Layer 2: 98.600
Layer 3: 98.800
Note: You can add more layers based on your risk appetite and account size! The beauty of layering? You average into the move without FOMO-ing at the worst price. 🧠
Current Price Entry: Yes, you can enter at market if you're confident in the setup, but layering gives you better risk management.
🛡️ Risk Management (Thief OG Edition)
🚨 Stop Loss: 98.100
This is MY stop loss based on my risk tolerance. IMPORTANT: I'm NOT telling you to blindly copy this. Set your SL based on YOUR account size, risk percentage, and comfort level. Trade your plan, not mine! 🎰
🎯 Profit Target: 100.000 (The Big Round Number!)
🧲 Why 100.000?
Simple Moving Average acting as strong resistance
Psychological round number = liquidity magnet 🧲
Overbought conditions likely near this zone
Trap potential for late longs - we want to exit before the crowd panics!
Exit Strategy: Take profits in stages! Don't be greedy. 💰 Consider taking 50% off at 99.500 and letting the rest ride to 100.000 with a trailing stop.
DISCLAIMER: This target is MY analysis. You decide when to take profits based on your strategy. If you see your account glowing green, TAKE THE MONEY! 💸
🔗 Related Pairs to Watch (Correlation Game 🕹️)
The DXY doesn't move in isolation! Here are the correlated plays:
📉 Inverse Correlations (These typically move OPPOSITE to DXY):
FX:EURUSD - Strong negative correlation (~-95%). DXY up = EUR/USD down
FX:GBPUSD - Cable follows Euro's lead, watch for breakdown
OANDA:AUDUSD & OANDA:NZDUSD - Commodity currencies get crushed when DXY rips
Gold ( OANDA:XAUUSD ) - Dollar strength = gold weakness (classic inverse)
📈 Positive Correlations (These move WITH DXY):
FX:USDJPY - Yen pairs amplify dollar moves
OANDA:USDCHF - Swissy follows dollar strength
OANDA:USDCAD - Loonie weakens on DXY strength (unless oil goes parabolic)
Pro Tip: If DXY is pumping but EUR/USD isn't dumping proportionally, something's off - be careful! 🚩
🧠 Key Points & Edge:
Institutional Level Confirmed - The 786 TMA is a proven reversal/continuation zone used by big money
Swing Trading Sweet Spot - This isn't a scalp; give it room to breathe
Layer Like a Pro - Don't blow your load on one entry; scale in strategically
Risk First, Profits Second - Protect your capital like it's your only child 👶
Watch Correlations - DXY strength impacts EVERYTHING in Forex
⚠️ Risk Disclosure & "Thief Style" Disclaimer
THIS IS THE "THIEF STYLE" TRADING STRATEGY - JUST FOR FUN AND EDUCATIONAL PURPOSES! 🎲
This analysis represents MY personal trading plan and bias. I am NOT a financial advisor, and this is NOT financial advice. Trading involves substantial risk of loss, and you could lose more than your initial investment.
✅ Do your own research (DYOR)
✅ Never risk more than you can afford to lose
✅ Past performance ≠ future results
✅ Markets can remain irrational longer than you can remain solvent
Trade at your own risk! I'm sharing my playbook, but YOU are responsible for your account. If you make money, congrats! 🎉 If you lose money, that's on you, not me. Manage your risk like a pro! 💪
🚀 Let's Catch This Move Together!
The setup is ripe, the levels are clear, and the plan is locked in. Now we wait for the market to come to us - patience pays in this game! ⏰
✨ If you find value in my analysis, a 👍 and 🚀 boost is much appreciated — it helps me share more setups with the community!
#DXY #USDollarIndex #ForexTrading #SwingTrading #InstitutionalTrading #TechnicalAnalysis #TradingStrategy #ForexSignals #PriceAction #SupportAndResistance #RiskManagement #EURUSD #ForexCorrelation #SmartMoney #TradingView #MarketAnalysis #DayTrading #ForexLife #ThiefStyle #LayeredEntry #DollarBull
Happy Trading, Thief OGs! 💎🙌

EURJPY SELL SETUP🎯 4. Entry Strategy
✅ Step 1 – Wait for Price to Enter Supply Zone
Be patient and wait until price reaches the red zone (176.600–176.700).
This ensures you’re not entering early during the retracement.
✅ Step 2 – Look for Confirmation (on Lower Timeframes)
Switch to a 5-minute or 1-minute chart inside the supply zone and look for:
Liquidity grab (a wick or small breakout above previous highs).
Change of Character (ChoCH) to the downside (break of minor structure).
Bearish engulfing candle or strong downward move confirming seller presence.
✅ Step 3 – Execute the Entry
Sell after confirmation of bearish structure shift (post-ChoCH).
Place Stop Loss just above the zone (above 176.700).
Place Take Profit at the next demand zone (175.400 area).
