DXY may sell off from or above 98.77With rate cut, as expected DXY as created new lower low. The gap resistance at 99.32 has been tested and price finally managed break the trend line with FOMC realse.
Daily price opened with gap, which in currently retesting the swing high and possible rejection at 98.77 or above after a false breakout can lead the market to go futher lower to 97.84 or below.
Dxyidea

DXYU.S Dollar Index
- Rising Wedge as an corrective pattern in Long Time Frame
- Order Block
- Fibonacci Level - 50.00% / 61.80%
- Demand Zone
- Completed " 1234 " Impulsive Waves

U.S. Dollar Index Gearing Up for a Powerful Upswing!💵 DXY — U.S. Dollar Index | Profit Pathway Setup (Swing Trade)
🧭 Bias: Bullish (Confirmed Setup)
📈 Market Type: Index (USD Strength Focus)
🧠 Strategy Style: Layered Limit Entry with SMA Pullback + Triangular MA Breakout
🎯 Trade Plan Breakdown
📊 Setup Insight:
The DXY (U.S. Dollar Index) has confirmed a bullish momentum as price reclaims above the Simple Moving Average (SMA) and breaks through the Triangular Moving Average (TMA) resistance zone — signaling potential continuation strength for the dollar.
📥 Entry Zone (Layering Strategy):
My “Thief Strategy” approach uses multiple limit layers for precision stacking entries:
Buy Limit Layers: 99.00 → 99.50 → 100.00
(You can extend or adjust layers based on your own conviction and risk appetite.)
🛑 Stop Loss:
My Thief SL sits near the recent lower low wick for structure protection → 98.50
💬 Note: Dear Ladies & Gentlemen (Thief OG’s) — I’m not recommending my exact SL.
You manage your own risk — make money, take money, your call.
🎯 Target (Take Profit):
The moving average line is acting like a police barricade — strong resistance area, potential overbought trap zone. Be smart and escape with profits near 102.00.
💬 Note: Dear Ladies & Gentlemen (Thief OG’s) — TP is flexible.
Lock profits where you’re satisfied; don’t let greed arrest your gains. 🚓💰
🌐 Correlated Market Watch
Keep an eye on these correlated pairs & assets for confirmation signals or divergence clues:
💶 $EUR/USD → Inverse correlation (DXY up → EUR/USD down)
$XAU/USD (Gold) → Often moves opposite to USD strength
💷 FX:GBPUSD → Mirrors EUR/USD volatility when DXY surges
BITSTAMP:BTCUSD → Weakens when DXY strengthens due to liquidity shifts
💹 FX:USDJPY → Supports bullish dollar narrative if yield spreads widen
These pairs can help you validate sentiment and timing entries better — especially during London & New York sessions when DXY liquidity peaks.
🧩 Technical Key Points
✅ SMA pullback confirms bullish continuation zone
🔺 Triangular Moving Average breakout shows renewed strength
🧱 99.00–100.00 acts as accumulation floor
🚨 102.00 remains resistance barricade zone (potential trap)
⏰ Best observed during London/NY overlap for volatility cues
✨ “If you find value in my analysis, a 👍 and 🚀 boost is much appreciated — it helps me share more setups with the community!”
⚠️ Disclaimer: This is a Thief-style trading strategy — just for fun and education. Not financial advice. Trade wisely and manage risk like a pro.
#DXY #USDollarIndex #ForexTrading #SwingTrade #TechnicalAnalysis #TradingIdeas #PriceAction #SMAStrategy #MovingAverages #CurrencyTrading #DollarStrength #ForexSignals #TradingStrategy #MarketAnalysis #ChartPatterns #BullishSetup #RiskManagement #ForexCommunity #TradingView #DXYAnalysis

DXY,EURUSD and GBPUSD Analysis todayHello traders, this is a complete multiple timeframe analysis of this pair. We see could find significant trading opportunities as per analysis upon price action confirmation we may take this trade. Smash the like button if you find value in this analysis and drop a comment if you have any questions or let me know which pair to cover in my next analysis.

What should we expect from DXY Index by the end of 2023❗️❓🗺️👋Hi everyone (Reading time less than 3 minutes⏰) .
📚One of the most important Indices that we should have an analysis of is the DXY index because it has a direct impact on the Forex , Cryptocurrency , and stock and etc markets. So, in this post, I'm going to show you the 🗺️ Roadmap 🗺️ for DXY until at least the End of 2023 and Early 2024 .
💡I used the Monthly time frame and Elliott wave theory to display the DXY index roadmap better.
💡First of all, it is better to know that the DXY index has formed an Ascending Channel since 2008 and is moving in it.
🌊According to the theory of Elliott waves , the DXY index has succeeded in completing its 5 impulsive waves in the ascending channel so that the 3rd wave was an extended wave .
🌊As a result, it seems that Corrective waves have started, and to confirm this, it is better to wait for the break of the lower line of the ascending channel.
🔔I expect the DXY to move between 🔴Heavy Resistance zone($107.62-$103.10)🔴 and 🟢Support zone($101.64-$99.58)🟢 by the end of 2023 and early 2024, and in mid-2024 , the DXY will begin to trend Down , and Financial markets will likely turn 🚀Green🚀 .
DXY Index Analyze ( DXYUSD ), Monthly time frame ⏰.
Do not forget to put Stop loss for your positions (For every position you want to open).
Please follow your strategy; this is just my Idea, and I will be glad to see your ideas in this post.
Please do not forget the ✅' like '✅ button 🙏😊 & Share it with your friends; thanks, and Trade safe.

DXY idea 12.11.2025For the dollar index, I think that if the price breaks through the golden pocket, the price could reach the level of 100-100.5, which would be an ideal opportunity for a short from a confluence perspective. There is a weekly level and a value high here, and there is also a fibo of 0.786. For a long, I would see potential around the price of 97.7, where the wvap daily level and fibo of 0.382 are located nearby, for a broader context.

DXY Institutional Pullback Setup – Smart Money Buying the Dip!💰 DXY: The Dollar Flexing Hard - Institutional Swing Play! 🎯
📊 Market Overview
The U.S. Dollar Index (DXY) is showing serious institutional strength! After a clean pullback to the 786 Triangular Moving Average, we're locked and loaded for a bullish continuation play. This setup screams "smart money accumulation" and we're positioning for the ride up! 💪
🎯 The Setup: Bullish Confirmation ✅
Asset: DXY (U.S. Dollar Index CFD)
Bias: 🟢 BULLISH - Confirmed on institutional timeframes
Strategy Type: Swing/Day Trade Hybrid
📈 Technical Confluence:
✅ 786 TMA Pullback - Textbook institutional support zone
✅ Price action holding above key structure
✅ Volume profile showing accumulation
✅ Smart money footprint evident
🎲 The "Layered Entry" Gameplan (Thief Style 😎)
Instead of going all-in at one price, we're using multiple limit orders (layering strategy) to build our position like the institutions do:
💵 Entry Zones (Layer Your Orders):
Layer 1: 98.400
Layer 2: 98.600
Layer 3: 98.800
Note: You can add more layers based on your risk appetite and account size! The beauty of layering? You average into the move without FOMO-ing at the worst price. 🧠
Current Price Entry: Yes, you can enter at market if you're confident in the setup, but layering gives you better risk management.
🛡️ Risk Management (Thief OG Edition)
🚨 Stop Loss: 98.100
This is MY stop loss based on my risk tolerance. IMPORTANT: I'm NOT telling you to blindly copy this. Set your SL based on YOUR account size, risk percentage, and comfort level. Trade your plan, not mine! 🎰
🎯 Profit Target: 100.000 (The Big Round Number!)
🧲 Why 100.000?
Simple Moving Average acting as strong resistance
Psychological round number = liquidity magnet 🧲
Overbought conditions likely near this zone
Trap potential for late longs - we want to exit before the crowd panics!
Exit Strategy: Take profits in stages! Don't be greedy. 💰 Consider taking 50% off at 99.500 and letting the rest ride to 100.000 with a trailing stop.
DISCLAIMER: This target is MY analysis. You decide when to take profits based on your strategy. If you see your account glowing green, TAKE THE MONEY! 💸
🔗 Related Pairs to Watch (Correlation Game 🕹️)
The DXY doesn't move in isolation! Here are the correlated plays:
📉 Inverse Correlations (These typically move OPPOSITE to DXY):
FX:EURUSD - Strong negative correlation (~-95%). DXY up = EUR/USD down
FX:GBPUSD - Cable follows Euro's lead, watch for breakdown
OANDA:AUDUSD & OANDA:NZDUSD - Commodity currencies get crushed when DXY rips
Gold ( OANDA:XAUUSD ) - Dollar strength = gold weakness (classic inverse)
📈 Positive Correlations (These move WITH DXY):
FX:USDJPY - Yen pairs amplify dollar moves
OANDA:USDCHF - Swissy follows dollar strength
OANDA:USDCAD - Loonie weakens on DXY strength (unless oil goes parabolic)
Pro Tip: If DXY is pumping but EUR/USD isn't dumping proportionally, something's off - be careful! 🚩
🧠 Key Points & Edge:
Institutional Level Confirmed - The 786 TMA is a proven reversal/continuation zone used by big money
Swing Trading Sweet Spot - This isn't a scalp; give it room to breathe
Layer Like a Pro - Don't blow your load on one entry; scale in strategically
Risk First, Profits Second - Protect your capital like it's your only child 👶
Watch Correlations - DXY strength impacts EVERYTHING in Forex
⚠️ Risk Disclosure & "Thief Style" Disclaimer
THIS IS THE "THIEF STYLE" TRADING STRATEGY - JUST FOR FUN AND EDUCATIONAL PURPOSES! 🎲
This analysis represents MY personal trading plan and bias. I am NOT a financial advisor, and this is NOT financial advice. Trading involves substantial risk of loss, and you could lose more than your initial investment.
✅ Do your own research (DYOR)
✅ Never risk more than you can afford to lose
✅ Past performance ≠ future results
✅ Markets can remain irrational longer than you can remain solvent
Trade at your own risk! I'm sharing my playbook, but YOU are responsible for your account. If you make money, congrats! 🎉 If you lose money, that's on you, not me. Manage your risk like a pro! 💪
🚀 Let's Catch This Move Together!
The setup is ripe, the levels are clear, and the plan is locked in. Now we wait for the market to come to us - patience pays in this game! ⏰
✨ If you find value in my analysis, a 👍 and 🚀 boost is much appreciated — it helps me share more setups with the community!
#DXY #USDollarIndex #ForexTrading #SwingTrading #InstitutionalTrading #TechnicalAnalysis #TradingStrategy #ForexSignals #PriceAction #SupportAndResistance #RiskManagement #EURUSD #ForexCorrelation #SmartMoney #TradingView #MarketAnalysis #DayTrading #ForexLife #ThiefStyle #LayeredEntry #DollarBull
Happy Trading, Thief OGs! 💎🙌

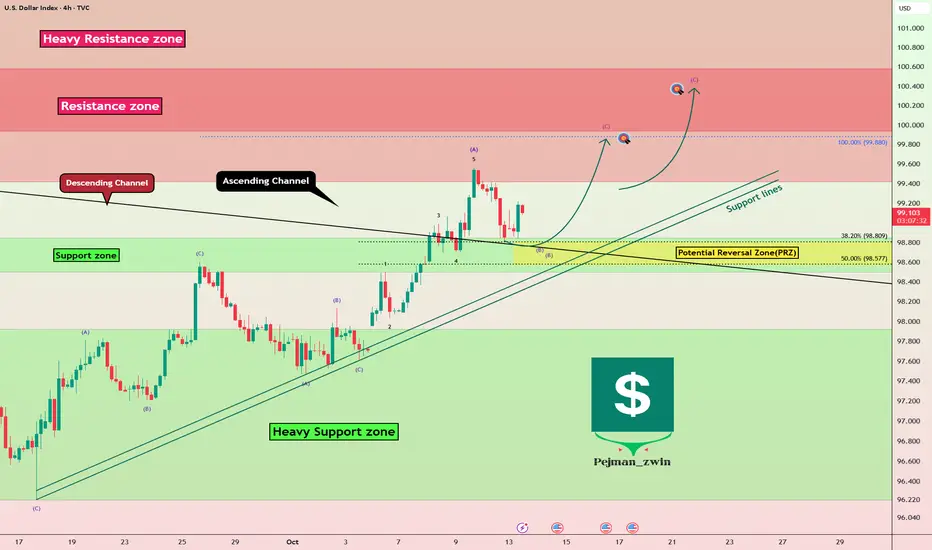
DXY index Near Resistance – Will Powell Trigger the Next Move?To kick off this week, let's take a quick look at the upcoming key indexes in the economic calendar before diving into the DXY analysis ( TVC:DXY ).
On Tuesday, we have Fed Chair Powell speaking, which could stir some excitement in the DXY index and ripple through correlated financial markets . Then, on Thursday , we have a bunch of key indexes like Core PPI, Core Retail Sales, PPI, and Unemployment Claims coming out. These releases could spark some volatility as well.
So, before we jump into the DXY analysis , I wanted to give you a heads-up on this week’s events
From a technical analysis standpoint , the DXY index is currently moving near a Heavy Resistance zone($101.30-$99.42) . At the same time, it has managed to break above the upper line of its descending channel and is now in a pullback phase to retest that broken line.
In terms of Elliott Wave theory , it seems that the DXY is completing wave B of a zigzag corrective(ABC/5-3-5) .
I expect that wave B will finish around the Potential Reversal Zone(PRZ) , and we might see the DXY index approach that Resistance zone($100.58-$99.93) before Powell’s speech tomorrow .
First Target: $99.770
Second Target: $100.06
Stop Loss(SL): $98.28
Please respect each other's ideas and express them politely if you agree or disagree.
U.S. Dollar Index Analysis (DXYUSD), 4-Hour Time Frame.
Be sure to follow the updated ideas.
Do not forget to put a Stop loss for your positions (For every position you want to open).
Please follow your strategy and updates; this is just my Idea, and I will gladly see your ideas in this post.
Please do not forget the ✅' like '✅ button 🙏😊 & Share it with your friends; thanks, and Trade safe.
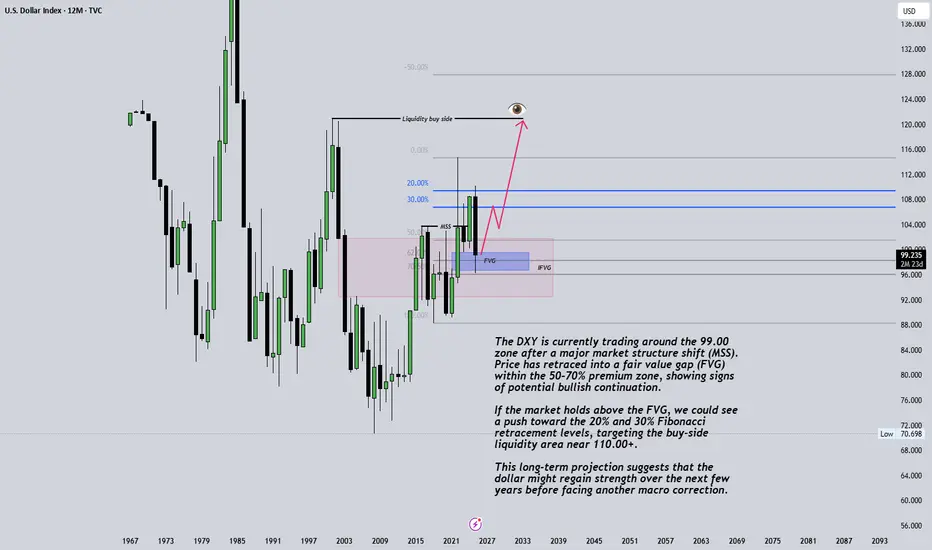
US Dollar Index (DXY) Monthly OutlookThe DXY is currently trading around the 99.00 zone after a major market structure shift (MSS). Price has retraced into a fair value gap (FVG) within the 50–70% premium zone, showing signs of potential bullish continuation.
If the market holds above the FVG, we could see a push toward the 20% and 30% Fibonacci retracement levels, targeting the buy-side liquidity area near 110.00+.
This long-term projection suggests that the dollar might regain strength over the next few years before facing another macro correction.
📅 Timeframe: Monthly
💡 Bias: Bullish towards liquidity highs
⚠️ Disclaimer: This analysis is for educational purposes only and does not constitute financial advice.
#DXY #USDX #DollarIndex #ForexAnalysis #SmartMoneyConcepts #MarketStructure #FVG #Liquidity #Herotraderfx #TradingView
DXY nfp again breaking the support?Hello traders, this is a complete multiple timeframe analysis of this pair. We see could find significant trading opportunities as per analysis upon price action confirmation we may take this trade. Smash the like button if you find value in this analysis and drop a comment if you have any questions or let me know which pair to cover in my next analysis.


DXY Dollar Heist: Can You Escape @100?🔥 DXY Dollar Index Bank Heist Plan (Swing Trade) 🔥
Asset: DXY Dollar Index 💵Plan: Bullish 📈Thief Trading Style: Layered Limit Order Strategy 🕵️♂️
🏦 The Heist Plan 🏦
Dear Thief OG's, Ladies & Gentlemen, get ready to pull off the ultimate DXY heist! 💰 We're using the Thief Layering Strategy to stack multiple limit orders and maximize our loot. Follow the plan, adjust to your risk, and let’s escape with the cash! 🚨
📈 Entry: The Break-In
Strategy: Deploy multiple buy limit orders to layer your entries like a master thief 🕴️. Suggested levels:
98.00 💸
98.20 💸
98.40 💸
98.60 💸
Flexibility: Add more layers based on your risk appetite or market conditions 📊.
Pro Tip: Set an alert on TradingView to catch the breakout or pullback at these levels 🚨.
🛑 Stop Loss: The Escape Route
Thief SL: Set at 97.50 to protect your stash 🛡️.
Risk Management: Adjust SL based on your lot size, risk tolerance, and number of layered entries ⚖️.
Warning: Don’t get caught! This is a high-stakes heist—stick to your risk plan 🔥.
🎯 Target: The Getaway
Police Barricade: Resistance at 100.30 🚓—watch out!
Our Target: Take profits at 100.00 to escape with the loot before the market traps you 🏃♂️💨.
🧠 Why This Heist?
The DXY is showing bullish momentum based on real-time market data 📡:
Macro Factors: Strong USD demand driven by economic indicators (check COT reports, geopolitics, and intermarket analysis) 🌍.
Technical Setup: Layered entries align with swing trade pullbacks and key support zones 📉.
Scalpers 👀: Stick to quick long-side trades with trailing SL to lock in profits 💰.
⚠️ Trading Alerts: Stay Sharp!
News Releases: Avoid new trades during high-impact news to dodge volatility traps 🚫.
Position Management: Use trailing stop-loss to secure your profits and stay safe 🛡️.
💪 Boost the Heist!
Hit the Boost Button to power up our Thief Trading Style! 🚀 Every like and view strengthens our crew, helping us rob the market with precision. Let’s make money and vanish like pros! 🤑
Stay tuned for the next heist plan, Thief OG’s! 🕵️♂️🎉

DXY ready to resume downtrend!97.94 Level on DXY is a high liquidity zone as in the falling market there is bounce off to 97.937. Price grabbed liquidity and started to drop again to the major direction of the trend. As it is a long term down trend and price just rejected from a high liquidity zone, it is a high probability price may continue to drop to this support level as multiple timeframe trend is bearish.

DXY Possible sell on pullback!Back to back 3 weekly pin bar on DXY with series of lower high's putting pressure on the weekly support level. From the Monthly, it is a long term bear market, after the previous monthly pullback, price started to continue to drop which signals potential new impulse on the monthly. As the monthly close, the price is on the intraday support with potential for initial bounce. As weekly market is creating series of higher low, there is a possibility of 50% pullback and liquidity grab to potentially break the weekly support.

DXY ready to drop ?DXY trade setup for today :
Before we look at potential entry in this pair first let’s look at multiple timeframe analysis in this market.
Monthly: 100.24 Monthly resistance price has got rejection strongly from the top
Weekly: Bearish engulfed formation with strong liquidity grab
Daily: A sharp rejection with liquidity grab from the resistance
Entry timeframe 4H : Upon retest of the order block, market has got rejected and potentially breaking out of the market structure to continue to drop to support level.
Possible trade recommendation : Bearish entry with SL above sessions high

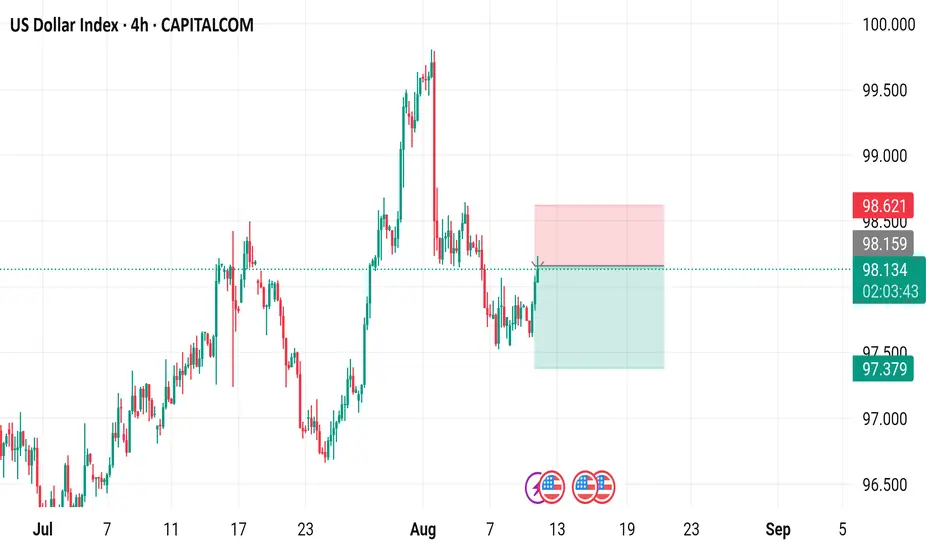
US Dollar Index (DXY) 4-Hour Chart4-hour chart of the US Dollar Index (DXY) from CAPITALCOM. The chart shows the price movement of the DXY from early July to early September. The current price is 98.131 with a 0.28% increase. The chart features a candlestick pattern with green (upward movement) and red (downward movement) bars. A sell signal is indicated at 98.132, and a buy signal is at 98.186. The chart also includes highlighted zones (red and green rectangles) indicating potential trading ranges or areas of interest between approximately 98.621 and 97.379.
DXY Analysis todayHello traders, this is a complete multiple timeframe analysis of this pair. We see could find significant trading opportunities as per analysis upon price action confirmation we may take this trade. Smash the like button if you find value in this analysis and drop a comment if you have any questions or let me know which pair to cover in my next analysis.

Dollar Index - Expecting Bullish Continuation In The Short TermH4 - Strong bullish momentum followed by a pullback.
No opposite signs.
Until the two Fibonacci support zones hold I expect the price to move higher further.
If you enjoy this idea, don’t forget to LIKE 👍, FOLLOW ✅, SHARE 🙌, and COMMENT ✍! Drop your thoughts and charts below to keep the discussion going. Your support helps keep this content free and reach more people! 🚀
--------------------------------------------------------------------------------------------------------------------

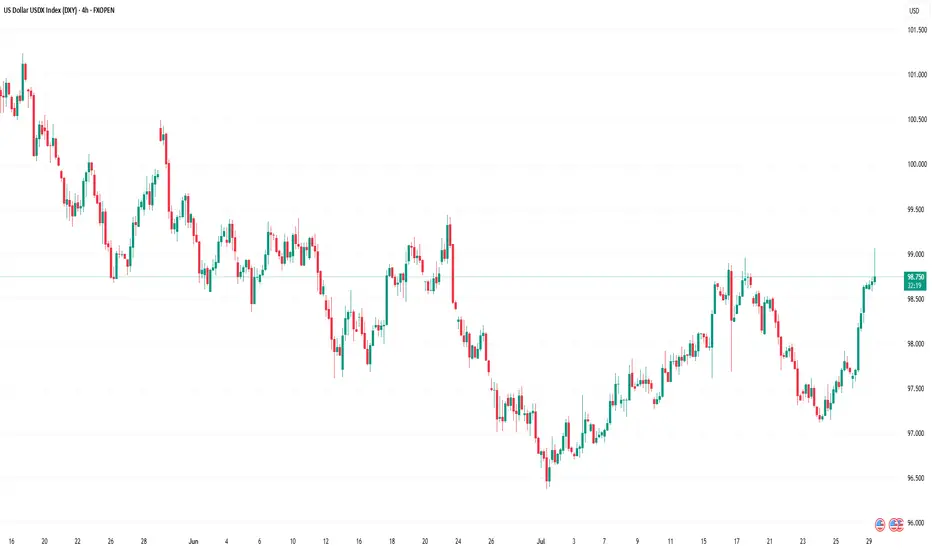
US Dollar Index (DXY) Reaches One-Month HighUS Dollar Index (DXY) Reaches One-Month High
The US Dollar Index (DXY) has risen to its highest level since early July. According to media reports, the bullish sentiment in the market is driven by the following factors:
→ Optimism around US trade agreements. A new trade deal with the EU — which includes a 15% tariff on European goods — is being perceived by the market as favourable for the United States.
→ Confidence in the resilience of the US economy. Strong Q2 corporate earnings have acted as an additional bullish catalyst. Investors may have started covering short positions against the dollar, viewing concerns over a US slowdown as overstated.
→ Expectations that the Federal Reserve will keep interest rates on hold.
From a technical standpoint, today’s DXY chart reflects strengthening bullish momentum.
Technical Analysis of the DXY Chart
Two U-shaped formations (A and B) that developed over the summer have created a bullish сup and рandle pattern — a formation that suggests waning bearish pressure, as evidenced by the shallower second dip.
This setup points to the potential for a bullish breakout above the trendline (marked in red) that has defined the downward movement in the DXY throughout the first half of 2025.
As previously analysed, there are signs that the dollar index may have found a base following a period of decline. This could indicate a shift in market sentiment and the possible end of the recent bearish phase.
This article represents the opinion of the Companies operating under the FXOpen brand only. It is not to be construed as an offer, solicitation, or recommendation with respect to products and services provided by the Companies operating under the FXOpen brand, nor is it to be considered financial advice.
US Dollar Index - 4h Chart (CAPITALCOM)4-hour chart of the US Dollar Index (DXY) from CAPITALCOM shows the index's recent price movements. The current value is 96.955, with a slight increase of 0.054 (+0.06%). Key levels include a support at 96.413 and resistance at 97.554. The chart highlights buy signals at 97.012 and sell signals at 96.958 and 96.955, with a notable downward trend breaking below a support zone around 97.150.

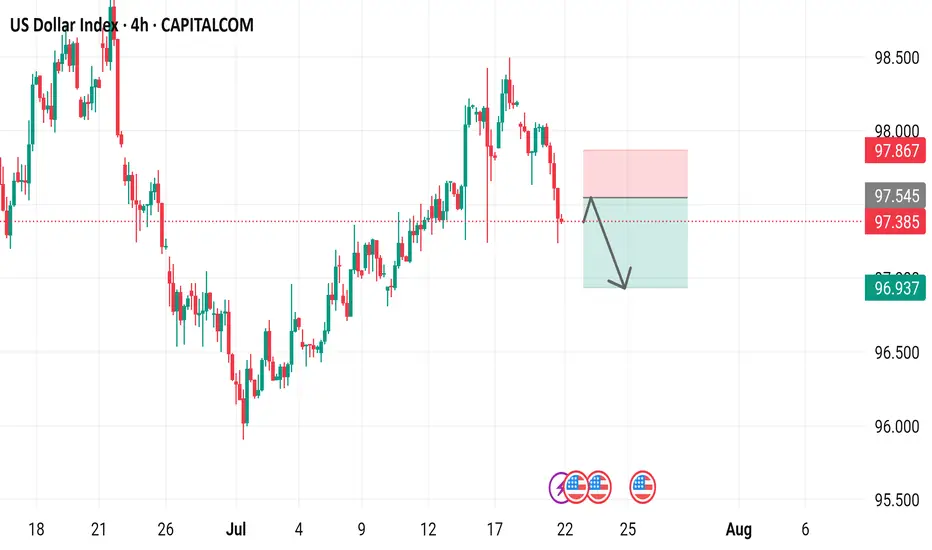
US Dollar Index 4-hour time frame, showcasing the US Dollar Index's performance over this period.
- The index is currently at 97.385, with a decrease of 0.636 (-0.65%) from its previous value.
- A red box indicates a "SELL" signal at 97.385, while a blue box suggests a "BUY" signal at 97.439.
- The chart includes various technical indicators, such as moving averages and relative strength index (RSI), to help traders analyze market trends.
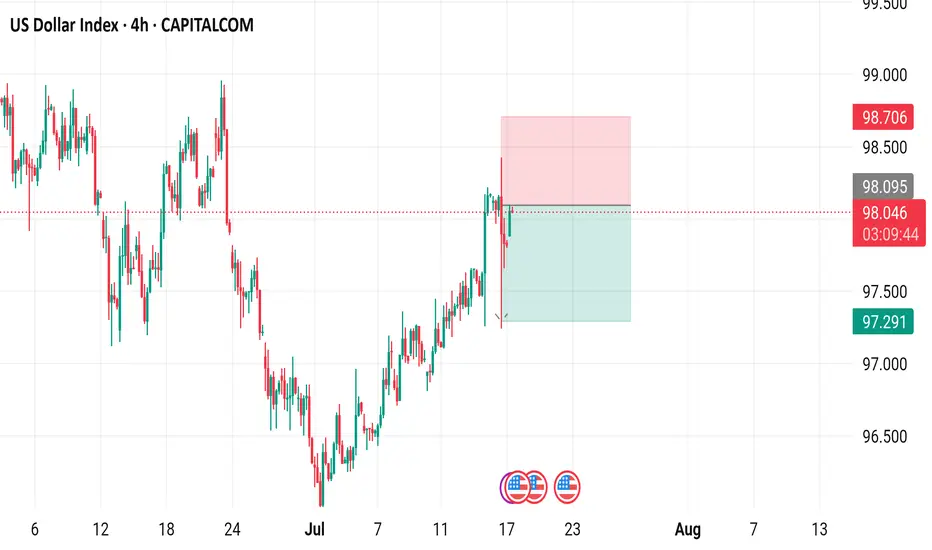
US Dollar Index (DXY) - 4 Hour Chart4-hour performance of the US Dollar Index (DXY) from CAPITALCOM, showing a current value of 98.040 with a 0.23% increase (+0.222). The chart includes recent buy and sell signals at 98.094 and 98.040, respectively, with a highlighted resistance zone around 98.706-99.000 and a support zone around 97.291-98.040. The timeframe covers data from early July to mid-August 2025.
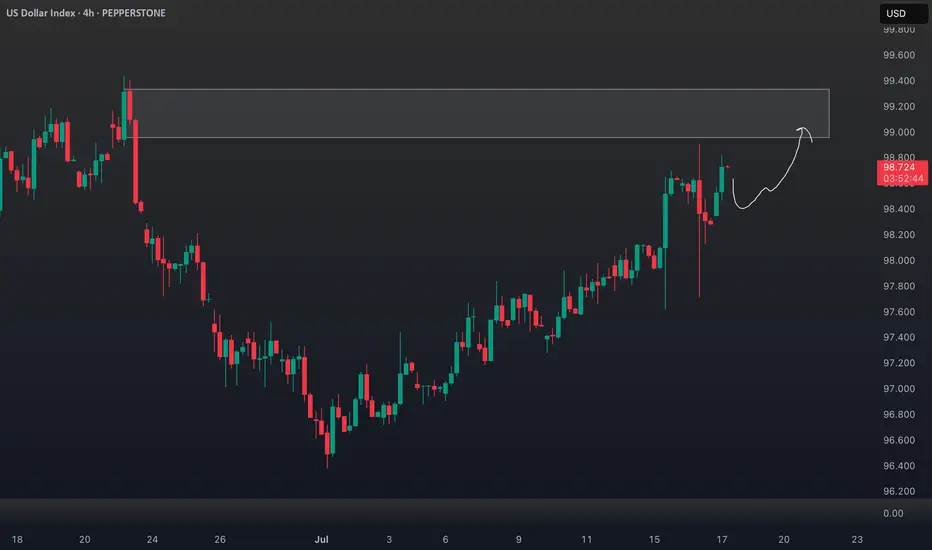
DXY Outlook: Bullish Move Fueled by Fundamentals & GeopoliticsTechnical Analysis (4H Chart & Broader Context) 📈🕓
The DXY 4H chart shows a clear bullish trend 🚀, with higher highs and higher lows since early July. DXY has caught a strong bid, breaking above short-term resistance near 98.40 and now eyeing the previous swing high 🎯. This matches the consensus among analysts: DXY remains in a bullish structure, with momentum supported by both technicals and macro factors.
Key resistance: Next upside target is the previous high (around 99.60 on the chart), with further resistance at the psychological 100 level 🏁.
Support: Immediate support at 98.20, then 97.60 🛡️.
Momentum: Strong bullish candles and no major bearish reversal signals on the 4H. Some analysts note positioning is stretched, so a short-term pullback or consolidation is possible before more upside (IG).
Fundamental Analysis 💹🌍
Why is DXY rallying?
Fed Policy & US Data: The US economy is resilient 💪, with robust services data, strong retail sales, and a recent uptick in core inflation. The Fed is less dovish, with markets now expecting a slower pace of rate cuts 🏦.
Interest Rate Differentials: The US keeps a yield advantage as the Fed is less aggressive in cutting rates compared to the ECB and BoJ, especially with Europe and Japan facing weaker growth and possible further easing 🌐.
Geopolitical Factors: Ongoing trade tensions (Trump’s tariff threats) and global uncertainty (including Middle East risks) are driving safe-haven flows into the dollar 🛡️🌏. DXY typically strengthens during periods of geopolitical stress.
Positioning: CFTC data shows USD long positioning at multi-month highs, which could mean the market is crowded and vulnerable to short-term corrections ⚠️ (IG).
Trade Idea (Bullish Bias, Targeting Previous High) 💡💵
Setup:
Bias: Bullish, in line with the prevailing trend and macro backdrop 🟢.
Entry: Consider buying on a minor pullback to the 98.20–98.40 support zone, or on a confirmed breakout above the recent high 🛒.
Target: Previous swing high near 99.60, with a stretch target at 100.00 🎯.
Stop: Below 97.60 (recent swing low/support) ⛔.
Risk Factors:
Overbought positioning could trigger a short-term pullback ⚠️.
Any dovish surprise from the Fed or rapid de-escalation in global tensions could cap further gains 🕊️.
In summary: The DXY’s bullish trend is underpinned by resilient US data, a hawkish Fed, and global risk aversion. Your bullish bias is well-supported, with the previous high as a logical target. Watch for short-term pullbacks, but the broader trend remains up unless key support is lost. 🚦