DOGEUSDT.P - November 6, 2025A breakout and close above resistance could confirm bullish momentum toward higher levels, while a rejection or drop below the ascending trendline and support may indicate a bearish reversal—trade based on how price reacts at these critical zones.
E-signal

BNBUSDT.P - November 6, 2025A breakout and sustained close above resistance could confirm bullish continuation toward higher highs, while a rejection or breakdown below the ascending trendline and support may trigger a bearish move—trade according to how price reacts at these key levels.

ETHUSDT.P - November 6, 2025ETHUSDT.P is attempting a short-term bullish reversal following a rebound from the $3,274.06–$3,244.47 support zone. A buy limit is positioned near $3,339.11, targeting a move toward the $3,493.78 partial profit zone and the $3,548.75 profit level.
A sustained break above $3,493.78 would confirm bullish continuation, while a drop below $3,274.06 invalidates the setup.
Risk Assessment: Moderate — price structure favors buyers, but confirmation above resistance is required before momentum can strengthen.

GOLD A Fall Expected! SELL!
My dear subscribers,
GOLD looks like it will make a good move, and here are the details:
The market is trading on 3995.7 pivot level.
Bias - Bearish
My Stop Loss - 4003.2
Technical Indicators: Both Super Trend & Pivot HL indicate a highly probable Bearish continuation.
Target - 3983.4
About Used Indicators:
The average true range (ATR) plays an important role in 'Supertrend' as the indicator uses ATR to calculate its value. The ATR indicator signals the degree of price volatility.
Disclosure: I am part of Trade Nation's Influencer program and receive a monthly fee for using their TradingView charts in my analysis.
———————————
WISH YOU ALL LUCK

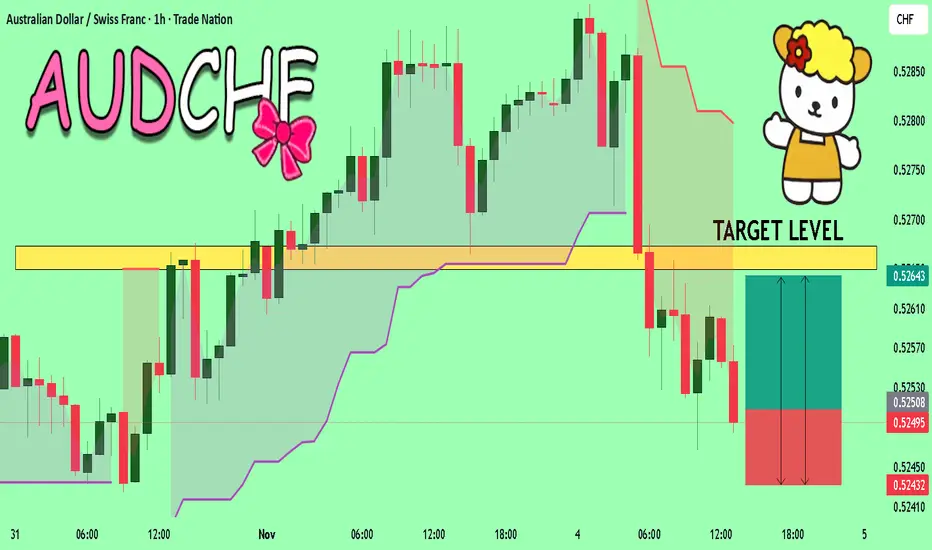
AUDCHF What Next? BUY!
My dear friends,
My technical analysis for AUDCHF is below:
The market is trading on 0.5250 pivot level.
Bias - Bullish
Technical Indicators: Both Super Trend & Pivot HL indicate a highly probable Bullish continuation.
Target - 0.5264
Recommended Stop Loss - 0.5243
About Used Indicators:
A pivot point is a technical analysis indicator, or calculations, used to determine the overall trend of the market over different time frames.
Disclosure: I am part of Trade Nation's Influencer program and receive a monthly fee for using their TradingView charts in my analysis.
———————————
WISH YOU ALL LUCK
EURJPY Trading Opportunity! BUY!
My dear friends,
Please, find my technical outlook for EURJPY below:
The instrument tests an important psychological level 176.29
Bias - Bullish
Technical Indicators: Supper Trend gives a precise Bullish signal, while Pivot Point HL predicts price changes and potential reversals in the market.
Target - 177.26
About Used Indicators:
Super-trend indicator is more useful in trending markets where there are clear uptrends and downtrends in price.
Disclosure: I am part of Trade Nation's Influencer program and receive a monthly fee for using their TradingView charts in my analysis.
———————————
WISH YOU ALL LUCK

GOLD: Short Signal with Entry/SL/TP
GOLD
- Classic bearish formation
- Our team expects pullback
SUGGESTED TRADE:
Swing Trade
Short GOLD
Entry - 3982.0
Sl - 3995.9
Tp - 3959.8
Our Risk - 1%
Start protection of your profits from lower levels
Disclosure: I am part of Trade Nation's Influencer program and receive a monthly fee for using their TradingView charts in my analysis.
❤️ Please, support our work with like & comment! ❤️

AUDUSD Trading Opportunity! BUY!
My dear followers,
This is my opinion on the AUDUSD next move:
The asset is approaching an important pivot point 0.6496
Bias - Bullish
Technical Indicators: Supper Trend generates a clear long signal while Pivot Point HL is currently determining the overall Bullish trend of the market.
Goal - 0.6533
About Used Indicators:
For more efficient signals, super-trend is used in combination with other indicators like Pivot Points.
Disclosure: I am part of Trade Nation's Influencer program and receive a monthly fee for using their TradingView charts in my analysis.
———————————
WISH YOU ALL LUCK

USDJPY Under Pressure! SELL!
My dear friends,
Please, find my technical outlook for USDJPY below:
The price is coiling around a solid key level - 154.18
Bias - Bearish
Technical Indicators: Pivot Points High anticipates a potential price reversal.
Super trend shows a clear sell, giving a perfect indicators' convergence.
Goal - 153.86
Safe Stop Loss - 154.35
About Used Indicators:
The pivot point itself is simply the average of the high, low and closing prices from the previous trading day.
Disclosure: I am part of Trade Nation's Influencer program and receive a monthly fee for using their TradingView charts in my analysis.
———————————
WISH YOU ALL LUCK

ETHUSDT.P - November 4, 2025ETHUSDT.P is maintaining a clear bearish structure, with price accelerating lower toward the $3,400.00–$3,381.34 zone. The setup indicates a potential continuation of the downtrend toward this target area, unless invalidated by a recovery above the $3,681.23 resistance level. A decisive breakdown below $3,381.34 would open further downside extension, while a rebound from this zone could signal short-term relief before further weakness.
Risk Assessment: Moderate risk — momentum remains bearish, but proximity to a key support zone may trigger temporary corrective bounces before continuation.

XRPUSDT.P - November 4, 2025XRPUSDT.P is maintaining a mixed-to-bearish market structure on the 15-minute timeframe, with price currently trading around the $2.3069 region after a corrective bounce. The pair continues to respect a sequence of lower highs and lower lows, suggesting that bearish momentum remains intact.
A potential short-term rally toward the $2.3347 resistance zone could occur before sellers reassert control. A rejection from this level may trigger a downside continuation toward the $2.1995 support target, aligning with the broader bearish projection shown.
However, a sustained breakout above the $2.3347 resistance and the invalidation level near $2.37 would negate this bearish scenario and signal a possible short-term bullish reversal.

DOGEUSDT.P - November 4, 2025DOGEUSDT.P is maintaining a mixed-to-bearish market structure, with price currently consolidating near the $0.1665 region after forming a sequence of lower highs and lower lows. The projected structure suggests a potential push higher toward the $0.1709–$0.1737 resistance zone before a possible reversal lower. A rejection from this zone could accelerate a move back toward the $0.1594 support area, aligning with the broader bearish bias. However, a sustained breakout above $0.1737 would invalidate this outlook and signal a shift toward short-term bullish momentum.

TRUMPUSDT.P - November 4, 2025TRUMPUSDT.P is attempting a bullish reversal after establishing a potential higher low near the $7.02–$6.95 support zone. Price is consolidating around the $7.27 buy limit area, indicating early accumulation before a possible push higher toward the $7.73–$7.83 target zone. The structure suggests a corrective pullback within a broader attempt to regain bullish momentum, with confirmation requiring a breakout and sustained move above $7.49.
Risk Assessment: Moderate risk — bullish momentum is developing from a potential base, but price remains within a short-term consolidation phase. Maintaining support above $7.02 is crucial to sustain upward momentum and confirm the reversal structure.

ETHUSDT.P - November 4, 2025ETHUSDT.P is currently attempting a short-term bullish reversal within a broader corrective structure. After forming a local low near the $3,460.00–$3,446.72 support zone, price has rebounded and is now targeting a potential buy setup around the $3,538.13 level. This suggests buyers are seeking confirmation for continuation toward the $3,625.51 partial profit area and ultimately the $3,647.77 profit target.
A break and sustained move above $3,625.51 would reinforce the bullish momentum, while failure to hold above the $3,538.13 entry zone could expose ETH to renewed downside pressure, revisiting the stop level.
Risk Assessment: Moderate risk — price is showing early signs of recovery, but confirmation is needed above near-term resistance. The trade setup offers a favorable risk-to-reward ratio if the $3,460.00 support holds, though volatility may persist before directional clarity emerges.

EURCHF: Bullish Continuation & Long Trade
EURCHF
- Classic bullish pattern
- Our team expects retracement
SUGGESTED TRADE:
Swing Trade
Buy EURCHF
Entry - 0.9292
Stop - 0.9285
Take - 0.9306
Our Risk - 1%
Start protection of your profits from lower levels
Disclosure: I am part of Trade Nation's Influencer program and receive a monthly fee for using their TradingView charts in my analysis.
❤️ Please, support our work with like & comment! ❤️

ASTERUSDT.P - November 4, 2025ASTERUSDT.P is approaching a key support zone between 0.8434–0.8191. A short-term bounce is likely from this area, with potential upside toward 0.9277 if bullish momentum confirms reversal structure near support.

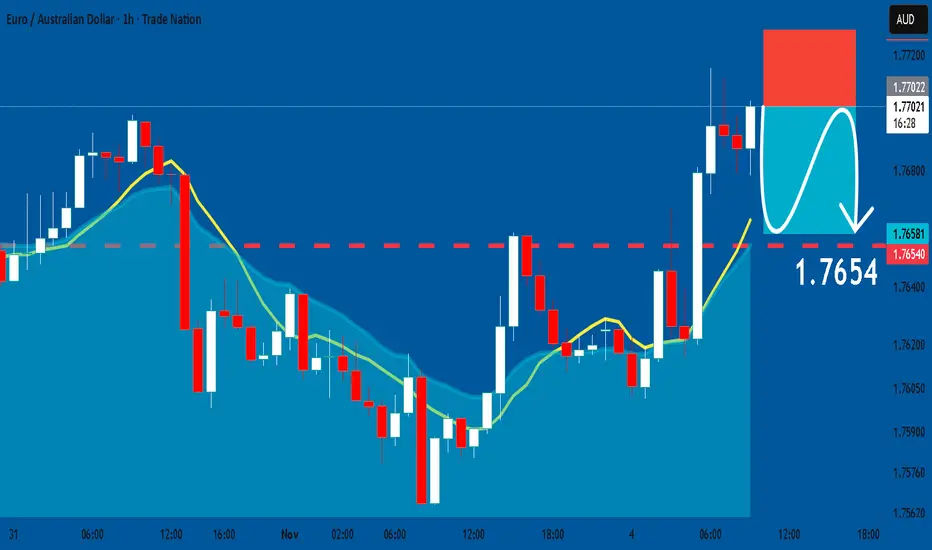
EURAUD: Short Signal Explained
EURAUD
- Classic bearish formation
- Our team expects fall
SUGGESTED TRADE:
Swing Trade
Sell EURAUD
Entry Level - 1.7701
Sl - 1.7728
Tp - 1.7654
Our Risk - 1%
Start protection of your profits from lower levels
Disclosure: I am part of Trade Nation's Influencer program and receive a monthly fee for using their TradingView charts in my analysis.
❤️ Please, support our work with like & comment! ❤️
USDCAD Technical Analysis! SELL!
My dear subscribers,
My technical analysis for USDCAD is below:
The price is coiling around a solid key level - 1.4067
Bias - Bearish
Technical Indicators: Pivot Points Low anticipates a potential price reversal.
Super trend shows a clear sell, giving a perfect indicators' convergence.
Goal - 1.4013
About Used Indicators:
By the very nature of the supertrend indicator, it offers firm support and resistance levels for traders to enter and exit trades. Additionally, it also provides signals for setting stop losses
Disclosure: I am part of Trade Nation's Influencer program and receive a monthly fee for using their TradingView charts in my analysis.
———————————
WISH YOU ALL LUCK

BTCUSD: A bullish channel might be formedHello Traders!
Considering the next few days, we might see a buy opportunity for the king of the Cryptos!
General long-term is bullish,
Mid-term is bearish,
we are around a zone,
a week bearish trend seen breakable.
We would trade the possible channel after reaching the activation line.
If SL hit before the activation line, we'll cancel the trade .

DASHUSDT.P - November 4, 2025DASHUSDT.P is exhibiting a strong corrective rebound within a prolonged downtrend, with price approaching the $207.29–$407.47 zone marked for short entries. The setup anticipates a potential rejection from this resistance area, targeting $48.40 for partial profit and $21.22 as the final objective. The stop loss is positioned above $603.93, defining the invalidation level. A sustained move below $48.40 would confirm renewed bearish momentum, while a breakout above $603.93 would negate the short setup.
Risk Assessment: High risk — the trade relies on rejection from major resistance after an aggressive upside move, but the wide stop zone provides flexibility against volatility.

GBPAUD: Short Trade with Entry/SL/TP
GBPAUD
- Classic bearish formation
- Our team expects pullback
SUGGESTED TRADE:
Swing Trade
Short GBPAUD
Entry - 2.0084
Sl - 2.0096
Tp - 2.0060
Our Risk - 1%
Start protection of your profits from lower levels
Disclosure: I am part of Trade Nation's Influencer program and receive a monthly fee for using their TradingView charts in my analysis.
❤️ Please, support our work with like & comment! ❤️

AUDUSD My Opinion! BUY!
My dear followers,
I analysed this chart on AUDUSD and concluded the following:
The market is trading on 0.6526 pivot level.
Bias - Bullish
Technical Indicators: Both Super Trend & Pivot HL indicate a highly probable Bullish continuation.
Target - 0.6565
About Used Indicators:
A super-trend indicator is plotted on either above or below the closing price to signal a buy or sell. The indicator changes color, based on whether or not you should be buying. If the super-trend indicator moves below the closing price, the indicator turns green, and it signals an entry point or points to buy.
Disclosure: I am part of Trade Nation's Influencer program and receive a monthly fee for using their TradingView charts in my analysis.
———————————
WISH YOU ALL LUCK

AUDJPY Set To Grow! BUY!
My dear followers,
This is my opinion on the AUDJPY next move:
The asset is approaching an important pivot point 100.66
Bias - Bullish
Safe Stop Loss - 100.57
Technical Indicators: Supper Trend generates a clear long signal while Pivot Point HL is currently determining the overall Bullish trend of the market.
Goal - 100.83
About Used Indicators:
For more efficient signals, super-trend is used in combination with other indicators like Pivot Points.
Disclosure: I am part of Trade Nation's Influencer program and receive a monthly fee for using their TradingView charts in my analysis.
———————————
WISH YOU ALL LUCK
