NZDCAD Expected Growth! BUY!
My dear followers,
This is my opinion on the NZDCAD next move:
The asset is approaching an important pivot point 0.8016
Bias - Bullish
Technical Indicators: Supper Trend generates a clear long signal while Pivot Point HL is currently determining the overall Bullish trend of the market.
Goal - 0.8041
About Used Indicators:
For more efficient signals, super-trend is used in combination with other indicators like Pivot Points.
Disclosure: I am part of Trade Nation's Influencer program and receive a monthly fee for using their TradingView charts in my analysis.
———————————
WISH YOU ALL LUCK
E-signal

EURJPY On The Rise! BUY!
My dear friends,
Please, find my technical outlook for EURJPY below:
The price is coiling around a solid key level - 177.61
Bias - Bullish
Technical Indicators: Pivot Points Low anticipates a potential price reversal.
Super trend shows a clear buy, giving a perfect indicators' convergence.
Goal - 178.11
Safe Stop Loss - 177.34
About Used Indicators:
The pivot point itself is simply the average of the high, low and closing prices from the previous trading day.
Disclosure: I am part of Trade Nation's Influencer program and receive a monthly fee for using their TradingView charts in my analysis.
———————————
WISH YOU ALL LUCK

EURAUD: Bullish Continuation & Long Trade
EURAUD
- Classic bullish formation
- Our team expects pullback
SUGGESTED TRADE:
Swing Trade
Long EURAUD
Entry - 1.7607
Sl - 1.7589
Tp - 1.7642
Our Risk - 1%
Start protection of your profits from lower levels
Disclosure: I am part of Trade Nation's Influencer program and receive a monthly fee for using their TradingView charts in my analysis.
❤️ Please, support our work with like & comment! ❤️

NZDUSD Trading Opportunity! BUY!
My dear friends,
Please, find my technical outlook for NZDUSD below:
The instrument tests an important psychological level 0.5719
Bias - Bullish
Technical Indicators: Supper Trend gives a precise Bullish signal, while Pivot Point HL predicts price changes and potential reversals in the market.
Target - 0.5746
About Used Indicators:
Super-trend indicator is more useful in trending markets where there are clear uptrends and downtrends in price.
Disclosure: I am part of Trade Nation's Influencer program and receive a monthly fee for using their TradingView charts in my analysis.
———————————
WISH YOU ALL LUCK

GOLD The Target Is DOWN! SELL!
My dear friends,
My technical analysis for GOLD is below:
The market is trading on 4022.7 pivot level.
Bias - Bearish
Technical Indicators: Both Super Trend & Pivot HL indicate a highly probable Bearish continuation.
Target - 4010.3
Recommended Stop Loss - 4030.0
About Used Indicators:
A pivot point is a technical analysis indicator, or calculations, used to determine the overall trend of the market over different time frames.
Disclosure: I am part of Trade Nation's Influencer program and receive a monthly fee for using their TradingView charts in my analysis.
———————————
WISH YOU ALL LUCK

ASTERUSDT.P - October 31, 2025ASTERUSDT.P is forming a potential higher low structure above the $0.91 support zone after rebounding from recent lows, suggesting a developing short-term bullish reversal. The planned long setup targets $1.0136, aligning with a continuation toward previous supply, with invalidation below $0.8890 maintaining a defined risk framework. Overall, this is a medium-risk setup given the early-stage recovery and the need for confirmation of sustained momentum above minor resistance.

BTCUSDT.P - October 31, 2025BTCUSDT.P on the 15-minute chart shows a short-term bullish reversal after forming higher lows following a prior downtrend. Price has broken above minor resistance and is now retesting it as potential support, indicating possible continuation toward the 111.3K zone. Momentum and structure favor the upside, but given intraday volatility and proximity to the recent swing low, it’s a medium-risk setup.
Note: If price reaches 111,313.6 or the immediate resistance before retracing to the buy limit area, consider the trade invalid.

ETH - Ping-Pong Between The Rails!📦Ethereum keeps respecting a neat descending channel on 4H📦: repeated rejections from the upper rail (red arrows) and clean bounces from the lower rail (blue arrows). After the latest tap of the lower boundary, ETH is attempting a rebound within the range.
🏹 As long as the lower rail holds, I’ll look for continuation toward the mid-channel first, then the upper boundary. If momentum accelerates, the structure high near 4,265 becomes the key level to reclaim for a larger push.
⚔️A 4H close back below 3,642 would weaken the setup and open the door for a deeper retest toward 3,300, where the broader defense sits.
In short: trend-following longs from the lower rail, manage partials into the mid-range, and keep eyes on the upper rail for the next decision point.
⚠️ Disclaimer: This is not financial advice. Always do your own research and manage risk properly.
📚All Strategies Are Good; If Managed Properly!
~Richard Nasr

SLPUSDT.P - October 31, 2025SLPUSDT.P is maintaining a clear bearish structure, continuing to form lower highs beneath the descending trendline. Price action remains under pressure after a recent retest rejection near the $0.00116 area, suggesting limited bullish strength. The active short setup targets the $0.00084 profit level, with a stop placed at $0.001836 to protect against invalidation of the current bearish bias. Overall, this is a moderate-risk short opportunity, favoring continuation of the prevailing downtrend as long as price remains below the trendline resistance.

PUMPUSDT.P - October 31, 2025PUMPUSDT.P is displaying a corrective pullback within a broader bearish structure, currently testing the $0.00480 zone where a sell short limit order is positioned. Price action suggests a potential lower high formation, with downside continuation favored toward the $0.00330 target. The invalidation lies above $0.00555, maintaining a clear risk boundary. Overall, this represents a moderate-risk short setup, dependent on rejection confirmation from the immediate resistance zone to validate continued bearish momentum.

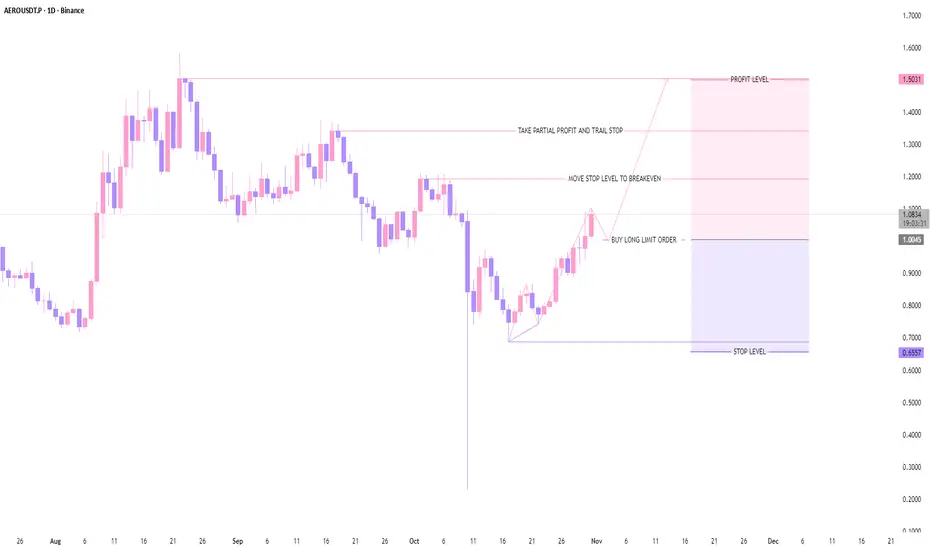
AEROUSDT.P - October 31, 2025AEROUSDT.P is forming a potential higher low structure above the $1.00 support zone after a strong impulsive leg, signaling sustained bullish momentum within the developing uptrend. The planned long entry at $1.0045 targets $1.5031, with stop placement at $0.6557 to maintain a favorable risk-to-reward profile and clear structure-based invalidation. Overall, this is a medium-risk setup, as it relies on the continuation of the current bullish structure and confirmation of demand holding near the $1.00 zone.
Graph link (GLQ)Glq usdt Daily analysis
Time frame daily
Risk rewards ratio >3 👈👌
Target =0.0162 $
Technical analysis
GLQ, as you can see in the image, had been moving within a descending channel for several months.🐻❄️ It eventually broke below the lower boundary of this descending support, signaling a potential drop to traders. Surprisingly, however, the yellow support zone you can see in the chart held very strongly — even after four separate tests, it did not break. This area will be the most important support zone for me, and I do not expect it to be broken at all. Even during the massive crash two weeks ago, when almost all coins experienced drops of up to 70%, this support remained intact.

AAPL Apple Options Ahead of EarningsIf you haven`t bought the dip on AAPL:
Now analyzing the options chain and the chart patterns of AAPL Apple prior to the earnings report this week,
I would consider purchasing the 255usd strike price Calls with
an expiration date of 2025-11-21,
for a premium of approximately $18.65.
If these options prove to be profitable prior to the earnings release, I would sell at least half of them.

TAOUSDT.P - October 30, 2025TAOUSDT.P is forming a potential lower high structure near the $449–$460 resistance zone, indicating weakening bullish momentum after a corrective rally. The planned short entry aligns with a bearish continuation setup targeting $408, with invalidation above $482 suggesting a clear risk-defined trade. Overall, this is a medium-risk setup given the proximity to resistance and the need for confirmation of rejection before entry.

Bullish? Maybe This Will Change Your Mind About ETHHi guys,
This monthly inverse chart should make things clear to you that the market is about to crash hard!
Everyone is so bullish and Microstrategy just announced another BTC purchase which is a huge RED ALERT for all crypto investors.
Stay safe and let me know what do you guys think about this !

AUDUSD: Long Signal Explained
AUDUSD
- Classic bullish pattern
- Our team expects retracement
SUGGESTED TRADE:
Swing Trade
Buy AUDUSD
Entry - 0.6552
Stop - 0.6540
Take - 0.6575
Our Risk - 1%
Start protection of your profits from lower levels
Disclosure: I am part of Trade Nation's Influencer program and receive a monthly fee for using their TradingView charts in my analysis.
❤️ Please, support our work with like & comment! ❤️

GBPJPY Buyers In Panic! SELL!
My dear subscribers,
GBPJPY looks like it will make a good move, and here are the details:
The market is trading on 202.70 pivot level.
Bias - Bearish
My Stop Loss - 203.05
Technical Indicators: Both Super Trend & Pivot HL indicate a highly probable Bearish continuation.
Target - 202.02
About Used Indicators:
The average true range (ATR) plays an important role in 'Supertrend' as the indicator uses ATR to calculate its value. The ATR indicator signals the degree of price volatility.
Disclosure: I am part of Trade Nation's Influencer program and receive a monthly fee for using their TradingView charts in my analysis.
———————————
WISH YOU ALL LUCK

GOLD: Short Trade Explained
GOLD
- Classic bearish formation
- Our team expects fall
SUGGESTED TRADE:
Swing Trade
Sell GOLD
Entry Level - 3972.9
Sl - 3987.4
Tp - 3944.7
Our Risk - 1%
Start protection of your profits from lower levels
Disclosure: I am part of Trade Nation's Influencer program and receive a monthly fee for using their TradingView charts in my analysis.
❤️ Please, support our work with like & comment! ❤️

EURUSD What Next? BUY!
My dear followers,
I analysed this chart on EURUSD and concluded the following:
The market is trading on 1.1608 pivot level.
Bias - Bullish
Technical Indicators: Both Super Trend & Pivot HL indicate a highly probable Bullish continuation.
Target - 1.1636
About Used Indicators:
A super-trend indicator is plotted on either above or below the closing price to signal a buy or sell. The indicator changes color, based on whether or not you should be buying. If the super-trend indicator moves below the closing price, the indicator turns green, and it signals an entry point or points to buy.
Disclosure: I am part of Trade Nation's Influencer program and receive a monthly fee for using their TradingView charts in my analysis.
———————————
WISH YOU ALL LUCK

GOLD Under Pressure! SELL!
My dear subscribers,
My technical analysis for GOLD is below:
The price is coiling around a solid key level - 4023.4
Bias - Bearish
Technical Indicators: Pivot Points High anticipates a potential price reversal.
Super trend shows a clear sell, giving a perfect indicators' convergence.
Goal - 3987.3
My Stop Loss - 4041.7
About Used Indicators:
By the very nature of the supertrend indicator, it offers firm support and resistance levels for traders to enter and exit trades. Additionally, it also provides signals for setting stop losses
Disclosure: I am part of Trade Nation's Influencer program and receive a monthly fee for using their TradingView charts in my analysis.
———————————
WISH YOU ALL LUCK

USDCHF Massive Short! SELL!
My dear friends,
Please, find my technical outlook for USDCHF below:
The instrument tests an important psychological level 0.7972
Bias - Bearish
Technical Indicators: Supper Trend gives a precise Bearish signal, while Pivot Point HL predicts price changes and potential reversals in the market.
Target - 0.7958
Recommended Stop Loss - 0.7980
About Used Indicators:
Super-trend indicator is more useful in trending markets where there are clear uptrends and downtrends in price.
Disclosure: I am part of Trade Nation's Influencer program and receive a monthly fee for using their TradingView charts in my analysis.
———————————
WISH YOU ALL LUCK

CHFJPY Set To Grow! BUY!
My dear friends,
CHFJPY looks like it will make a good move, and here are the details:
The market is trading on 190.75 pivot level.
Bias - Bullish
Technical Indicators: Supper Trend generates a clear long signal while Pivot Point HL is currently determining the overall Bullish trend of the market.
Goal - 191.50
About Used Indicators:
Pivot points are a great way to identify areas of support and resistance, but they work best when combined with other kinds of technical analysis
Disclosure: I am part of Trade Nation's Influencer program and receive a monthly fee for using their TradingView charts in my analysis.
———————————
WISH YOU ALL LUCK

BTCUSDT.P - October 30, 2025BTCUSDT.P - In-depth analysis | 1D Timeframe
Trend Structure:
The market is currently consolidating after a notable uptrend that peaked near the $127,000 zone. Recent weekly candles display lower highs and moderate-bodied structures, suggesting a weakening bullish impulse. The current range is bounded by resistance at $126,200–$132,900 and support at $101,500, with a deeper structural support near $74,450.
Trend Strength:
Trend momentum is weak, indicated by a low strength reading. The loss of directional follow-through implies the market is entering a mid-cycle cooling phase or secondary correction within a broader bullish structure.
Volatility Conditions:
Volatility remains moderate, reflecting an equilibrium between buyers and sellers. This volatility profile typically precedes a breakout move after extended consolidation.
Squeeze:
Current market condition suggests energy buildup and potential for a decisive breakout in the coming weeks.
Bias:
Given the weakening trend and active squeeze near mid-range support, the near-term bias is SHORT, targeting potential tests of the $101,500 level before any renewed bullish continuation can be confirmed above $126,000.
