EURAUD Technical Analysis! SELL!
My dear subscribers,
EURAUD looks like it will make a good move, and here are the details:
The market is trading on 1.7781 pivot level.
Bias - Bearish
Technical Indicators: Both Super Trend & Pivot HL indicate a highly probable Bearish continuation.
Target - 1.7707
About Used Indicators:
The average true range (ATR) plays an important role in 'Supertrend' as the indicator uses ATR to calculate its value. The ATR indicator signals the degree of price volatility.
Disclosure: I am part of Trade Nation's Influencer program and receive a monthly fee for using their TradingView charts in my analysis.
———————————
WISH YOU ALL LUCK
E-signal

EURUSD Expected Growth! BUY!
My dear friends,
Please, find my technical outlook for EURUSD below:
The price is coiling around a solid key level - 1.1807
Bias - Bullish
Technical Indicators: Pivot Points Low anticipates a potential price reversal.
Super trend shows a clear buy, giving a perfect indicators' convergence.
Goal - 1.1826
Safe Stop Loss - 1.1797
About Used Indicators:
The pivot point itself is simply the average of the high, low and closing prices from the previous trading day.
Disclosure: I am part of Trade Nation's Influencer program and receive a monthly fee for using their TradingView charts in my analysis.
———————————
WISH YOU ALL LUCK

NZDUSD - Follow The Bulls AGAIN!Hello TradingView Family / Fellow Traders. This is Richard, also known as theSignalyst.
📈NZDUSD has been overall bullish trading within the rising broadening wedge marked in blue.
This week, NZDUSD has been retesting the lower bound of the wedge.
Moreover, the green zone is a strong structure.
🏹 Thus, the highlighted blue circle is a strong area to look for buy setups as it is the intersection of the lower blue trendline and green structure.
📚 As per my trading style:
As #NZDUSD approaches the blue circle zone, I will be looking for trend-following bullish reversal setups (like a double bottom pattern, trendline break , and so on...)
📚 Always follow your trading plan regarding entry, risk management, and trade management.
Good luck!
All Strategies Are Good; If Managed Properly!
~Richard Nasr

BTC: Fed Fuel Ignites the Next Leg UpBTC's coiling like a spring between $116.5k support and $118.5k resistance, with smart money reloading post-rate cut while retail chases shadows. The Fed's 25bps trim is the cheat code here—liquidity's flowing, on-chain whales are backing the truck, and technicals scream bounce to $119k as DXY dips.
Entry zone: $117k-$117.5k for that low-risk long. TP1 at $118.5k (quick scalp), TP2 $119.5k if momentum sticks. SL tight at $116.5k to avoid the flush.
This setup's classic: Crowd's neutral-greedy, but we're thinking like institutions—patience shakes out the weak hands before the real move. Don't FOMO the chop; scoop the dip.

Bitcoin Under Pressure, Correction or Breakout Ahead ?Regarding the overall trend, BTC is currently in a corrective phase after a strong rally from March to July, and is now facing a key resistance zone between 114,500 – 117,500 USDT.
🔸 The price failed to break the recent high at 117,500.
🔸 A clear supply order block is visible between 116,500 – 117,300 USDT, acting as strong selling pressure.
🔸 There’s also a partial Fair Value Gap (FVG) between 111,000 – 113,000 USDT, which may get retested.
📈 If BTC breaks above 117,500, the likely scenario is a rally toward the major resistance at 124,000 USDT, where a potential Double Top formation may occur with a possible failed second high.
📉 On the other hand, if support at 114,500 is broken, the price could head toward the strong support zone around 110,000 – 107,000 USDT.
💡 Trade Idea (Short-Term):
Entry: Sell from price ~117,500
🎯 TP1: 114,600 (Consider closing 50% here)
🎯 TP2: If 114,600 breaks, hold the remaining position for a move toward 110,000
SL: Daily close above 117,500 (If this happens, trend flips bullish and a long trade toward 124,000 can be considered).
Please note:
This is not financial advice – I’m only sharing my personal trades.
Always do your own research before taking action.
👍 Don’t forget to like if you found this useful, and feel free to follow me for more analysis of this kind.
Best of luck 🌹

AUDUSD — Follow trend; avoid counter-movesChronex | AUDUSD - Bullish - Conviction - High | Demand respected; ride trend
Structure: Bullish
Market Phase: Expansion
Orderflow: Bullish
Daily: Bullish
H4: Bullish
H1: Bullish
Liquidity: Target
Entry Model: Chain

HBAR ANALYSIS📊 #HBAR Analysis
✅There is a formation of Falling Wedge Pattern on 4HR chart with a breakout and currently trading above its major support area🧐
Pattern signals potential bullish movement incoming in few days
👀Current Price: $0.2385
🚀 Target Price: $0.2780
⚡️What to do ?
👀Keep an eye on #HBAR price action and volume. We can trade according to the chart and make some profits⚡️⚡️
#HBAR #Cryptocurrency #TechnicalAnalysis #DYOR

AUDUSD Trading Opportunity! BUY!
My dear friends,
My technical analysis for AUDUSD is below:
The market is trading on 0.6663 pivot level.
Bias - Bullish
Technical Indicators: Both Super Trend & Pivot HL indicate a highly probable Bullish continuation.
Target - 0.6672
Recommended Stop Loss - 0.6658
About Used Indicators:
A pivot point is a technical analysis indicator, or calculations, used to determine the overall trend of the market over different time frames.
Disclosure: I am part of Trade Nation's Influencer program and receive a monthly fee for using their TradingView charts in my analysis.
———————————
WISH YOU ALL LUCK

NZDUSD: Long Signal with Entry/SL/TP
NZDUSD
- Classic bullish setup
- Our team expects bullish continuation
SUGGESTED TRADE:
Swing Trade
Long NZDUSD
Entry Point - 0.5969
Stop Loss - 0.5965
Take Profit - 0.5979
Our Risk - 1%
Start protection of your profits from lower levels
Disclosure: I am part of Trade Nation's Influencer program and receive a monthly fee for using their TradingView charts in my analysis.
❤️ Please, support our work with like & comment! ❤️

NZDCAD: Short Trade Explained
NZDCAD
- Classic bearish formation
- Our team expects fall
SUGGESTED TRADE:
Swing Trade
Sell NZDCAD
Entry Level - 0.8230
Sl - 0.8235
Tp - 0.8221
Our Risk - 1%
Start protection of your profits from lower levels
Disclosure: I am part of Trade Nation's Influencer program and receive a monthly fee for using their TradingView charts in my analysis.
❤️ Please, support our work with like & comment! ❤️

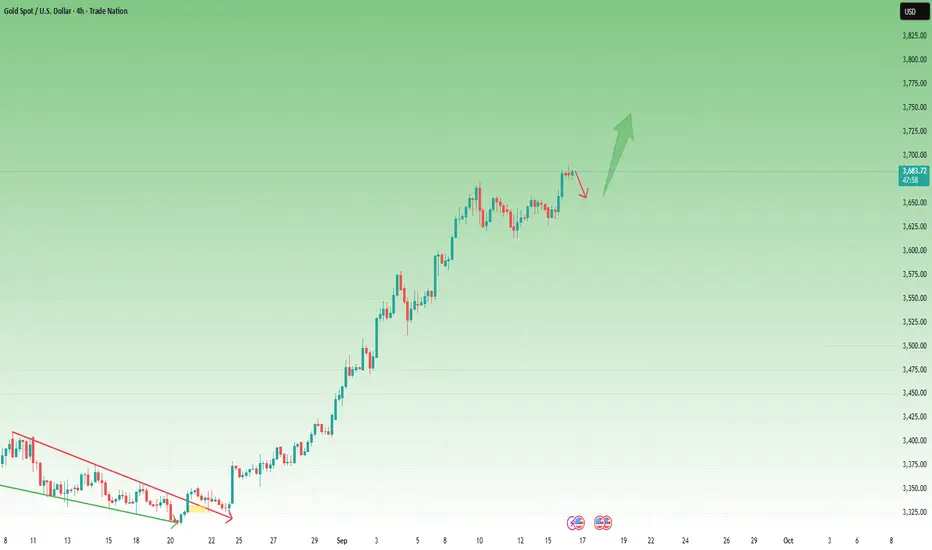
GOLD What Next? BUY!
My dear subscribers,
GOLD looks like it will make a good move, and here are the details:
The market is trading on 3674.9 pivot level.
Bias - Bullish
My Stop Loss - 3669.3
Technical Indicators: Both Super Trend & Pivot HL indicate a highly probable Bullish continuation.
Target - 3685.6
About Used Indicators:
The average true range (ATR) plays an important role in 'Supertrend' as the indicator uses ATR to calculate its value. The ATR indicator signals the degree of price volatility.
Disclosure: I am part of Trade Nation's Influencer program and receive a monthly fee for using their TradingView charts in my analysis.
———————————
WISH YOU ALL LUCK

EURJPY: Short Trading Opportunity
EURJPY
- Classic bearish formation
- Our team expects pullback
SUGGESTED TRADE:
Swing Trade
Short EURJPY
Entry - 173.72
Sl - 173.84
Tp - 173.44
Our Risk - 1%
Start protection of your profits from lower levels
Disclosure: I am part of Trade Nation's Influencer program and receive a monthly fee for using their TradingView charts in my analysis.
❤️ Please, support our work with like & comment! ❤️

USDCHF My Opinion! BUY!
My dear subscribers,
My technical analysis for USDCHF is below:
The price is coiling around a solid key level - 0.7863
Bias - Bullish
Technical Indicators: Pivot Points Low anticipates a potential price reversal.
Super trend shows a clear buy, giving a perfect indicators' convergence.
Goal - 0.7911
About Used Indicators:
By the very nature of the supertrend indicator, it offers firm support and resistance levels for traders to enter and exit trades. Additionally, it also provides signals for setting stop losses
Disclosure: I am part of Trade Nation's Influencer program and receive a monthly fee for using their TradingView charts in my analysis.
———————————
WISH YOU ALL LUCK

EURCHF Set To Grow! BUY!
My dear followers,
This is my opinion on the EURCHF next move:
The asset is approaching an important pivot point 0.9332
Bias - Bullish
Safe Stop Loss - 0.9327
Technical Indicators: Supper Trend generates a clear long signal while Pivot Point HL is currently determining the overall Bullish trend of the market.
Goal - 0.9340
About Used Indicators:
For more efficient signals, super-trend is used in combination with other indicators like Pivot Points.
Disclosure: I am part of Trade Nation's Influencer program and receive a monthly fee for using their TradingView charts in my analysis.
———————————
WISH YOU ALL LUCK

EURUSD - Follow The Bulls Indeed!Hello TradingView Family / Fellow Traders. This is Richard, also known as theSignalyst.
📈EURUSD has been overall bullish trading within the rising channel marked in blue.
This week, EURUSD has been retesting the lower bound of the channel.
Moreover, the orange zone is a strong demand.
🏹 Thus, the highlighted blue circle is a strong area to look for buy setups as it is the intersection of the lower blue trendline and orange demand.
📚 As per my trading style:
As #EURUSD approaches the blue circle zone, I will be looking for trend-following bullish reversal setups (like a double bottom pattern, trendline break , and so on...)
📚 Always follow your trading plan regarding entry, risk management, and trade management.
Good luck!
All Strategies Are Good; If Managed Properly!
~Richard Nasr

EURGBP – Battleground of Supply and Demand!EURGBP has been trading between clear supply and demand zones ⚖️, respecting both ends of the range.
After rejecting the 0.8750 supply zone, price turned lower, showing that sellers remain in control. Currently, EURGBP is hovering around the 0.8620 – 0.8640 demand zone, where buyers previously stepped in.
This area forms an important decision point 🔑:
- If demand holds, we could see a bounce back toward mid-range levels.
- If broken, a continuation lower would confirm supply’s dominance 📉.
Patience here is key ⏳ — waiting for confirmation at these zones can help filter out false moves and set up a cleaner trade.
⚠️ Disclaimer: This is not financial advice. Always do your own research and manage risk properly.
📚 Always follow your trading plan regarding entry, risk management, and trade management.
Good luck!
All Strategies Are Good; If Managed Properly!
~Richard Nasr

XAUUSD – Bullish Bias Targeting Buy-Side LiquidityOn the 1H timeframe, my perspective on Gold (XAUUSD) remains bullish, with the main target being the buy-side liquidity above current price.
Price has recently formed a bullish Fair Value Gap (FVG), which may serve as support and a potential launch point for further upside. If price holds here, we could see continuation toward higher levels. For entry, I’ll be waiting for lower timeframe reaction and confirmation.
However, it’s also important to note the sell-side liquidity resting just below the FVG. There is a possibility that price may first sweep this liquidity, tap into the underlying bullish order block, and then begin the upward move.
For this reason, I am watching two key areas:
1️⃣ The current bullish FVG as initial support.
2️⃣ The deeper bullish order block, should liquidity below be cleared.
In both cases, my bias remains bullish, but execution will depend on LTF confirmation at these zones.
💌It is my honor to share your comments with me💌
🔎 DYOR
💡Wait for the update!

GOLD: Bullish Continuation & Long Signal
GOLD
- Classic bullish formation
- Our team expects growth
SUGGESTED TRADE:
Swing Trade
Buy GOLD
Entry Level - 3689.9
Sl - 3686.7
Tp - 3696.0
Our Risk - 1%
Start protection of your profits from lower levels
Disclosure: I am part of Trade Nation's Influencer program and receive a monthly fee for using their TradingView charts in my analysis.
❤️ Please, support our work with like & comment! ❤️

EURUSD Trading Opportunity! SELL!
My dear followers,
I analysed this chart on EURUSD and concluded the following:
The market is trading on 1.1809 pivot level.
Bias - Bearish
Technical Indicators: Both Super Trend & Pivot HL indicate a highly probable Bearish continuation.
Target - 1.1749
About Used Indicators:
A super-trend indicator is plotted on either above or below the closing price to signal a buy or sell. The indicator changes color, based on whether or not you should be buying. If the super-trend indicator moves below the closing price, the indicator turns green, and it signals an entry point or points to buy.
Disclosure: I am part of Trade Nation's Influencer program and receive a monthly fee for using their TradingView charts in my analysis.
———————————
WISH YOU ALL LUCK

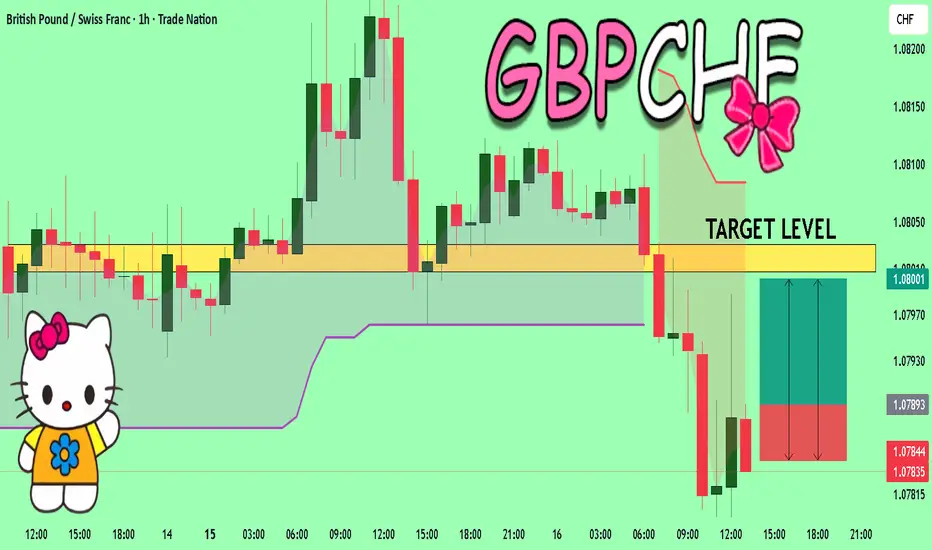
GBPCHF Will Explode! BUY!
My dear friends,
Please, find my technical outlook for GBPCHF below:
The instrument tests an important psychological level 1.0789
Bias - Bullish
Technical Indicators: Supper Trend gives a precise Bullish signal, while Pivot Point HL predicts price changes and potential reversals in the market.
Target - 1.0800
Recommended Stop Loss - 1.0784
About Used Indicators:
Super-trend indicator is more useful in trending markets where there are clear uptrends and downtrends in price.
Disclosure: I am part of Trade Nation's Influencer program and receive a monthly fee for using their TradingView charts in my analysis.
———————————
WISH YOU ALL LUCK
Complacency Before the Fall? Bulls in Control, But For How Long?Yesterday, I was debating whether last week’s consolidation was a rectangle (suggesting continuation) or, in fact, a triple top (hinting at correction). I began the session with a slightly bearish bias, but the reversal from support and the subsequent breakout above the consolidation’s resistance forced me to reevaluate. The breakout was clean, momentum followed, and the market even printed a new ATH at 3689.
Unfortunately, my pending buy order wasn’t filled, so I remain flat for now—an important reminder that in trading, sometimes discipline keeps you safe, even if you miss an opportunity.
Technical outlook:
• Price broke above resistance, confirming bullish control.
• The 3660 zone now acts as key support—any dips into that area can be treated as potential buying opportunities.
• The measured target for this breakout points toward 3710, which could represent the next objective for the bulls.
But here’s the psychological twist:
The market feels euphoric and complacent at this moment. Historically, reversals from this type of mindset tend to be brutal. Traders get comfortable, start believing in endless uptrends, and that’s exactly when the trapdoor opens.
Medium-term, I still anticipate a significant correction. Timing it is always the hardest part, but acknowledging the risk helps keep emotions under control. For now, bulls clearly hold the wheel—but they may not realize they’re driving toward a cliff.
🚀 Stay sharp, trade the trend, but don’t forget that markets punish overconfidence.
EURUSD - Already Overbought!Hello TradingView Family / Fellow Traders. This is Richard, also known as theSignalyst.
📈EURUSD has been overall bullish trading within the rising channel marked in blue.
However, it is currently retesting the upper bound of its channel.
Moreover, the green zone is a strong resistance.
🏹 Thus, the highlighted red circle is a strong area to look for sell setups as it is the intersection of the upper blue trendline and green resistance.
📚 As per my trading style:
As #EURUSD approaches the red circle zone, I will be looking for bearish reversal setups (like a double top pattern, trendline break , and so on...)
📚 Always follow your trading plan regarding entry, risk management, and trade management.
Good luck!
All Strategies Are Good; If Managed Properly!
~Richard Nasr

SOL The Whales are Selling at This Strong Resistance Level 230$SOL Current Market Update
The coin is now facing a very strong resistance around $230 .
This presents a great short opportunity .
After carefully monitoring buy and sell orders on-chain, I noticed a strong confirmation for the short setup:
Whales and Market Makers sell orders are clustered heavily around the $228 – $230 resistance zone.
✅ My Personal Strategy:
Short Entry: Resistance zone between $228 – $230
🎯 Target 1: $220
🎯 Target 2: $216
Please note:
This is not financial advice – I’m only sharing my personal trades.
Always do your own research before taking action.
👍 Don’t forget to like if you found this useful, and feel free to follow me for more analysis of this kind.
Best of luck 🌹
