SPY: Long Trading Opportunity
SPY
- Classic bullish formation
- Our team expects growth
SUGGESTED TRADE:
Swing Trade
Buy SPY
Entry Level - 671.95
Sl - 668.83
Tp - 677.75
Our Risk - 1%
Start protection of your profits from lower levels
Disclosure: I am part of Trade Nation's Influencer program and receive a monthly fee for using their TradingView charts in my analysis.
❤️ Please, support our work with like & comment! ❤️
E-signal

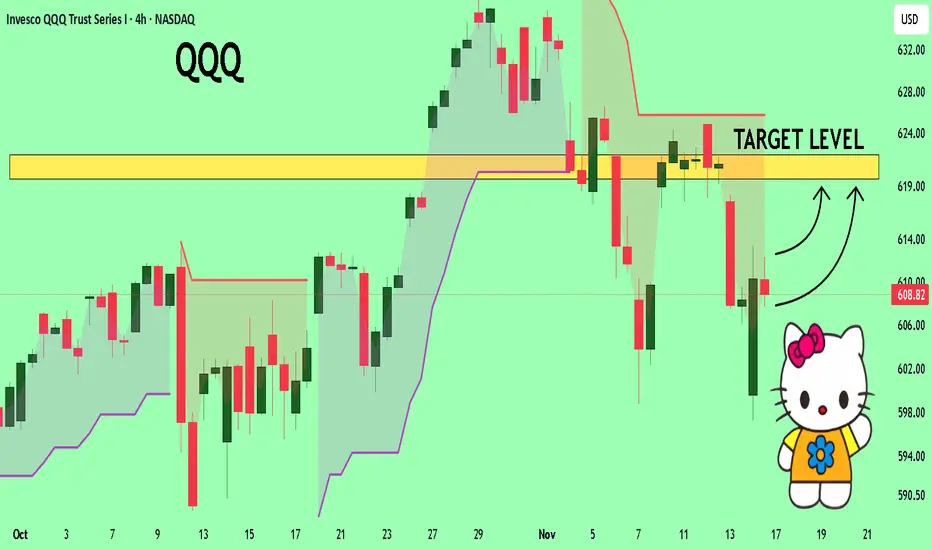
QQQ What Next? BUY!
My dear friends,
Please, find my technical outlook for QQQ below:
The instrument tests an important psychological level 608.82
Bias - Bullish
Technical Indicators: Supper Trend gives a precise Bullish signal, while Pivot Point HL predicts price changes and potential reversals in the market.
Target - 619.63
About Used Indicators:
Super-trend indicator is more useful in trending markets where there are clear uptrends and downtrends in price.
Disclosure: I am part of Trade Nation's Influencer program and receive a monthly fee for using their TradingView charts in my analysis.
———————————
WISH YOU ALL LUCK
EURUSD My Opinion! BUY!
My dear followers,
I analysed this chart on EURUSD and concluded the following:
The market is trading on 1.1621 pivot level.
Bias - Bullish
Technical Indicators: Both Super Trend & Pivot HL indicate a highly probable Bullish continuation.
Target - 1.1642
Safe Stop Loss - 1.1608
About Used Indicators:
A super-trend indicator is plotted on either above or below the closing price to signal a buy or sell. The indicator changes color, based on whether or not you should be buying. If the super-trend indicator moves below the closing price, the indicator turns green, and it signals an entry point or points to buy.
Disclosure: I am part of Trade Nation's Influencer program and receive a monthly fee for using their TradingView charts in my analysis.
———————————
WISH YOU ALL LUCK

US30 Set To Grow! BUY!
My dear subscribers,
My technical analysis for US30 is below:
The price is coiling around a solid key level - 47178
Bias - Bullish
Technical Indicators: Pivot Points High anticipates a potential price reversal.
Super trend shows a clear buy, giving a perfect indicators' convergence.
Goal - 47528
About Used Indicators:
By the very nature of the supertrend indicator, it offers firm support and resistance levels for traders to enter and exit trades. Additionally, it also provides signals for setting stop losses
Disclosure: I am part of Trade Nation's Influencer program and receive a monthly fee for using their TradingView charts in my analysis.
———————————
WISH YOU ALL LUCK

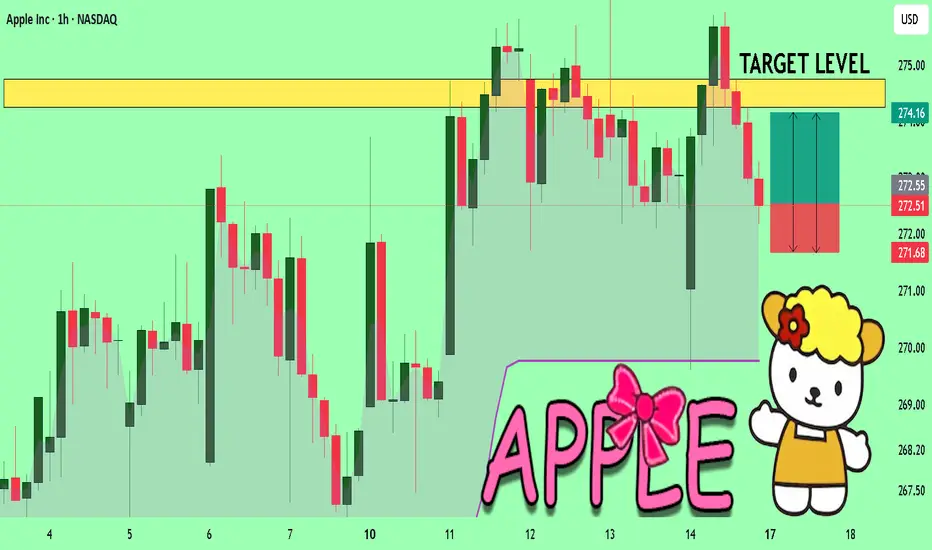
APPLE Will Explode! BUY!
My dear friends,
APPLE looks like it will make a good move, and here are the details:
The market is trading on 272.51 pivot level.
Bias - Bullish
Technical Indicators: Supper Trend generates a clear long signal while Pivot Point HL is currently determining the overall Bullish trend of the market.
Goal - 274.26
Recommended Stop Loss - 271.68
About Used Indicators:
Pivot points are a great way to identify areas of support and resistance, but they work best when combined with other kinds of technical analysis
Disclosure: I am part of Trade Nation's Influencer program and receive a monthly fee for using their TradingView charts in my analysis.
———————————
WISH YOU ALL LUCK
STRKUSDT.P - November 15, 2025STRKUSDT.P is consolidating below a key 0.1840–0.1860 resistance zone, with price showing hesitation and potential for either a breakout toward the 0.1980 profit level or a breakdown toward the 0.1388 support zone.
A decisive close above 0.1860 would confirm bullish continuation, while failure to hold the 0.1650 support trigger could open a sharper move toward 0.1400.
Risk Assessment: Moderate — Structure shows balanced risk with clear breakout and breakdown triggers; traders may consider adjusting stops near 0.1760 once price tests the upper resistance to reduce exposure.

DASHUSDT.P - November 15, 2025Price has been climbing in a steady uptrend, supported by a rising trendline, and is now stalling inside a key resistance zone where sellers have previously been active. A clean break above this area could open the move toward the 88–90 level, while rejection here may trigger a pullback toward the 72–70 support zone where buyers last defended.

ZECUSDT.P - November 15, 2025Price is in a strong short-term uptrend, but momentum is stalling just beneath the immediate resistance zones where sellers has previously stepped in. A clean break and hold above this area could open the path toward the next resistance around 720–740, while rejection here may trigger a pullback toward the 600–580 support zone where buyers last showed strength.

XRPUSDT.P - November 15, 2025XRPUSDT is trading around $2.28 on the 15-minute chart, still moving within a short-term downtrend under a descending trendline. Price is currently reacting inside a $2.25–$2.29 support zone, showing early signs of compression near trendline resistance. Immediate horizontal resistance sits at $2.31–$2.34, which must be reclaimed for bullish momentum to develop. A clean breakout and retest above this zone could open a move toward the $2.49 resistance level.
Failure to break the trendline and rejection from the $2.31–$2.34 support may trigger another leg down, with downside targets at $2.21–$2.24 and possibly the deeper support around $2.14–$2.16. Overall short-term outlook remains bearish to neutral, pending a confirmed breakout above near-term resistance.

ETHUSDT.P - November 15, 2025The price is currently below the trendline and seems to be consolidating. If the price breaks upwards 3,276.75, consider buying long with the first target at 3,441.72. Partial profits can be taken at this level, and the stop loss should be adjusted to break-even.
If the price breaks below 3,168.65, consider entering a short position, with the next potential target near 3,100.

BTCUSDT.P - November 15, 2025Price has been in a clear downtrend, confirmed by a descending trendline that price continues to respect. Recently, momentum has slowed, and price is forming a short-term rebound from the lower trading range.
The market is now approaching the descending trendline, which is the first obstacle. A clean break and close above this trendline would suggest that bearish pressure is weakening.
There is a horizontal resistance zone around $97,000, where price has reacted before. If price manages to break above the trendline and push into this area, there is room for a short-term continuation upward.
If the trendline holds, price may pull back toward the lower range around $94,000–$93,500, where buyers recently stepped in.

EURUSD FRGNT Daily Forecast -Q4 | W46 | D14 | Y25 | 📅 Q4 | W46 | D14 | Y25 |
📊 EURUSD FRGNT Daily Forecast
FRGNT FUN COUPON FRIDAY
🔍 Analysis Approach:
I’m applying Smart Money Concepts, focusing on:
Identifying Points of Interest on the Higher Time Frames (HTFs) 🕰️
Using those POIs to define a clear trading range 📐
Refining those zones on Lower Time Frames (LTFs) 🔎
Waiting for a Break of Structure (BoS) for confirmation ✅
This method allows me to stay precise, disciplined, and aligned with the market narrative, rather than chasing price.
💡 My Motto:
"Capital management, discipline, and consistency in your trading edge."
A positive risk-to-reward ratio, paired with a high win rate, is the backbone of any solid trading plan 📈🔐
⚠️ Losses?
They’re part of the mathematical game of trading 🎲
They don’t define you — they’re necessary, they happen, and we move forward 📊➡️
🙏 I appreciate you taking the time to review my Daily Forecast.
Stay sharp, stay consistent, and protect your capital
— FRNGT 🚀
OANDA:EURUSD

BTC Bitcoin & Crypto Selloff Alert: Is a Second Wave Imminent?If you haven`t bought BTC before the rally:
The cryptocurrency market is still reeling from the brutal sell-off on Friday, October 10, 2025, triggered by U.S. President Donald Trump's announcement of 100% tariffs on Chinese imports. Bitcoin plummeted below $105,000, Ethereum dropped over 16% to under $3,700, and the broader market saw liquidations exceeding $19 billion—the largest single-day wipeout in crypto history, nine times bigger than February 2025's crash.
While Monday and Tuesday brought some recovery, with Bitcoin climbing back above $115,000 and the total market cap topping $4 trillion, underlying issues like inflated trading volumes, massive altcoin losses, and a prominent whale re-entering a short position suggest this might just be a dead-cat bounce. This article explores why a second leg down could be imminent, incorporating technical analysis for TradingView users eyeing volatility plays.
The Friday Flash Crash: A Perfect Storm Amplified by Fake Volumes
The October 10 crash unfolded rapidly, with Bitcoin shedding nearly 10% in hours and over $200 billion erased from the market cap. But what made the drop so severe, especially for altcoins?
A key culprit: fake trading volumes driven by wash trading. Wash trading, where traders buy and sell the same asset to themselves to inflate volumes, creates the illusion of liquidity and interest without real economic activity. Estimates suggest that up to 87-88% of crypto volumes are fake, often used in pump-and-dump schemes or to lure retail investors.
In thin markets like crypto, these artificial volumes mask true liquidity. When real selling pressure hit—amplified by leveraged positions and the tariff news—exchanges like Binance saw cascading liquidations due to flawed margin systems. This "flash crash" wiped out $600–900 million in longs alone, but the fake volumes meant the market couldn't absorb the shock, leading to exaggerated drops.
Analysts note that such illusions persist in 2025, with AI tools now exposing them, but regulators lag behind. If volumes remain overstated, any renewed catalyst could trigger another liquidity vacuum, setting up a second leg down.
Altcoin Bloodbath: 50–90% Drops Expose Vulnerabilities
While Bitcoin and Ethereum recovered somewhat, altcoins bore the brunt of the carnage. An index tracking altcoins (excluding BTC, ETH, and stablecoins) cratered about 33% in just 25 minutes, with some tokens plunging 50–90%. Tokens like Solana, XRP, and Dogecoin lost 20–60%, but lesser-known altcoins saw even steeper declines, highlighting the sector's over-leveraged and illiquid nature.
This disproportionate pain stems from altcoins' reliance on hype and speculative inflows, often propped up by those same fake volumes. In a risk-off environment, capital flees to safer assets like Bitcoin, whose dominance spiked during the crash.
Altseason indicators are now cooling (76–78 previously).
Bitcoin dominance dropped below 59% post-crash.
If earnings season in traditional markets reveals economic weakness, spilling over to crypto, altcoins could lead the next sell-off wave, potentially dropping another 20–50% if support levels break.
The Whale Factor: $192M Profit, Then Re-Entry Signals Bearish Conviction
Adding fuel to the fire is a mysterious crypto whale who timed the crash impeccably. Just 30 minutes before Trump's tariff announcement, this entity opened a massive short position on Bitcoin, pocketing $192 million in profits as the market tanked.
Speculation abounds: Was it insider knowledge, or just savvy trading? Either way, the whale didn't stop there—they've re-entered with another short, increasing their position to $340 million, and even opened a fresh $163 million bearish bet.
Other whales have followed suit, including:
A Satoshi-era entity shorting $1.1 billion before the news
An OG whale opening a $392 million short
These moves suggest high conviction in further declines, possibly tied to ongoing trade tensions or macroeconomic risks. In a market where whales can move prices, this re-entry could catalyze the second leg, especially if it triggers more liquidations.
My price target for Bitcoin is $95K

GOLD On The Rise! BUY!
My dear friends,
Please, find my technical outlook for GOLD below:
The instrument tests an important psychological level 4125.1
Bias - Bullish
Technical Indicators: Supper Trend gives a precise Bullish signal, while Pivot Point HL predicts price changes and potential reversals in the market.
Target - 4139.79
Recommended Stop Loss - 4117.21
About Used Indicators:
Super-trend indicator is more useful in trending markets where there are clear uptrends and downtrends in price.
Disclosure: I am part of Trade Nation's Influencer program and receive a monthly fee for using their TradingView charts in my analysis.
———————————
WISH YOU ALL LUCK

EURUSD Set To Fall! SELL!
My dear subscribers,
EURUSD looks like it will make a good move, and here are the details:
The market is trading on 1.1629 pivot level.
Bias - Bearish
My Stop Loss - 1.1642
Technical Indicators: Both Super Trend & Pivot HL indicate a highly probable Bearish continuation.
Target - 1.1607
About Used Indicators:
The average true range (ATR) plays an important role in 'Supertrend' as the indicator uses ATR to calculate its value. The ATR indicator signals the degree of price volatility.
Disclosure: I am part of Trade Nation's Influencer program and receive a monthly fee for using their TradingView charts in my analysis.
———————————
WISH YOU ALL LUCK

GBPJPY: Long Trade with Entry/SL/TP
GBPJPY
- Classic bullish formation
- Our team expects pullback
SUGGESTED TRADE:
Swing Trade
Long GBPJPY
Entry - 202.77
Sl - 202.54
Tp - 203.28
Our Risk - 1%
Start protection of your profits from lower levels
Disclosure: I am part of Trade Nation's Influencer program and receive a monthly fee for using their TradingView charts in my analysis.
❤️ Please, support our work with like & comment! ❤️

EURJPY Sellers In Panic! BUY!
My dear subscribers,
This is my opinion on the EURJPY next move:
The instrument tests an important psychological level 179.30
Bias - Bullish
Technical Indicators: Supper Trend gives a precise Bullish signal, while Pivot Point HL predicts price changes and potential reversals in the market.
Target - 179.52
My Stop Loss - 179.18
About Used Indicators:
On the subsequent day, trading above the pivot point is thought to indicate ongoing bullish sentiment, while trading below the pivot point indicates bearish sentiment.
Disclosure: I am part of Trade Nation's Influencer program and receive a monthly fee for using their TradingView charts in my analysis.
———————————
WISH YOU ALL LUCK

AUDCAD: Bullish Continuation & Long Trade
AUDCAD
- Classic bullish pattern
- Our team expects retracement
SUGGESTED TRADE:
Swing Trade
Buy AUDCAD
Entry - 0.9155
Stop - 0.9145
Take -0.9173
Our Risk - 1%
Start protection of your profits from lower levels
Disclosure: I am part of Trade Nation's Influencer program and receive a monthly fee for using their TradingView charts in my analysis.
❤️ Please, support our work with like & comment! ❤️

GOLD Massive Long! BUY!
My dear friends,
Please, find my technical outlook for GOLD below:
The price is coiling around a solid key level - 4172.5
Bias - Bullish
Technical Indicators: Pivot Points Low anticipates a potential price reversal.
Super trend shows a clear buy, giving a perfect indicators' convergence.
Goal - 4195.5
Safe Stop Loss - 4159.1
About Used Indicators:
The pivot point itself is simply the average of the high, low and closing prices from the previous trading day.
Disclosure: I am part of Trade Nation's Influencer program and receive a monthly fee for using their TradingView charts in my analysis.
———————————
WISH YOU ALL LUCK

XRPUSDT.P - November 14, 2025XRPUSDT on the 15-minute chart is stabilizing after a sharp decline, forming a short-term base above $2.26. Price is currently compressing beneath a clear intraday resistance band around $2.34–$2.35, which aligns with the marked breakout level. A decisive push and sustained hold above this zone would signal bullish momentum returning, opening room for a continuation move toward the $2.50–$2.52 profit target. Failure to break higher keeps price vulnerable to another retest of the lower support region, and a breakdown below $2.26 would invalidate the bullish setup and expose further downside.

ETHUSDT.P - November 14, 2025ETHUSDT.P on the 15-minute chart remains in a short-term downtrend, defined by a clear descending trendline that continues to cap price. Current price action is consolidating beneath the $3,240 resistance zone, where repeated rejections suggest sellers are still in control unless a clean breakout and retest occur above this level. Immediate support sits near $3,104; a breakdown below this shelf would likely accelerate momentum toward the broader demand zone around $2,960–$2,900. Conversely, if buyers manage to reclaim the trendline and hold above the $3,240 region, a short-term relief rally could develop, but until then the bias leans bearish within the current structure.

BTCUSDT.P - November 14, 2025BTCUSDT.P – 15m
Trend:
Price remains in a clear short-term downtrend, confirmed by the descending trendline that continues to act as resistance.
Current Structure:
Price is consolidating just above a nearby support area around 96,800–97,200.
A second, larger support area sits lower at 93,500–94,200, which may be tested if the current support fails.
Key Levels:
Resistance: 99,300–99,800, which aligns with the descending trendline. This is a strong area where sellers have previously reacted.
Support:
Immediate: 96,800–97,200
Major: 93,500–94,200
Scenarios:
Bullish:
A decisive break above the descending trendline combined with a move back above 99,300–99,800 would suggest a potential short-term trend reversal.
Bearish:
Failure to break the trendline and a drop below 96,800–97,200 would increase the likelihood of price moving down toward 93,500–94,200.
Momentum:
Recent candles show indecision and limited follow-through, indicating the market is waiting for a breakout or breakdown at this trendline–support intersection.

XRPUSDT.P - November 13, 2025Testing out the sell signal generated by my personal minimalist buy and sell signal indicator (signals by miljedtothemoon v1) on the XRPUSDT.P (5-minute chart).
Yesterday, the indicator printed two winning trades — one on a buy (long) signal and one on a sell (short) signal. Let’s see if it works out today.
Disclaimer: This tool is still a work in progress and not 100% reliable. The signals can be high-risk and may produce false entries or exits.
This is for personal and educational purposes only — not financial advice, an advertisement, or a promotion.
