Derivatives Make Trading EasyIntroduction
Derivatives are among the most influential financial innovations of the modern era, playing a crucial role in shaping global financial markets. A derivative is a financial contract whose value is derived from an underlying asset, index, or rate. These underlying assets can include commodities, currencies, bonds, equities, or market indices. The primary purpose of derivatives is to manage risk, enhance liquidity, and enable traders and investors to speculate or hedge against future price movements.
In today’s complex and interconnected markets, derivatives have become indispensable tools. They make trading easier by allowing market participants to transfer risk, leverage capital efficiently, and discover prices more transparently. From futures and options to swaps and forwards, derivatives are central to both institutional and retail trading strategies worldwide.
Understanding Derivatives
A derivative derives its price from an underlying asset or benchmark. For instance, a crude oil futures contract is based on the expected future price of oil. The buyer or seller of a derivative does not necessarily have to own the physical asset; rather, they engage in a contract based on the price movement of that asset.
There are four main types of derivatives:
Futures – Standardized contracts to buy or sell an asset at a specified future date and price.
Options – Contracts that give the holder the right, but not the obligation, to buy or sell an asset at a predetermined price.
Forwards – Customized, over-the-counter (OTC) agreements to trade an asset in the future at a fixed price.
Swaps – Contracts in which two parties exchange cash flows or other financial instruments over time.
These instruments are used for hedging, speculation, and arbitrage—three pillars that make derivatives essential in trading.
Derivatives as a Tool for Risk Management
One of the greatest advantages of derivatives is their ability to hedge risk. Price volatility in assets like oil, currencies, and equities can significantly affect businesses, investors, and governments. Derivatives provide a means to protect against adverse price movements.
For example, consider an airline company concerned about fluctuating oil prices. Since fuel costs represent a large portion of operational expenses, the company may purchase oil futures to lock in a price for future deliveries. This strategy ensures that even if oil prices rise sharply, the airline’s fuel costs remain stable. Similarly, exporters and importers use currency derivatives to hedge against foreign exchange volatility.
In essence, derivatives transfer risk from those who want to avoid it (hedgers) to those who are willing to take it (speculators). This risk redistribution stabilizes markets and enables participants to focus on their core activities without worrying about unpredictable price swings.
Facilitating Leverage and Capital Efficiency
Another reason derivatives make trading easier is through leverage. Leverage allows traders to control large positions with relatively small amounts of capital. This is because derivatives require only a margin or initial deposit rather than full payment of the underlying asset’s value.
For instance, instead of buying 100 shares of a company at ₹1,000 each (totaling ₹1,00,000), a trader could buy a futures contract that represents the same 100 shares by depositing a margin of just 10%, or ₹10,000. If the stock price rises, the percentage return on the margin is magnified, offering higher potential profits.
While leverage increases both gains and risks, it allows participants to deploy capital more efficiently, freeing funds for other investments or hedging needs. For professional traders, portfolio managers, and institutions, this efficiency is a cornerstone of modern trading strategies.
Enhancing Market Liquidity
Derivatives also increase liquidity in financial markets. Liquidity refers to the ease with which assets can be bought or sold without significantly affecting their prices. Derivative markets attract diverse participants—hedgers, speculators, and arbitrageurs—who together contribute to high trading volumes and continuous price discovery.
For example, the introduction of futures and options on equity indices such as the Nifty 50 or S&P 500 has dramatically boosted liquidity in underlying stock markets. Traders can enter or exit positions quickly, and price discrepancies between derivatives and underlying assets are swiftly corrected through arbitrage. This constant interaction between cash and derivative markets ensures price stability and efficiency.
Thus, derivatives not only make trading more active but also promote smoother market functioning, benefitting investors, institutions, and regulators alike.
Price Discovery and Transparency
Price discovery is the process through which markets determine the fair value of assets. Derivatives play a vital role in this mechanism. Since derivative prices reflect traders’ expectations about future asset values, they serve as leading indicators of market sentiment.
For example, if the futures price of gold is significantly higher than its current spot price, it suggests that investors expect gold prices to rise. Similarly, options trading activity can reveal expectations about market volatility. Analysts and policymakers closely monitor derivatives data—like the VIX index, derived from options on the S&P 500—to gauge investor confidence and predict potential market movements.
This informational efficiency makes derivatives indispensable in modern trading, enabling participants to anticipate trends and adjust strategies accordingly.
Speculation and Profit Opportunities
While hedging focuses on risk management, speculation involves taking positions to profit from price fluctuations. Derivatives make speculation more accessible and efficient. Since derivatives require lower capital outlays and offer high liquidity, traders can speculate on short-term movements in equities, commodities, interest rates, or currencies without owning the underlying assets.
For instance, a trader who believes that crude oil prices will increase might buy oil futures. If prices indeed rise, the trader can sell the contract for a profit without ever dealing with the physical commodity. Similarly, options traders can design complex strategies—such as straddles, strangles, and spreads—to profit from both rising and falling markets.
Speculators play a crucial role in maintaining market balance. Their willingness to assume risk provides liquidity and ensures smoother price adjustments, indirectly benefiting hedgers and investors.
Arbitrage and Market Efficiency
Arbitrage—the practice of exploiting price differences between related markets—is another area where derivatives simplify trading. Arbitrageurs identify discrepancies between the spot price of an asset and its derivative price, buying in one market and selling in another to lock in risk-free profits.
For instance, if a stock trades at ₹500 in the cash market but its futures contract is priced at ₹510, an arbitrageur could buy the stock and simultaneously sell the futures. When the prices converge, they earn a small profit with minimal risk.
This activity keeps markets aligned, preventing excessive mispricing and enhancing overall efficiency. The continuous presence of arbitrageurs ensures that derivative prices accurately reflect the underlying asset’s value.
Applications Across Sectors
Derivatives are not limited to financial institutions. They are used across sectors for strategic and operational benefits:
Corporations use currency and interest rate derivatives to manage cross-border risks and borrowing costs.
Farmers and commodity producers hedge against unpredictable weather or price fluctuations using futures contracts.
Investors and fund managers use equity and index derivatives to balance portfolios and protect returns.
Governments and central banks utilize derivatives for monetary policy operations and debt management.
By providing flexibility and adaptability, derivatives make trading and financial management easier for all these entities.
Derivatives and Globalization
The rise of global trade and interconnected capital markets has further amplified the importance of derivatives. With cross-border investments, exchange rate volatility, and global supply chains, businesses face multiple layers of financial risk. Derivatives provide a universal language for managing these exposures.
For example, multinational corporations use foreign exchange swaps to manage international cash flows, while global investors employ interest rate futures to navigate shifting monetary policies across countries. In this way, derivatives enable smoother international trade and investment, fostering global financial integration.
Technological Advancements and Derivative Trading
Modern technology has revolutionized derivative trading. Algorithmic and high-frequency trading systems execute thousands of derivative transactions per second, ensuring real-time liquidity and efficient pricing. Online trading platforms allow retail investors to access futures and options markets with ease, democratizing financial participation.
Additionally, innovations like exchange-traded derivatives (ETDs) and clearinghouses have enhanced safety and transparency. Centralized clearing reduces counterparty risk, ensuring that both sides of a trade are guaranteed by the exchange. This framework has made derivatives trading more secure and accessible than ever before.
Challenges and Risks
While derivatives make trading easier, they also come with risks. Excessive leverage can amplify losses, and complex derivative structures can be misused or misunderstood. The 2008 global financial crisis highlighted how poorly regulated derivatives—especially credit default swaps—can destabilize entire economies.
Therefore, it is vital for traders and institutions to implement strong risk management, compliance, and transparency measures. Exchanges and regulators such as SEBI, CFTC, and ESMA continuously update guidelines to ensure that derivative trading remains fair, secure, and beneficial to the broader economy.
Conclusion
Derivatives have fundamentally transformed how the world trades, invests, and manages financial risk. They simplify trading by enabling participants to hedge exposures, speculate intelligently, discover prices efficiently, and optimize capital use. From farmers and corporations to fund managers and central banks, derivatives serve as versatile instruments that empower decision-making in an uncertain world.
By transferring risk, enhancing liquidity, and increasing efficiency, derivatives make financial markets more resilient and dynamic. However, like any powerful tool, they require discipline, understanding, and regulatory oversight to ensure stability. When used responsibly, derivatives do not just make trading easy—they make it smarter, safer, and more strategic in the global financial ecosystem.
Easytrade

Santos +449% after BULL signal 🚀🚀 Retrace imminent?SANTOS pumped 449% (green price range) after the bull Supertrend Ninja - Clean signals (green vertical line on the background).
RSI at 95 is heavily overbought. I do not see any bearish divergences forming on the RSI Brown or RSI on the daily chart. Although I expect a retrace to be likely before another run up. It really depends on BTC going sideways instead of going down more. If we take a look at the Average Directional Index ( ADX DI) its still in the bullish zone. Currently SANTOS is way above its Basis Bollinger Band , Band Basis 20 Period SMA . And above the LSMA as well.
A healthy retrace first, before another run up to is a possible scenario. But it most likely needs BTC to go sideways for this to happen. Buying here is NOT recommended. Support and resistances are highlighted as grey and light green horizontal blocks.
Remember to always take profits and use proper risk management!
Thank you for reading.
Namasté 🙏
Disclaimer: Ideas are for entertainment purposes only. Not financial advice. Your own due diligence is highly advised before entering trades. Past performance is no guarantee of future returns.
What Indicators Do I Like To Use:
I am using the "Supertrend Ninja - Clean", which is a trend-following indicator (Green and red vertical lines on the background). When the background of the candlestick closes green (vertical line). It indicates a possible bullish (up)trend. And red for possible downtrends.


BTCST UP 138% and then another 328% after bullish signal 🚀🚀🚀BTCST pumped 328% after the bullish Supertrend Ninja - Clean signal (green vertical line on the background). Before that it had a pump of 138%.
BTCST broke out of the bullish Zone of the Ichimoku Cloud, which is bullish . The RSI is in the overbought zone at 92. RSI Brown at 136. If we take a look at the Average Directional Index ( ADX DI) its starting to be bearish, as it is pointing downwards. Currently BTCST is way above its upper Bollinger Band, Band Basis 20 Period SMA . A retrace back within the Bollinger Band is more likely. The risk to reward right now to enter a trade is bad.
Remember to always take profits and use risk management.
Waiting patiently on a bullish Supertrend Ninja signal, before entering a long paid off.
Thank you for reading.
Namasté 🙏
Disclaimer: Ideas are for entertainment purposes only. Not financial advice. Your own due diligence is highly advised before entering trades. Past performance is no guarantee of future returns.
What Indicators Do I Use:
In the chart I am using the "Supertrend Ninja - Clean", which is a trend-following indicator (Green and red vertical lines on the background). When the background of the candlestick closes green (vertical line). It indicates a possible bullish (up)trend. And red for downtrends.

UPDATE: WING UP 600% after bullish signal 🚀WING pumped 600% after the bullish Supertrend Ninja - Clean signal (green vertical line on the background).
WING broke out of the bullish Zone of the Ichimoku Cloud , which is bullish . The RSI is in the overbought zone at 95. RSI Brown at 133. If we take a look at the Average Directional Index ( ADX DI) its starting to be bearish, as it is pointing downwards. Currently WING is way above its upper Bollinger Band, Band Basis 20 Period SMA . A retrace back within the Bollinger Band is more likely. The risk to reward right now to enter a trade is bad.
Waiting patiently on a bullish Supertrend Ninja signal, before entering a long paid off.
Thank you for reading.
Namasté 🙏
Disclaimer: Ideas are for entertainment purposes only. Not financial advice. Your own due diligence is highly advised before entering trades. Past performance is no guarantee of future returns.
What Indicators Do I Use:
In the chart I am using the "Supertrend Ninja - Clean", which is a trend-following indicator (Green and red vertical lines on the background). When the background of the candlestick closes green (vertical line). It indicates a possible bullish (up)trend. And red for downtrends.

DAX Squeeze over? Downside TargetsEU Oil embargo on China and record German Inflation is a toxic mix that may short circuit the DAX short squeeze.
Sellers are worried about inflation and the EU news has seen Oil push up to $118 overnight so if the market wants to worry it has more than enough reason especially if it goes higher above $120.
Targets are 1-2 day down towards 14300-14200, a new high above 14650 negates the trade and perhaps signals bear market in trouble.
easyMarkets Account on TradingView allows you to combine easyMarkets industry leading conditions, regulated trading and tight fixed spreads with TradingView's powerful social network for traders, advanced charting and analytics. Access no slippage on limit orders, tight fixed spreads, negative balance protection, no hidden fees or commission, and seamless integration.
“Any opinions, news, research, analyses, prices, other information, or links to third-party sites contained on this website are provided on an "as-is" basis, are intended only to be informative, is not an advice nor a recommendation, nor research, or a record of our trading prices, or an offer of, or solicitation for a transaction in any financial instrument and thus should not be treated as such. The information provided does not involve any specific investment objectives, financial situation and needs of any specific person who may receive it. Please be aware, that past performance is not a reliable indicator of future performance and/or results. Past Performance or Forward-looking scenarios based upon the reasonable beliefs of the third-party provider are not a guarantee of future performance. Actual results may differ materially from those anticipated in forward-looking or past performance statements. easyMarkets makes no representation or warranty and assumes no liability as to the accuracy or completeness of the information provided, nor any loss arising from any investment based on a recommendation, forecast or any information supplied by any third-party."

UNI done correcting or ready for another leg down?UNI dumped 39% after the bearish Supertrend Ninja - Clean signal on the 3th April (red vertical line on the background). The Supertrend Ninja - Clean gave 2 bullish signals in 2020 (with the biggest 1065%). In 2021 it gave 2 bullish signals, with 1 bullrun (33%). In 2022 it gave 1 bullish signal, with no follow up.
Whereas UNI corrected at least 22% - 66% after each bearish Supertrend Ninja signal (based on the last 4 signals).
Let's have a look at the other indicators. The Stoch RSI is in oversold levels, pointing downwards. K is below D, which is a bearish sign.
UNI is still in the Bearish Zone of the Ichimoku Cloud , which is bearish .
The RSI is almost in oversold area at 34 (40-60).
If we take a look at the Average Directional Index ( ADX DI) its bearish . The +DI (Green Line) is below the -DI (Red Line). While the Trend Strength is becoming stronger. Since the ADX (Orange Line) is above its 9 Period EMA (Black Line).
Currently UNI is also below its Bollinger Bands Middle, Band Basis 20 Period SMA and the Least Squares Moving Average ( LSMA ). Which are bearish signs. Going down here, the next support is at 5.85 USDT. Supports and Resistances are highlighted as grey blocks.
Conclusion: UNI moving sideways or going downwards. I'll wait patiently on a bullish Supertrend Ninja signal, before entering a long.
Thank you for reading.
Namasté 🙏
Disclaimer: Ideas are for entertainment purposes only. Not financial advice. Your own due diligence is highly advised before entering trades. Past performance is no guarantee of future returns.
What Indicators Do I Use:
In the chart I am using the "Supertrend Ninja - Clean", which is a trend-following indicator (Green and red vertical lines on the background). When the background of the candlestick closes green (vertical line). It indicates a possible bullish (up)trend. And red for downtrends.

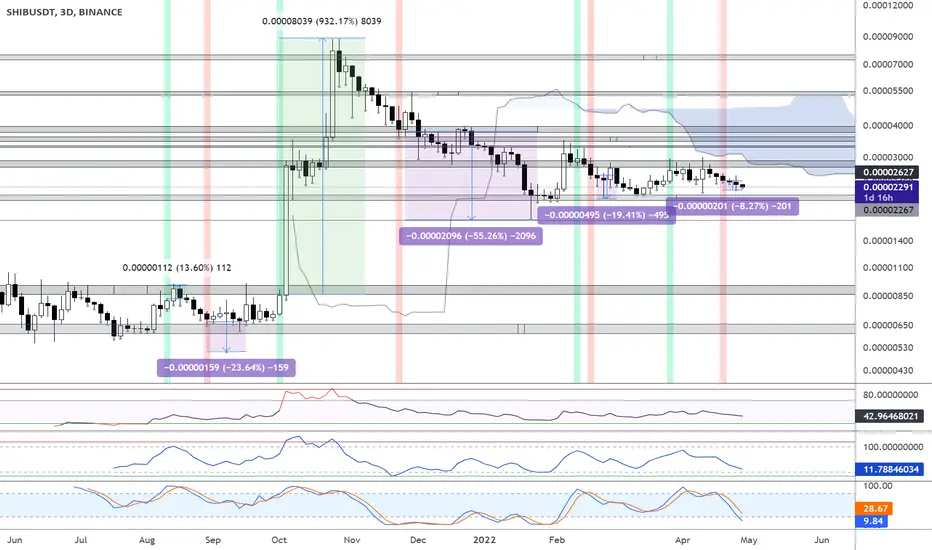
SHIB Analysis - still correcting since bullish 932% signal.SHIB going sideways for months now between 2106 and 2725.
SHIB corrected 8.27% after the latest Supertrend Ninja - Clean signal on the 19th Jan (red vertical line on the background). But in general SHIB has been in a correcting downwards trend for 6 months now. Since the bullish (green vertical line) of the Supertrend Ninja - Clean on 1 Oct 2021. Which made a whopping +932%. In less than 8 months the Supertrend Ninja gave 4 bearish signals, whereafter a correction followed.
Let's have a look at the other indicators. The Stoch RSI is in oversold levels, but it hasn't crossed up to the blue area yet. Also the price is below the Ichimoku cloud , which is bearish. The Constance Brown is in oversold area as well. The RSI is range bound (40-60).
Bouncing up here 2725 USDT is the next target. Dropping here 2106 USDT is the next target. 1694 USDT thereafter. The Supertrend Ninja - Clean hasn't given a bullish signal for the time being (green vertical line on the background). If SHIB does bounce up here, it would be making a higher low. Supports and Resistances are highlighted as grey blocks.
Thank you for reading.
Namasté 🙏
Disclaimer: Ideas are for entertainment purposes only. Not financial advice. Your own due diligence is highly advised before entering trades. Past performance is no guarantee of future returns.
What Indicators Do I Use:
In the chart I am using the "Supertrend Ninja - Clean", which is a trend-following indicator (Green and red vertical lines on the background). When the background of the candlestick closes green (vertical line). It indicates a possible bullish (up)trend. And red for downtrends.
BTC 8 hour analysis - What's next?The Supertrend Ninja - Clean signalled a bearish trend on the 4th of March. Price dumped 8.68% afterwards.
Currently price bounced on an orderblock at 37,137 USDT. The price is currently in the Ichimoku cloud , which means indecision. If we look a few days ahead, the cloud is green, which shows bullishness. Then again the the Conversion (blue) line made a bearish cross with the Base (red) line, which is a bearish signal. This supports the indecision theory. Price is currently finding resistance around 39,000-39,600. Volume is going down, which means an aggressive move is coming.
It's very possible that the price will go up from here. The best chance for BTC to break up is through twists of a bearish to bullish (or the other way around) cloud. You see this happened on 28th Febr at 9:00u. Where the price slipped through the twist of the clouds. It might happen now as well.
I see a bullish divergence on the Constance Brown RSI . RSI itself right now is in a bearish / range bound levels. Supports and Resistances are highlighted as grey blocks.
Breaking down here means we can go to 36,300 USDT. Claiming 39,600 USDT means 41,500 USDT is the next target.
Conclusion: It's wise to remain cautious at these price levels, if you're a trend trader.
Thank you for reading.
Namasté 🙏
Disclaimer: Ideas are for entertainment purposes only. Not financial advice. Your own due diligence is highly advised before entering trades. Past performance is no guarantee of future returns.

UPDATE: BTC analysis - What's next? Bull or Bear? BTC corrected 7.4% after the bearish Supertrend Ninja - Clean signal. Price got rejected at 44,800 USDT. Right around the heavy resistance of the VPVR.
Currently the BTC price is sitting on a weak support level, bouncing from 40,500 USDT support. Below the current price there isn't a lot of support from the VPVR.
Also the BTC price is below the kumo cloud. The conversion line (blue line) made a bearish cross with the base line (red line) as well. The lagging span (green line) is currently trading around the BTC price, which means it's undecided. Usually when the lagging span is below the price, it's a bearish signal.
Please note the conversion, base line and the lagging span on the daily level are all trading around the BTC price. Which means we are in at an important decision level.
The Stoch RSI is in oversold levels, but it hasn't crossed up to the blue area yet. The RSI isn't heavily oversold. Another drop here to 38,700 - 39,200 isn't impossible. Here we see a good support of the VPVR. Then we will probably see a bullish divergence on the RSI and the Constance Brown RSI.
For BTC to remain bullish on the short term, it needs to reclaim 41,700 USDT, but preferably 43,500 USDT. Which is a stronger support level.
Supports and Resistances are highlighted as grey blocks.
Thank you for reading.
Namasté 🙏
Disclaimer: Ideas are for entertainment purposes only. Not financial advice. Your own due diligence is highly advised before entering trades. Past performance is no guarantee of future returns.

BTC up almost 15% 47,000-48,000 USDT incoming? BTC pumped 14% after breaking out of the ichimoku cloud. Price is above the cloud, which is bullish. This is supported by the Supertrend Ninja clean (green vertical line). Also this was the area where the price moved to the upper part of the Bollingerband. RSI is above 70, this is where the gains usually are made.
The VPVR is showing heavier resistance around 47-48K. The bearish orderblock is around 46,600 USDT as well. RFight now the next (grey) resistance is around 45,500 USDT. the Constance Brown RSI is showing bearish divergence at this moment. The CCI is oversold as well. A retrace before another leg up, or sideways action before another leg up is likely.
Supports and Resistances are highlighted as grey blocks.
Thank you for reading.
Namasté 🙏
Disclaimer: Ideas are for entertainment purposes only. Not financial advice. Your own due diligence is highly advised before entering trades. Past performance is no guarantee of future returns.

JST pumps 45%, whats next?Small update:
JST pumped 45% after breaking out of the ichimoku cloud, and bullish signal of the Supertrend Ninja - Clean (green vertical line). It crushed several resistances. Currently RSI, Constance Brown RSI and the CCI are all over overbought. Taking positions right now is extremely dangerous and have an unfavorable risk to reward (R:R). I would expect a correction first before possible another leg up. Currently JST is on wave C.
Supports and Resistances are highlighted as grey blocks.
Thank you for reading.
Namasté 🙏
Disclaimer: Ideas are for entertainment purposes only. Not financial advice. Your own due diligence is highly advised before entering trades. Past performance is no guarantee of future returns.

Small update: Neo not done yet with the pump?Small update:
NEO is finding resistance from the (orange) orderblock on the 4 hour chart. A slight correction to 20.30 USDT, before resuming its C wave uptrend to 21.80 - 22.50 is very possible. Claiming 21 USDT is key. RSI and Constance RSI Brown are not showing any signs of bearish divergence just yet. Price broke out above the ichimoku cloud. The Supertrend Ninja Clean (green vertical line) is indicating the trend is still bullish. If RSI breaks 70, more action is likely. NEO doesn't care what BTC wants today.
Supports and Resistances are highlighted as grey blocks.
Thank you for reading.
Namasté 🙏
Disclaimer: Ideas are for entertainment purposes only. Not financial advice. Your own due diligence is highly advised before entering trades. Past performance is no guarantee of future returns.

BNB done correcting or ready for another leg down?BNB bounced from 340 USDT support level . Which was an oversold bounce. There ain't no trend reversal yet.
Currently BNB is sitting in a support block (grey block). Which is usually a bearish sign. It needs to hold here, or we gonna have a drop to 359 and thereafter 340 USDT. Before possibly making a bullish divergence . CCI is still oversold. Price is below the Ichimoku cloud which are bearish signs as well. I will evaluate once the monthly price closes.
Right now BNB is in a no trade zone for me. Another leg down or sideways chop is what I expect. Personally I don't try to buy bottoms, I prefer to see a strong bullish candle first. I will wait for the 'Supertrend Ninja - Clean' to give a bullish signal (green vertical background color). Before making any Long trades. Otherwise I prefer to wait the correction out. Currently the trend is still bearish (red vertical background color).
Supports and Resistances are highlighted as grey blocks. Profits can be taken at each level.
Thank you for reading.
Namasté 🙏
Disclaimer: Ideas are for entertainment purposes only. Not financial advice. Your own due diligence is highly advised before entering trades. Past performance is no guarantee of future returns.

FLUX/BTC Hourly Easy Trade 3.9 RRRBINANCE:FLUXBTC has broken above a long descending trend line on the hourly. Watch the video for the details of this easy trade. We are awaiting confirmation. The trade is not on yet. So keep watching this idea by giving me a follow. Also see my previous idea on Flux in Related Ideas below.
You can view this chart here .

CAKE profit 10% after 1h SHORT signal - more to come?Please Like or Follow if you enjoyed this content.
UPDATE: The price dropped 10% after Short signal. This trade was a piece of cake! Price is below Ichimoku cloud and RSI is still bearish. Then again RSI and CBrown is forming a bullish divergence. CCI is oversold. A bounce up is likely. However if price drops here another leg, next support is around 10.10 USDT.
This analysis is made with my "Supertrend Ninja - Clean". It displays only the last few signals. Which gives it a clean look. When the background of the candlestick closes green (vertical line). It indicates a possible bullish (up)trend. A red background indicates a possible bearish downtrend. Currently CAKE is still in a downtrend on the 1h chart.
Supports and Resistances are highlighted as grey blocks. Profits can be taken at each grey block. Supports and resistances are automatically drawn using my indicator "Yo Show Me Some Support - and Resistances". Pun intended.
Thank you for reading.
Namasté 🙏
What Indicators Do I Use:
In the chart I am using my "Supertrend Ninja - indicator", which is a trend-following indicator (Green and red vertical line with arrows). When the background of the candlestick closes green (vertical line) with an upwards pointing pink arrow. It indicates a possible bullish (up)trend.
"Supertrend Ninja - Clean", a cleaner version of "Supertrend Ninja - indicator", which only displays the last few signals.
With each trade proper risk management is essential. Either by using my script "Trailing Stoploss Bottom Activation indicator", visible as grey dots below the candles. Which sends an alert, when current price goes below the previous candle low. Or using my "HA Trailing Stoploss Activation", the indicator below with green and red blocks. Or third option, exit when the Supertrend Ninja indicator displays a vertical red line with a downwards pointing black arrow. Remember, the first stop(loss) is always the cheapest stop.
Disclaimer: Ideas are for entertainment purposes only. Not financial advice. Your own due diligence is highly advised before entering trades. Past performance is no guarantee of future returns.

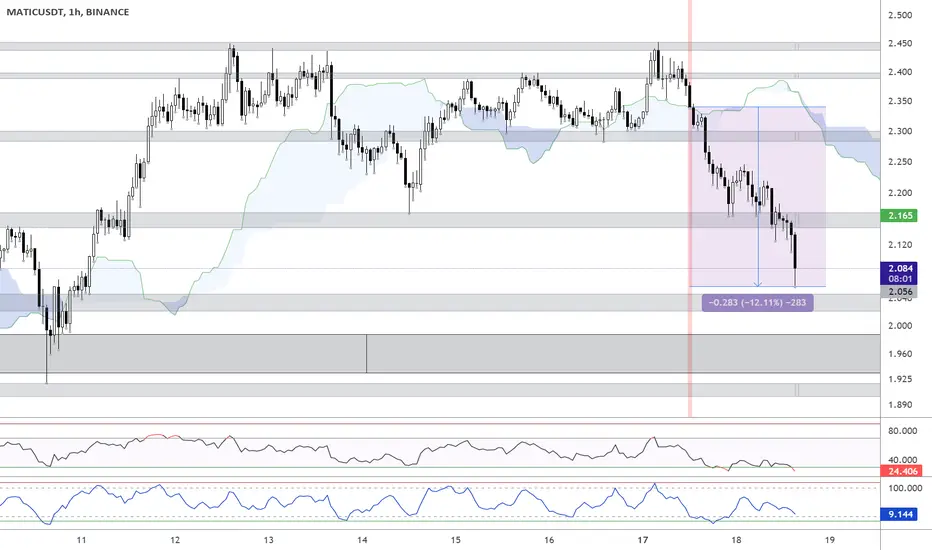
MATIC profit 12% after 1h SHORT signal - more to come?Please Like or Follow if you enjoyed this content.
UPDATE: The price dropped 12% after Short signal. Another easy trade. 2.045 is next support. Price is below Ichimoku cloud and RSI is still bearish. CBrown is bearish as well. Another drop is definitely possible.
This analysis is made with my "Supertrend Ninja - Clean". It displays only the last few signals. Which gives it a clean look. When the background of the candlestick closes green (vertical line). It indicates a possible bullish (up)trend. A red background indicates a possible bearish downtrend. Currently MATIC is still in a downtrend.
Supports and Resistances are highlighted as grey blocks. Profits can be taken at each grey block. Supports and resistances are automatically drawn using my indicator "Yo Show Me Some Support - and Resistances". Pun intended.
Thank you for reading.
Namasté 🙏
What Indicators Do I Use:
In the chart I am using my "Supertrend Ninja - indicator", which is a trend-following indicator (Green and red vertical line with arrows). When the background of the candlestick closes green (vertical line) with an upwards pointing pink arrow. It indicates a possible bullish (up)trend.
"Supertrend Ninja - Clean", a cleaner version of "Supertrend Ninja - indicator", which only displays the last few signals.
With each trade proper risk management is essential. Either by using my script "Trailing Stoploss Bottom Activation indicator", visible as grey dots below the candles. Which sends an alert, when current price goes below the previous candle low. Or using my "HA Trailing Stoploss Activation", the indicator below with green and red blocks. Or third option, exit when the Supertrend Ninja indicator displays a vertical red line with a downwards pointing black arrow. Remember, the first stop(loss) is always the cheapest stop.
Disclaimer: Ideas are for entertainment purposes only. Not financial advice. Your own due diligence is highly advised before entering trades. Past performance is no guarantee of future returns.
SHIB profit 10% after 4h SHORT signal - more to come?Please Like or Follow if you enjoyed this content.
UPDATE: The price dropped 10% after Short signal. Easy trade. Price is currently sitting on a OB. If support doesn't hold, 2639 is next support. Price is below Ichimoku cloud and RSI is still bearish. Another drop is definitely possible.
This analysis is made with my "Supertrend Ninja - Clean". It displays only the last few signals. Which gives it a clean look. When the background of the candlestick closes green (vertical line). It indicates a possible bullish (up)trend. A red background indicates a possible bearish downtrend. Currently SHIB is still in a downtrend.
Supports and Resistances are highlighted as grey blocks. Profits can be taken at each grey block. Supports and resistances are automatically drawn using my indicator "Yo Show Me Some Support - and Resistances". Pun intended.
Thank you for reading.
Namasté 🙏
What Indicators Do I Use:
In the chart I am using my "Supertrend Ninja - indicator", which is a trend-following indicator (Green and red vertical line with arrows). When the background of the candlestick closes green (vertical line) with an upwards pointing pink arrow. It indicates a possible bullish (up)trend.
And "Supertrend Ninja - Clean", a cleaner version of "Supertrend Ninja - indicator", which only displays the last few signals.
With each trade proper risk management is essential. Either by using my script "Trailing Stoploss Bottom Activation indicator", visible as grey dots below the candles. Which sends an alert, when current price goes below the previous candle low. Or using my "HA Trailing Stoploss Activation", the indicator below with green and red blocks. Or third option, exit when the Supertrend Ninja indicator displays a vertical red line with a downwards pointing black arrow. Remember, the first stop(loss) is always the cheapest stop.
Disclaimer: Ideas are for entertainment purposes only. Not financial advice. Your own due diligence is highly advised before entering trades. Past performance is no guarantee of future returns.

FTT profit 30% after 4h BULL signal - time to short? Please Like or Follow if you enjoyed this content.
UPDATE: The price pumped 30% after Bull signal. Currently on the verge of breaking support at 43.50 USDT. If support doesn't hold, 42 USDT is next support.
This analysis is made with my "Supertrend Ninja" indicator. When the background of the candlestick closes green (vertical line). It indicates a possible bullish (up)trend. A red background indicates a possible bearish downtrend. Currently FTT is still in a downtrend.
Supports and Resistances are highlighted as grey blocks. Profits can be taken at each grey block. Supports and resistances are automatically drawn using my indicator "Yo Show Me Some Support - and Resistances". Pun intended.
Thank you for reading.
Namasté 🙏
What Indicators Do I Use:
In the chart I am using my "Supertrend Ninja - indicator", which is a trend-following indicator (Green and red vertical line with arrows). When the background of the candlestick closes green (vertical line) with an upwards pointing pink arrow. It indicates a possible bullish (up)trend.
With each trade proper risk management is essential. Either by using my script "Trailing Stoploss Bottom Activation indicator", visible as grey dots below the candles. Which sends an alert, when current price goes below the previous candle low. Or using my "HA Trailing Stoploss Activation", the indicator below with green and red blocks. Or third option, exit when the Supertrend Ninja indicator displays a vertical red line with a downwards pointing black arrow. Remember, the first stop(loss) is always the cheapest stop.
Disclaimer: Ideas are for entertainment purposes only. Not financial advice. Your own due diligence is highly advised before entering trades. Past performance is no guarantee of future returns.

UPDATE: NEO profit 50% after SHORT signal - more to come?Please Like or Follow if you enjoyed this content.
UPDATE: The price dropped 50% after Short signal. Currently sitting in a support zone If support doesn't hold, 20.50 USDT is next support. Price is below Ichimoku cloud and RSI is still bearish. Another drop is definitely possible.
This analysis is made with my "Supertrend Ninja" indicator. When the background of the candlestick closes green (vertical line). It indicates a possible bullish (up)trend. A red background indicates a possible bearish downtrend. Currently NEO is still in a downtrend.
Supports and Resistances are highlighted as grey blocks. Profits can be taken at each grey block. Supports and resistances are automatically drawn using my indicator "Yo Show Me Some Support - and Resistances". Pun intended.
Thank you for reading.
Namasté 🙏
What Indicators Do I Use:
In the chart I am using my "Supertrend Ninja - indicator", which is a trend-following indicator (Green and red vertical line with arrows). When the background of the candlestick closes green (vertical line) with an upwards pointing pink arrow. It indicates a possible bullish (up)trend.
With each trade proper risk management is essential. Either by using my script "Trailing Stoploss Bottom Activation indicator", visible as grey dots below the candles. Which sends an alert, when current price goes below the previous candle low. Or using my "HA Trailing Stoploss Activation", the indicator below with green and red blocks. Or third option, exit when the Supertrend Ninja indicator displays a vertical red line with a downwards pointing black arrow. Remember, the first stop(loss) is always the cheapest stop.
Disclaimer: Ideas are for entertainment purposes only. Not financial advice. Your own due diligence is highly advised before entering trades. Past performance is no guarantee of future returns.

UPDATE: OMG UP 25% after 4h bull signal - Scalper Analysis 🚀Please Like or Follow if you enjoyed this content.
UPDATE: The price jumped 25% after bull signal. OMG broke resistance at 5.68. Now trying to break 6.5 USDT. Break it and pump to 7 USDT is next stop. Price is above Ichimoku cloud as well. Which is bullish.
This analysis is made with my "Supertrend Ninja - Clean". It displays only the last few signals. Which gives it a clean look. Currently OMG is in an uptrend. Remember you don't need to buy the bottom. You just need to ride a big part of the uptrend.
Supports and Resistances are highlighted as grey blocks. Profits can be taken at each grey block. Supports and resistances are automatically drawn using my indicator "Yo Show Me Some Support - and Resistances". Pun intended.
Thank you for reading.
Namasté 🙏
What Indicators Do I Use:
In the chart I am using my "Supertrend Ninja - indicator", which is a trend-following indicator (Green and red vertical line with arrows). When the background of the candlestick closes green (vertical line) with an upwards pointing pink arrow. It indicates a possible bullish (up)trend.
With each trade proper risk management is essential. Either by using my script "Trailing Stoploss Bottom Activation indicator", visible as grey dots below the candles. Which sends an alert, when current price goes below the previous candle low. Or using my "HA Trailing Stoploss Activation", the indicator below with green and red blocks. Or third option, exit when the Supertrend Ninja indicator displays a vertical red line with a downwards pointing black arrow. Remember, the first stop(loss) is always the cheapest stop.
Disclaimer: Ideas are for entertainment purposes only. Not financial advice. Your own due diligence is highly advised before entering trades. Past performance is no guarantee of future returns.

UPDATE: FTM UP 31% after 4h bull signal - Scalper Analysislease Like or Follow if you enjoyed this content.
UPDATE: The price jumped 31% after bull signal. FTM broke resistance at 2.45. Touching 3.15 USDT. Price is above Ichimoku cloud. Which is bullish.
This analysis is made with my "Supertrend Ninja - Clean". It displays only the last few signals. Which gives it a clean look. Currently FTM is in an uptrend. Remember you don't need to buy the bottom. You just need to ride a big part of the uptrend.
Supports and Resistances are highlighted as grey blocks. Profits can be taken at each grey block. Supports and resistances are automatically drawn using my indicator "Yo Show Me Some Support - and Resistances". Pun intended.
Thank you for reading.
Namasté 🙏
What Indicators Do I Use:
In the chart I am using my "Supertrend Ninja - indicator", which is a trend-following indicator (Green and red vertical line with arrows). When the background of the candlestick closes green (vertical line) with an upwards pointing pink arrow. It indicates a possible bullish (up)trend.
With each trade proper risk management is essential. Either by using my script "Trailing Stoploss Bottom Activation indicator", visible as grey dots below the candles. Which sends an alert, when current price goes below the previous candle low. Or using my "HA Trailing Stoploss Activation", the indicator below with green and red blocks. Or third option, exit when the Supertrend Ninja indicator displays a vertical red line with a downwards pointing black arrow. Remember, the first stop(loss) is always the cheapest stop.
Disclaimer: Ideas are for entertainment purposes only. Not financial advice. Your own due diligence is highly advised before entering trades. Past performance is no guarantee of future returns.

BEWARE OF STRONG BEARISH SIGNALS - S&P 500 - DAILYThank you for the like and comments, really appreciated! This is an idea not a financial advice.
__________________________________________________
The chart highlights every time when volumes and candlesticks signals a strong selling force but the chart went the other way around continuing to grow indefinitely following a safe 45 degrees angle.
The red line indicates a potential psychological level passed. It could be used as a probable level for a market return
