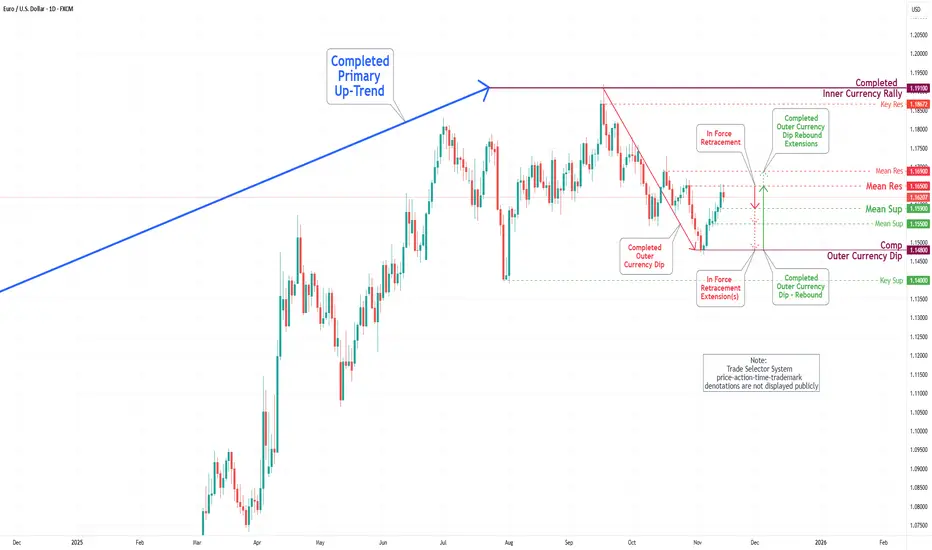
EUR/USD Daily Chart Analysis For Week of Jan 9, 2026Technical Analysis and Outlook:
In this week's trading session, the Euro market demonstrated substantial downward movement, followed by the elimination of the Mean Support levels at 1.171 and 1.168, thereby completing the Interim Inner Retracement at Mean Support 1.162, with the possibility of extending this down movement to Mean Support 1.159. However, present market conditions suggest an intermediate rebound is anticipated, targeting the Mean Resistance level at 1.168.
Ecb

Fundamental Note: EURUSD 07 Jan 2026EURUSD is trading around the 1.17 area as markets position for the first Non-Farm Payrolls release of 2026 on Friday, 9 Jan (Employment Situation for Dec 2025). This print matters more than usual because it’s the year’s first “reality check” on whether the late-2025 slowdown in hiring is turning into a softer trend (supporting more Fed cuts) or stabilizing (supporting USD via higher yields). Right now, consensus expectations lean toward a modest jobs gain in the mid-50k to ~60k range, with unemployment seen near 4.5% and wage growth watched closely for a rebound risk. In the short term, a weaker NFP and/or softer earnings would likely push US yields and the USD lower, giving EURUSD room to squeeze back toward recent highs; a hot wages surprise or upside payroll miss could quickly flip the move into a USD rebound. On the Euro side, easing inflation keeps the ECB comfortable in its “hold” stance, which reduces near-term EUR policy volatility versus the US data-driven repricing this week.
Bottom line: the market is mostly looking for a “soft-but-not-breaking” NFP that validates expectations for further Fed easing in 2026—any big deviation should produce an outsized EURUSD reaction.
🟢 Bullish factors:
1. NFP downside surprise or softer wages → lower US yields/USD.
2. Market still broadly positioned for additional Fed cuts in 2026.
3. ECB “on hold” narrative reduces euro-side policy shock risk near-term.
🔴 Bearish factors:
1. Strong NFP and/or hot wage growth → higher US yields, USD bid.
2. Risk-off flows (or renewed geopolitical stress) typically favor USD liquidity.
3. Euro inflation cooling can revive future ECB cut discussions if growth fades.
🎯 Expected targets: Volatile range into/through NFP. Base case (soft NFP): upside toward 1.1750–1.1820. Hawkish surprise (strong jobs/wages): pullback toward 1.1600–1.1550, with 1.1500 as the next downside area if the USD rally extends.

#EURUSD: Consolidation after the impulse2025 has been a strong year for the euro. On higher timeframes, a classic scenario unfolded: a false breakout of the long-term range and the psychological 1.05 level, followed by a powerful impulsive move that extended into early summer. Such price action points not to a random rally, but to a shift in the medium-term balance in favor of the euro.
At the moment, the instrument is in a consolidation phase. Technically, this does not look like a breakdown of the uptrend; rather, it appears to be a local correction after an extended move. Price remains above key medium-term support levels, the structure stays intact, but the impulse has temporarily faded.
From a technical perspective, the 1.165 area stands out as a key zone to monitor. If the corrective move continues, this level may act as the first area of meaningful market reaction. At the same time, premature countertrend entries remain unjustified, as the current phase does not favor aggressive trading.
From a scenario standpoint, the priority remains on waiting for:
— a pause in the correction,
— the formation of a consolidation range,
— the emergence of a confirmed structure for the next directional move.
From a macro perspective, the market continues to balance between expectations of potential Fed easing and the cautious stance of the ECB. This backdrop increases the likelihood of sideways price action and makes trading based on confirmed scenarios more reasonable than attempting to anticipate local extremes.

EUR/USD Daily Chart Analysis For Week of Jan 2, 2026Technical Analysis and Outlook:
In the New Year trading week, the Euro market exhibited a notable downward trend, followed by a brief upward trading momentum at the Mean Support level of 1.175.
Given the prevailing conditions in the currency market, a "dead cat" rebound is anticipated from the Mean Support level of 1.171, with a target price identified as the Mean Resistance level of 1.175.
Moreover, it is expected that steady to lower declining intermediate downward momentum will continue once the Mean Resistance level of 1.175 realigns with the anticipated market trajectory.

EUR/USD Daily Chart Analysis For Week of Dec 26, 2025Technical Analysis and Outlook:
In the trading session of this holiday week, the Euro market experienced an upward breakout, subsequently retesting the target of the Interim Inner Currency Rally at 1.180 and bypassing the Mean Resistance level at 1.175.
Following this retest, the euro experienced a rapid downward retreat, with the primary objective aiming at the Mean Support level at 1.175. It is important to note that this price point is the inverse of the preceding resistance level. At this juncture, we anticipate a substantial “dead cat” rebound from this support level, targeting a price objective at the Key Resistance level of 1.179.
Furthermore, some intermediate upward momentum may materialize within this downward trend before price levels realign with the anticipated trajectory.

EUR/USD Daily Chart Analysis For Week of Dec 19, 2025Technical Analysis and Outlook:
In this week’s trading session, the Euro market experienced an upside breakout, reaching the Interim Inner Currency Rally target at 1.178, having crossed the Mean Resistance level at 1.175. With this completion, current market conditions demonstrate a downward trend, with the primary objective being the Mean Support level at 1.163.
On the upside, we anticipate a healthy dead-cat rebound from the Mean Support at 1.163, aiming for the price zone around 1.169. It’s important to note that some intermediate upward momentum may occur within this downward trend before prices realign with the expected trajectory.

EUR/USD Daily Chart Analysis For Week of Dec 12, 2025Technical Analysis and Outlook:
During the most recent trading session, the Eurodollar currency rose sharply, reaching the Mean Resistance level at 1.175, via the Mean Resistance level of 1.167. Current market conditions indicate that the price may pull back to the critical Mean Support level at 1.169.
However, it is also crucial to monitor the breakout level for this currency to the upside by a rise to the Interim Inner Currency Rally 1.178 via Mean Resistance 1.175.
Conversely, on the downside, a major re-ignited retracement may occur from the completed Interim Inner Currency Rally 1.178, with the possibility of extending to the Mean Support 1.163.

EURUSD breaks higher: Fed-ECB path to drive 3rd wave to 1.19?EURUSD is trading above 1.17 on the 4-hour chart after the dollar fell to a 2-month low following Wednesday's Fed rate cut. With a potential running triangle breakout in play and a dovish Fed facing a stable ECB, the pair is eyeing the 2025 high at 1.1920 and potentially new peaks into 2026.
In this video, we break down why Powell's dovish tone and a deeply divided Fed are narrowing the rate differential with the ECB, which might upgrade growth and proceed with no cuts in 2026. Then, we map out the wave structure: a potential 3rd wave impulse targeting 1.18–1.19, with buy-the-dip zones at 1.17 and 1.1650, and larger projections toward 1.2020–1.2220 from a cup-and-handle pattern.
Key drivers
Fed cut and Powell dovish: The Fed cut rates on Wednesday, where Powell emphasised a "wait-and-see" mode, pretty much ruling out hikes in 2026; markets now price two more cuts despite the official dot plot projecting only one.
Deeply divided Fed: The December dot plot showed four members see no cuts in 2026, four see one, four see two, and three expect rates below 3% by year-end 2026, while three actually wanted to hike — No consensus.
ECB stability and growth upgrade: ECB President Lagarde said the eurozone economy shows "remarkable strength" and the ECB may upgrade growth forecasts at the December 18th meeting, with policy in a "good position" (i.e., no cuts).
Rate differential narrowing: The Fed is at 3.50–3.75% and cutting, the ECB is at 2.00% and on hold. Markets now price only a 45% chance of an ECB cut by September 2026, narrowing the spread in favour of the euro.
Technical structure : EURUSD has broken out of a running triangle with a breakout level around 1.1580–1.1600. The current leg appears to be a third-wave impulse targeting 1.18–1.19, with a larger cup-and-handle projection pointing to 1.2020–1.2220.
Trade plan : Buy pullbacks into 1.17 (50% Fibonacci retracement) or 1.1650 (deeper support) with a stop below 1.1580, targeting 1.18, 1.19, and potentially 1.20+; invalidation below 1.1580 would suggest a corrective structure instead.
Trading the EURUSD breakout? Share your entry levels and wave counts in the comments and follow for more Fed-ECB divergence and technical trade setups.
This content is not directed to residents of the EU or UK. Any opinions, news, research, analyses, prices or other information contained on this website is provided as general market commentary and does not constitute investment advice. ThinkMarkets will not accept liability for any loss or damage including, without limitation, to any loss of profit which may arise directly or indirectly from use of or reliance on such information.

EURJPY breakout: Buying dips into BOJ last hike?EURJPY has broken out of a triangle consolidation on the 4-hour chart and is retesting the 182 level as support. With Japan pumping fiscal stimulus into a shrinking economy and the BOJ nearing its cycle peak, the macro setup favours buying dips for a continuation higher.
In this video, we break down why the yen remains weak despite rising yields and an imminent BOJ hike, focusing on the toxic mix of fiscal slippage and soft growth. Then, we map out the technical buy zone between 181.60 and 180.70, targeting a final fifth-wave push toward 183.40 and 185.00.
Key drivers
Japan macro: A massive ¥21.3 trillion stimulus package into a contracting economy (Q3 GDP -2.3% annualised) has spiked yields on debt concerns rather than growth, weighing on the yen.
Central bank divergence: The BOJ is expected to hike next week but signal it's near the terminal rate ("one-and-done"), while the ECB holds at 2%.
Technical structure: We are in a continuation pattern (triangle breakout) that likely marks wave 4 of a larger sequence, implying one last impulse leg higher.
Key levels: Support at 181.60 (161.8% extension of the internal wave) and 180.70 (structural pivot). Upside targets at 183.40 (138.2% extension) and 184.29–185.00 (161.8% extension).
Trade plan: Look to buy dips into the 181.60–180.70 zone with a stop below the previous low, taking partial profits at 183.40 and 184.29, and trailing the rest for a potential extension.
Trading the yen cross breakout? Share your entry levels in the comments and follow for more macro-to-technical trade setups.
This content is not directed to residents of the EU or UK. Any opinions, news, research, analyses, prices or other information contained on this website is provided as general market commentary and does not constitute investment advice. ThinkMarkets will not accept liability for any loss or damage including, without limitation, to any loss of profit which may arise directly or indirectly from use of or reliance on such information.

EUR/USD Daily Chart Analysis For Week of Dec 5, 2025Technical Analysis and Outlook:
In the most recent trading session, the Eurodollar currency rose sharply, reaching the Mean Resistance level at 1.167. Current market conditions indicate that the price may pull back to the critical Mean Support level at 1.160.
It is also crucial to monitor the breakout levels for this currency. On the upside, there is potential for a rise to the Mean Resistance at 1.167 once again and possibly extending to 1.175. Conversely, on the downside, a breakout could take it to the Mean Support at 1.160, with the possibility of retesting the completed Outer Currency Dip at 1.148.

Euro rose on firmer ECB hold expectations and a weaker dollar
Eurozone inflation ticked up slightly, but remains within the ECB’s target range.
Eurozone Nov CPI rose to 2.2% YoY (prev. 2.1%, cons. 2.1%). Core CPI held at 2.4%, while services inflation edged up to 3.5%.
Meanwhile, German Central Bank President Nagel stressed that Eurozone inflation has reached the ECB’s target and is unlikely to deviate from current levels despite US tariffs.
EURUSD briefly retested EMA21 before rebounding above the 1.1640 level. Diverging bullish EMAs indicate a potential uptrend extension.
If EURUSD breaches above the resistance at 1.1670, the price may advance toward the next resistance at 1.1730.
Conversely, if EURUSD breaks below EMA21, the price could retreat toward the following support at 1.1580.

Is the EUR/JPY Rebound Real or a Bull Trap?
The EUR/JPY cross climbs near 180.70, but technical barriers and hawkish central banks cloud the horizon.
The EUR/JPY pair has snapped a three-day losing streak, gaining traction during the Asian session on Tuesday. Spot prices currently hover near the 180.70 area, marking a 0.10% intraday increase. The market found solid support near the psychological 180.00 mark, bouncing from a four-day low. Traders are now positioning themselves ahead of crucial Eurozone inflation data, which serves as the primary catalyst for this upward momentum.
Macroeconomic Drivers: The Inflation Paradox
Investors focus intensely on the upcoming Eurozone Harmonized Index of Consumer Prices (HICP) data. Forecasts suggest headline inflation rose 2.1% YoY in November, with core inflation edging up to 2.5%. While France and Spain showed cooling prices, Germany reported unexpectedly high inflation figures. This divergence reinforces the argument for a European Central Bank (ECB) policy hold. A pause in rate cuts acts as a significant tailwind for the Euro.
Geostrategy and Global Risk Sentiment
Geopolitical stability and market optimism currently undermine demand for traditional safe-haven assets like the Japanese Yen (JPY). A positive global risk tone encourages investors to seek higher yields, favoring the Euro over the Yen. Furthermore, global trade policy discussions are prompting capital flows into currencies backed by stable export economies. The Eurozone’s industrial adaptability positions it favorably in this environment, suppressing JPY strength despite potential interventions.
Leadership and Governance: The BoJ Stance
Bank of Japan (BoJ) Governor Kazuo Ueda recently delivered hawkish remarks regarding economic projections. He stated that the probability of meeting growth targets is rising. Concurrently, Finance Minister Satsuki Katayama sees no divergence between the government and the BoJ. However, the market has temporarily priced in these warnings. The immediate focus remains on the ECB’s reluctance to cut rates, which overpowers the BoJ’s normalization narrative in the short term.
Industry Trends and Innovation Economics
European currency strength draws support from resilient industrial sectors. High-tech manufacturing and advanced engineering firms in the Eurozone continue to drive wage growth. This economic activity contributes directly to the sticky services inflation observed in the region. Unlike Japan’s deflationary history, Europe’s innovation ecosystem maintains price pressures that prevent the ECB from adopting a dovish stance too quickly.
Technical Outlook and Support Levels
Technically, the pair faces immediate resistance at the 181.75 barrier.
A breach here could open the path toward 182.35. Conversely, failure to maintain momentum may trigger a slide back toward the 179.40 support level. Traders must monitor stochastic indicators, which signaled negativity yesterday but are now neutralizing. The market awaits the HICP release to confirm the next directional breakout.

EUR/USD Daily Chart Analysis For Week of Nov 28, 2025Technical Analysis and Outlook:
In the most recent trading session, the Eurodollar currency posted a significant upsurge, marked by substantial price movements that pushed it past the Mean Resistance levels at 1.155 and 1.159, respectively.
Current market analysis suggests that the price action is poised for a retest of the critical Mean Resistance at 1.163, with the possibility of extending towards the additional Mean Resistance at 1.169.
Moreover, it is essential to monitor the breakout thresholds for this currency, with particular attention to the Mean Resistance of 1.163 on the upside and the Mean Support at 1.151 on the downside. There is also a potential scenario in which the price action may retest the Outer Currency Dip at 1.148, with the likelihood of a further extension to the subsequent Outer Currency Dip at 1.139.

EUR/USD Daily Chart Analysis For Week of Nov 21, 2025Technical Analysis and Outlook:
In the last trading session, the Eurodollar currency showed a notable decline, characterized by consequential price movement as it passed through the Mean Support at 1.159 and 1.155. However, there is an expectation of a potential rebound toward the target Mean Support level at 1.155.
Present market analysis suggests that the price action is poised for a retest of the critical target, the Outer Currency Dip at 1.148, with the case of an extension to the next Outer Currency Dip at 1.139. Furthermore, it is imperative to monitor the breakout thresholds for the currency, specifically focusing on these two essential levels: the Mean Resistance at 1.155 and the Outer Currency Dip at 1.148.

Could ongoing Fed rate-cut expectations keep boosting the euro?
Dollar weakness driven by Fed rate-cut expectations and a softening US labor market has supported the euro’s appreciation. However, views within the ECB on further easing remain divided.
Croatian National Bank Governor Vujčić noted that inflation risks in the Eurozone are broadly balanced and growth is strengthening more than expected, implying that additional rate cuts are unlikely in the near term.
On the other hand, ECB Rehn warned that persistent declines in energy prices and ongoing economic risks could push inflation below the 2% target.
EURUSD continues to trend higher within the ascending channel, forming higher lows. The price remains above the diverging bullish EMAs, indicating a potential extension of bullish momentum.
If EURUSD holds above EMA21 and within the ascending channel, the price may advance toward the resistance at 1.1670.
Conversely, if EURUSD breaks below EMA21 and the channel’s lower bound, the price could retreat toward the support at 1.1580.

EUR/USD Daily Chart Analysis For Week of Nov 14, 2025Technical Analysis and Outlook:
In the most recent trading session, the Eurodollar market exhibited a notable rise, characterized by significant movements targeting key price levels, specifically Mean Resistance at 1.159 and 1.165. Initially, the prices experienced a gradual increase, followed by a sharp escalation, ultimately reaching the critical Mean Resistance level of 1.165, which currently serves as the trading point for the currency.
Current market analysis suggests a modest expectation of a potential further increase in prices toward the target Mean Support level at 1.169. Additionally, there is a cautious outlook that downward movement may result in a subsequent retest of the Outer Currency Dip at 1.148 in the near future. Moreover, it is essential to monitor the breakout thresholds for the currency, with particular emphasis on the two primary levels: Mean Resistance at 1.165 and Mean Support at 1.159.
EUR/USD Daily Chart Analysis For Week of Nov 7, 2025Technical Analysis and Outlook:
During the most recent trading session, the Eurodollar market demonstrated considerable volatility, characterized by both significant downward and upward movements. The initial decline caused prices to decrease sharply, reaching and passing the Inner Currency Dip at 1.151, subsequently followed by a vigorous rebound that resulted in a retest of the Mean Resistance level at 1.159.
Current market analysis suggests that the prevailing sentiment is inclined toward a downward trajectory, with prices likely to target the Mean Support level at 1.153. There is a watchful expectation that this movement may lead to a subsequent retest of the Outer Currency Dip at 1.148. Furthermore, it is imperative to monitor the breakout thresholds for the currency, focusing on the two principal handles: Mean Resistance at 1.159 and Mean Support at 1.153.

Is the Pound's Decline Irreversible Before BoE?The recent surge in the EUR/GBP cross above the $\mathbf{0.8750}$ threshold is fundamentally rooted in a significant monetary policy divergence between the UK and the Eurozone. The key driver is the heightened uncertainty surrounding the Bank of England's ( BoE ) Thursday rate decision. Following softer UK inflation and wage data, analysts have begun pricing in a material probability of an impending rate cut, generating substantial dovish speculation. This expectation inherently depreciates the British Pound ( GBP ), creating a powerful interest rate differential against the Euro. Conversely, the European Central Bank ( ECB ) maintains a firm policy pause, with President Christine Lagarde expressing confidence in the Eurozone's outlook, reinforcing the Euro's stability and momentum.
While macroeconomic policy dictates the current upward trajectory of EUR/GBP, subtle but material geopolitical headwinds threaten the Euro's stability. Political turmoil in France, specifically the government's struggle following the rejection of a key finance measure, raises the specter of snap elections and governmental paralysis. Such internal political risk within the Eurozone's second-largest economy undermines investor confidence and poses a downside risk to the Euro's valuation, counteracting the macroeconomic tailwinds. Furthermore, long-term structural health of both currencies is tied to competitive advantages in high-tech sectors, FinTech, and life sciences, where patent analysis * and robust cyber infrastructure are crucial for attracting foreign direct investment.
The immediate market outlook hinges almost entirely on the forthcoming BoE announcement and the subsequent commentary from Governor Andrew Bailey. An unexpectedly dovish stance would confirm market expectations, severely weaken the GBP, and likely cement a sustained move by EUR/GBP toward the $0.8800$ mark. This movement predominantly reflects a GBP weakness narrative rather than overwhelming EUR strength. Traders must recognize that while the current momentum favors the Euro, any escalation of the French political crisis into a threat to wider EU fiscal cohesion could rapidly reverse the pair's upward trend. Close monitoring of this dual risk profile is paramount.

EUR/USD Daily Chart Analysis For Week of Oct 31, 2025Technical Analysis and Outlook:
In the most recent trading session, the Eurodollar market exhibited substantial downward movement, declining significantly from the critical Mean Resistance level of 1.165. The market penetrated two weakened Mean Support levels, 1.159 and 1.155, ultimately stabilizing just above the Inner Currency Dip at 1.151.
The current market assessment suggests that the prevailing progressive trend is likely to persist toward the initial Inner Currency Dip at 1.151, with the expectation of eventually reaching the Outer Currency Dip at 1.145. Nevertheless, the active Inner Trading Zone is expected to remain highly dynamic until the currency achieves these two specified targets. Furthermore, it is essential to remain cognizant of the rebound thresholds for the currency, within the two principal outputs.

GER40 at a Crossroads: Parabolic Breakout or Exhaustion Top? 🇩🇪 GER40 DAX INDEX | Premium Technical Analysis & Trading Blueprint | 23,967.9 🇩🇪
📊 INSTITUTIONAL MULTI-TIMEFRAME MASTERCLASS | NOVEMBER 3-7, 2025 FORECAST 📊
Current Level: 23,967.9 | Analysis Date: November 1, 2025, 00:54 UTC+4
Hey, TradingView fam! 👋 The German powerhouse, GER40, has put on a spectacular show, closing the week at a mighty 23,967.9 . After such a vertical ascent, traders are rightfully asking: Is this the start of a new parabolic phase, or are we witnessing a massive exhaustion top in the making? The upcoming week, from November 3rd to 7th, is poised to give us the answer.
Let's dissect the charts across multiple timeframes, combining timeless theories with key indicators to map out the strategic path forward for both intraday and swing traders. 🧭
╔═══════════════════════════════════════════════════════════════════╗
🎯 STRATEGIC MARKET INTELLIGENCE OVERVIEW
The German DAX Index commands attention at 23,967.9 , positioning at a pivotal technical crossroads that will define European equity direction through Q4 2025. Our sophisticated multi-dimensional analysis reveals cautious optimism with breakout potential as the index tests critical resistance near the psychological 24,000 barrier. This week's confluence of ECB policy implications, US election spillover, and technical setups creates exceptional risk-reward opportunities for prepared traders.
Institutional Support Architecture: 🛡️
Immediate Foundation: 23,900 - 23,920 (Algo bid zone)
Secondary Cushion: 23,850 - 23,870 (Volume-weighted support)
Critical Platform: 23,750 - 23,780 (Weekly pivot cluster)
Major Fortress: 23,650 - 23,680 (Psychological & structural)
Resistance Target Matrix: 🎯
First Hurdle: 24,000 - 24,020 (Psychological barrier)
Secondary Wall: 24,100 - 24,120 (Pattern objective)
Breakout Zone: 24,200 - 24,250 (Extension target)
Major Milestone: 24,350 - 24,400 (Monthly target)
╚═══════════════════════════════════════════════════════════════════╝
📈 WEEKLY TIMEFRAME (1W) - MACRO STRUCTURAL ANALYSIS
Elliott Wave Supercycle Mapping: 🌊
Currently navigating Wave 4 consolidation within larger Wave (5) of the supercycle advance. The shallow retracement (38.2% Fibonacci) suggests underlying strength with Wave 5 targeting 24,500-24,800 . Alternative count places us in Wave B of corrective ABC - monitor 23,650 for bearish confirmation.
Primary Scenario: Wave 4 complete, Wave 5 underway to 24,500+
Alternative: Wave B top forming, Wave C decline to 23,200
Invalidation Level: Weekly close below 23,500
Time Projection: Completion by mid-November
Wyckoff Distribution/Re-Accumulation: 📚
Critical Juncture - Phase B/C Transition
- Preliminary Supply (PSY): 24,100 tested
- Buying Climax (BC): 24,150 rejection
- Automatic Reaction (AR): 23,750 held
- Secondary Test (ST): Current 23,967
- Upthrust pending: Above 24,000
Ichimoku Cloud European Perspective: ☁️
Tenkan-sen: 23,885 (9-period support)
Kijun-sen: 23,820 (26-period base)
Senkou Span A: 23,950 (cloud resistance)
Senkou Span B: 23,780 (cloud support)
Chikou Span: Neutral (at price level)
Cloud Status: Thin, potential twist ahead
Advanced Harmonic Configuration: 🦋
Emerging Bullish Shark pattern with precision measurements:
- 0 Point: 23,450 (October low)
- X Point: 24,150 (October high)
- A Point: 23,650 (retracement low)
- B Point: 23,967 (current - 0.618 XA)
- C Target: 23,750 (1.13 AB extension)
- D Completion: 24,350 (0.886 XC)
Gann Master Analysis: 📐
Price respecting 3x1 Gann angle from September base. Critical Gann levels:
- Current angle support: 23,920
- 45-degree resistance: 24,050
- Square of 9 target: 24,144
- Time cycle: November 6 (+/- 1 day)
╔═══════════════════════════════════════════════════════════════════╗
📊 DAILY TIMEFRAME (1D) - SWING TRADING COMMAND
Japanese Candlestick Intelligence: 🕯️
Yesterday's Hanging Man at resistance warns of potential reversal. Critical observation for today:
- Close above 24,000 = Bullish Engulfing invalidates reversal
- Close below 23,900 = Bearish Confirmation
- Doji formation = Continued indecision
Master Pattern Recognition:
Ascending Triangle approaching apex:
- Horizontal resistance: 24,000-24,020
- Rising support: Currently at 23,880
- Breakout target: 24,320 (320-point measured move)
- Volume requirement: 30% above 20-day average
- False breakout risk: High due to round number
Bollinger Bands Configuration: 📈
Upper Band: 24,015 (kissing price)
Middle Band (20-SMA): 23,870 (dynamic support)
Lower Band: 23,725 (oversold boundary)
Band Width: Contracting (squeeze alert)
%B Reading: 0.89 (upper band test)
RSI Momentum Analysis:
Daily RSI: 64 (approaching overbought)
Bearish divergence forming vs price highs
Support trend line: 55 level
Resistance: 70 level (6 points away)
Volume Profile Insights: 📊
- High Volume Node: 23,850-23,900
- Point of Control: 23,875
- Value Area High: 23,950
- Value Area Low: 23,800
- Low Volume Gap: 24,020-24,080 (breakout zone)
╚═══════════════════════════════════════════════════════════════════╝
⚡ 4-HOUR TIMEFRAME (4H) - TACTICAL FRAMEWORK
Dow Theory Application: ✅
Primary Trend: Bullish (higher highs maintained)
Secondary Trend: Consolidation/Distribution question
Minor Trend: Testing resistance
Volume Pattern: Declining on rallies (caution)
Confirmation needed: Break above 24,020
DAX/STOXX correlation: Diverging (warning)
Moving Average Configuration:
EMA 8: 23,945 (micro support)
EMA 21: 23,915 (short-term support)
EMA 50: 23,880 (medium support)
SMA 100: 23,825 (strong support)
SMA 200: 23,750 (major trend support)
Golden Cross: EMA 50 above SMA 100 ✅
Chart Pattern Alert: 🚨
Rising Wedge formation - bearish implications:
- Upper trendline: 23,980-24,000
- Lower trendline: 23,850-23,870
- Breakdown target: 23,700
- Invalidation: Close above 24,020
╔═══════════════════════════════════════════════════════════════════╗
🎪 1-HOUR TIMEFRAME (1H) - PRECISION ENTRY MATRIX
Micro Pattern Development: 🔬
Triple Top formation at 23,980:
- First top: 23,975 (Monday)
- Second top: 23,982 (Wednesday)
- Third top: 23,978 (Friday)
- Neckline support: 23,920
- Breakdown target: 23,860
VWAP Trading Framework:
Daily VWAP: 23,952
Weekly VWAP: 23,895
Monthly VWAP: 23,810
Upper Band 1: 23,985 (resistance)
Upper Band 2: 24,018 (strong resistance)
Lower Band 1: 23,919 (support)
Lower Band 2: 23,886 (strong support)
Support & Resistance Precision:
R4: 24,050 (Major resistance)
R3: 24,020 (Round number)
R2: 23,990 (Pattern resistance)
R1: 23,975 (Immediate ceiling)
PIVOT: 23,967.9 (Current)
S1: 23,950 (Micro support)
S2: 23,920 (Neckline)
S3: 23,890 (Strong support)
╚═══════════════════════════════════════════════════════════════════╝
⚡ 30-MINUTE SCALPING LABORATORY (30M)
Microstructure Dynamics: 🎯
Range-bound channel :
- Upper boundary: 23,975-23,985
- Middle pivot: 23,950-23,955
- Lower boundary: 23,925-23,935
- Breakout pending: 70% probability upward
European Session Dynamics: 🕐
Frankfurt Open (08:00 CET):
- Average range: 40-50 points
- Directional bias: First 30 minutes
London Overlap (09:00 GMT):
- Volatility spike: 60-80 points
- Best scalping window
US Premarket Impact (13:30 CET):
- Range expansion: 80-100 points
Scalping Execution Zones:
Buy Zones:
• Zone A: 23,945-23,950 (VWAP test)
• Zone B: 23,925-23,930 (Channel bottom)
• Zone C: 23,900-23,905 (Strong bid)
Sell Zones:
• Zone A: 23,975-23,980 (Triple top)
• Zone B: 23,990-23,995 (Resistance cluster)
• Zone C: 24,010-24,015 (Major resistance)
╔═══════════════════════════════════════════════════════════════════╗
🏃 15-MINUTE & 5-MINUTE ULTRA-SCALPING
15-Minute Momentum Setup: ⚡
Bull Flag micro pattern:
- Pole: 23,920 to 23,970 (50 points)
- Flag: 23,955-23,965 consolidation
- Breakout trigger: 23,968
- Quick target: 24,000 (+32 points)
- Stop: 23,950 (-18 points)
5-Minute Algorithm Signals:
Long Conditions:
RSI(5) oversold (<25) + VWAP bounce = BUY
MACD bullish cross + Volume spike = BUY
EMA(8) > EMA(21) + Pullback = BUY
Short Conditions:
RSI(5) overbought (>75) + Resistance = SELL
MACD bearish cross + High volume = SELL
Failed breakout at 24,000 = SELL
Management:
TP: 15-20 points | SL: 10-12 points
Max hold: 10 minutes | Trail: 8 points
╚═══════════════════════════════════════════════════════════════════╝
📅 WEEKLY STRATEGIC PLAYBOOK (NOVEMBER 3-7, 2025)
Monday, November 3: 🚀
Gap-up potential to 24,000 test
Strategy: Sell resistance, buy 23,920 dips
Key levels: 23,920 support, 24,000 resistance
Expected range: 80 points
Tuesday, November 4: 🗳️
US Election volatility spillover to DAX
Strategy: Wide stops, reduced size
Potential range: 23,750-24,100 (350 points!)
Correlation with US futures critical
Wednesday, November 5: 💥
Post-election directional resolution
Strategy: Trade breakout with conviction
Bullish above 24,050 → Target 24,200
Bearish below 23,850 → Target 23,700
Thursday, November 6: 📊
ECB officials speaking + German data
Strategy: Fade initial moves
Expected consolidation: 23,900-24,000
Focus on European session
Friday, November 7: 🎯
Weekly close crucial for next week's bias
Strategy: Position for weekly close
Above 24,000 = Bullish continuation
Below 23,900 = Bearish reversal
╔═══════════════════════════════════════════════════════════════════╗
⚖️ PROFESSIONAL RISK MANAGEMENT SYSTEM
Intraday Risk Parameters: 🛡️
Position size: 0.5-1% account risk
Risk-Reward: Minimum 1:2, target 1:3
Daily stop: -2% maximum loss
Consecutive losses: 3 max, then pause
Profit protection: Trail at 60% gain
Breakeven: Move stop at +15 points
Correlation monitor: Watch US futures
Swing Position Framework: 💼
Core position: 40% at 23,900-23,920
Scale-in: 30% at 23,850, 30% at 23,800
Stop loss: Below 23,750 (all positions)
Target 1: 24,050 (25% exit)
Target 2: 24,150 (35% exit)
Target 3: 24,250 (25% exit)
Runner: 24,350+ (15% hold)
╚═══════════════════════════════════════════════════════════════════╝
🔴 RISK SCENARIOS & CONTINGENCIES
Bearish Triggers: 🐻
30-min close below 23,950 = Micro caution
Hourly close below 23,920 = Intraday bearish
4H close below 23,880 = Swing bearish
Daily close below 23,800 = Trend concern
Weekly close below 23,650 = Major reversal
European Risk Factors: 🦢
• ECB policy surprises (100+ point moves)
• German economic data shocks
• EU political developments
• Energy crisis escalation
• Banking sector concerns
╔═══════════════════════════════════════════════════════════════════╗
💎 ELITE CONFLUENCE TRADING ZONES
Optimal Buy Zone: ✅
23,880-23,920
(Multi-timeframe support + Fibonacci 61.8% + VWAP + Moving averages)
Premium Sell Zone: ❌
23,990-24,020
(Triple top + Round number + Bollinger Band + Wedge resistance)
Breakout Trigger: 🚀
24,020-24,050
(Pattern completion + Resistance break + Volume confirmation)
╚═══════════════════════════════════════════════════════════════════╝
🏆 MASTER TRADER'S VERDICT
The DAX at 23,967.9 stands at a critical inflection point with the psychological 24,000 level acting as the decisive battleground. Technical indicators suggest cautious bullish bias but with increasing distribution signals. The week ahead demands disciplined execution and nimble position management.
Top 3 High-Probability Setups: 🎯
Range Trade: Buy 23,900, Sell 23,980 (Multiple touches)
Breakout Long: Above 24,020 → Target 24,150 (Clear skies)
Reversal Short: Triple top failure at 23,980 → Target 23,850
Trading Wisdom: 🧠
The DAX rewards patience at extremes. Trade the range until proven otherwise. Respect the 24,000 psychological level.
"The European markets dance to their own rhythm - master the tempo, profit from the moves!" 💶
╔═══════════════════════════════════════════════════════════════════╗
📍 ACTIONABLE INTELLIGENCE BRIEFING
Range-bound action between 23,850-24,020 until catalyst emerges. US election spillover likely to provide directional resolution. Accumulate dips toward 23,900 for upside potential to 24,200+.
Trade European hours. Respect correlations. Profit consistently. 💰
╚═══════════════════════════════════════════════════════════════════╝
#DAX #GER40 #DAX40 #TechnicalAnalysis #Trading #EuropeanMarkets #Indices #DayTrading #SwingTrading #ElliottWave #Wyckoff #HarmonicPatterns #ECB #Frankfurt #GermanStocks #STOXX #EuropeTrading #TradingView #MarketAnalysis #Forex #MarketForecast
🔔 Follow for Premium European Market Analysis | Präzision • Disziplin • Profit 📊
Risk Notice: Trading carries significant risk of loss. This analysis is educational only. Past performance does not predict future results. Conduct your own research and apply proper risk management.

EURGBP tests 0.88 as UK Budget crisis deepens: Where next?The dollar crushed all majors yesterday, but EURGBP tells a different story. The euro is surging against the pound as UK fiscal chaos and bets on a BOE rate cut accelerate. With an ascending triangle breakout confirmed, traders are targeting 0.89 and the psychological 0.90 handle.
The Office for Budget Responsibility just revealed a £20 billion fiscal hole, forcing Chancellor Reeves to make tough choices in November's budget. Meanwhile, markets price 68% odds of a December BOE rate cut as inflation cools—two mega catalysts for GBP weakness.
Key drivers
UK fiscal crisis: £20 billion productivity forecast slash ahead of November 26 budget forces austerity measures, crushing pound confidence
BOE rate cuts priced In: 68% December cut odds versus 30% November (food prices down 0.4% month-on-month, retail deflation for first time since March)
Technical breakout: Ascending triangle break above 0.8800 opens clean path to 0.89 and 0.90; golden 61.8% Fibonacci sits at 0.8872 as magnet level
Wedge pattern risk: Multiple Fibonacci clusters (0.89, 0.8876, 0.90) confirm upside targets, but final wave of rising wedge warns of sharp retracement after targets hit
How to trade EURGBP?
Long above 0.8775, target 0.8872 (golden Fib magnet) then 0.89-0.90. Stop below 0.8750. Watch BOE communications and November 26 budget details for confirmation. UK in crisis mode—don't fade the breakdown.
This content is not directed to residents of the EU or UK. Any opinions, news, research, analyses, prices or other information contained on this website is provided as general market commentary and does not constitute investment advice. ThinkMarkets will not accept liability for any loss or damage including, without limitation, to any loss of profit which may arise directly or indirectly from use of or reliance on such information.

$EUINTR -ECB Holds Rate at 2.15% (October/2025)ECONOMICS:EUINTR 2.15%
October/2025
source: European Central Bank
- The ECB kept interest rates unchanged for the 3rd meeting,
reflecting confidence in the eurozone’s economic resilience and continued easing of inflationary pressures.
In her remarks after the meeting, ECB President Lagarde emphasized that the ECB is “in a good place” and remains committed to taking all necessary actions to preserve that stability.

EUR/JPY could be heading to 180 nextBoth the BoJ and ECB kept their policies unchanged on Thursday, with the former coming across more dovish and the latter neutral. The USD/JPY surged to near 154.50, reaching its best level since February. The EUR/JPY meanwhile broke to a new high for the year and is now on the verge of extending those gains to 180.00. Can it get there?
Well I wouldn't bet against it. We had stronger Eurozone GDP data today which underscored the ECB's "good place" rhetoric.
“From a monetary-policy point of view, we are in a good place,” President Christine Lagarde said at the ECB presser. “Is it a fixed good place? No, but we will do whatever is needed to make sure that we stay in a good place.”
Key levels are shown on the chart, but the long and short of it is this: the path of least resistance remains to the upside.
By Fawad Razaqzada, market analyst with FOREX.com
