Bitcoin at a Historic Turning Point
This weekly chart just revealed something massive — something most traders completely miss until it’s too late.
Bitcoin has now dropped into one of the highest-probability demand zones of the entire macro structure:
📍 High Probability Zone: $74,420 – $88,800
Why does this zone matter?
Because this exact range is where Bitcoin previously:
✔️ Formed a major Higher Low (HL)
✔️ Generated the momentum that launched the last All-Time High ($126,296)
✔️ Swept liquidity at $74,420 — a textbook macro cleanup
✔️ Created the foundation of the entire bullish cycle
This isn’t just a “support level.”
This is where the market made its last major decision about the direction of the bull market.
⸻
The 3 Macro Scenarios (Clear, Simple, Realistic):
1️⃣ Bearish Continuation
If the current weekly candle closes below $85,980, sellers can attempt to push deeper into the zone — potentially retesting the sweep at $74,420.
2️⃣ Bullish Reversal
A strong weekly reaction from inside this demand block can form the next Higher Low (HL) on the monthly structure — the exact signal that created the previous ATH.
3️⃣ Range Formation
If volatility compresses here, BTC may build a macro accumulation range inside $74,420–$88,800 before choosing a direction.
And the winner — buyers or sellers — is revealed ONLY after a clean break of the range, not before.
⸻
🔍 Final Word
This zone is not noise — it’s a macro decision point where market structure, liquidity, and trend all converge.
Whether this becomes the beginning of a deeper correction or the birth of the next ATH…
This is where the story will be written.
NFA.
COINBASE:BTCUSD
Economic Cycles

LTCUSDT : Full analysisHello friends
well you see that the power is in the hands of the sellers and we must have sufficient approvals to buy.
So you see, we have two important support areas that we have identified for you with Fibonacci, and they can be good supports. We need to see how buyers react in these areas.
Well, the next point is that despite the sharp drop in Bitcoin, Litecoin did not fall much. It fell by almost half of Bitcoin. Considering the previous times I saw that when Bitcoin fell, other currencies fell several times as much, and this is a good sign (meaning that its holders have a positive view of the currency).
But to buy, we need to know where and when to buy, to find the best point to buy and to take our profits at the best point. For this reason, we expect that Litecoin will most likely bottom out again and buy in support areas with risk and capital management and in steps And to move with the specified goals.
*Trade safely with us*

USOIL:LIVE TRADEHello friends
you can see that we had a decline and the sellers were in power until the support was determined with Fibonacci, where buyers entered and were able to support the price.
Now, with Fibonacci, we have determined a resistance area for buyers that can move up to there, but considering the main trend, which is negative, the price increase is an opportunity for a sell trade.
Don't forget risk and capital management.
*Trade safely with us*

It Needs a Correction in 6MMy annotations are very simple, and they speak for themselves. The market is over-extended in 6M temporality and needs a correction, the first red candle in 6M in a long time is confirming this.

First major target for FET - $1.87 - rebuy around .60 centsFET has re-done a bear market bottoming pattern again, and everyone is scared by BTC flashing bear market signals currently.
Even if BTC is going into a bear market, there will be a nice bear market counter-trend rally coming very soon most likely. I do think that altcoins will finish a bull market during that at the very least. We should have a nice solid 2 months of bullish price action for altcoins.
So, in each of its bull markets so far, FET has went straight to the .786 from its previous ATH off of its bear market bottom. This currently sits around $1.87.
Then, if we do continue to get a bull market for altcoins at least - FET will do a .50 fib retrace off of the move from the bottom to the .786, which will land it around .60 cents. I will be risking some of my profits there if this works out as planned within this idea.
I will talk about the full blown bull market targets in another idea once we get more date in the next couple of months.
Thank you!

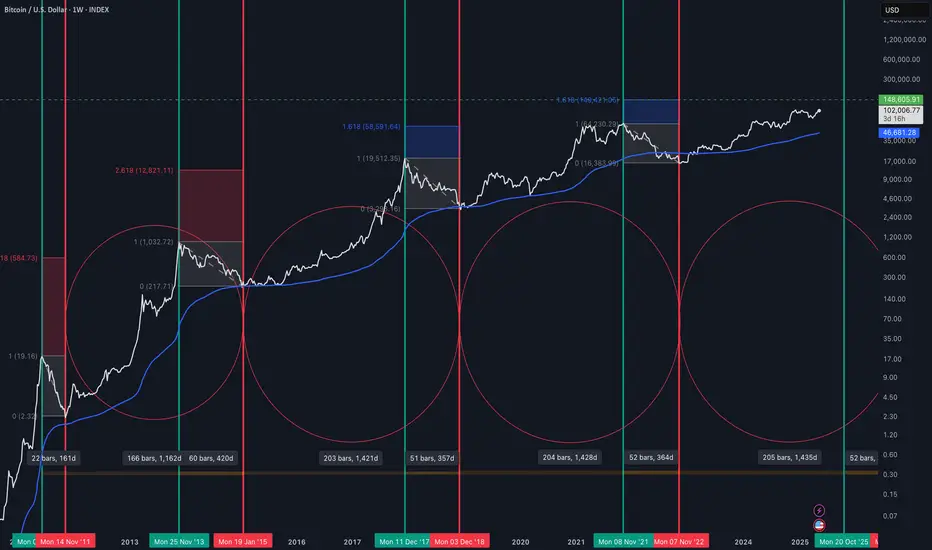
Bitcoin SeasonalitySince 2013, the distance between each Bitcoin bottom and peak is approximately 205 weeks. Similarly, the distance between the peak and the bottom is approximately 52 weeks. In addition, when the Fibonacci correction is applied to each bear season, the new target appears to be the 1.618 region, so Bitcoin currently has the potential to run to 148k. As long as seasonality continues, the peak will come at the end of 2025.
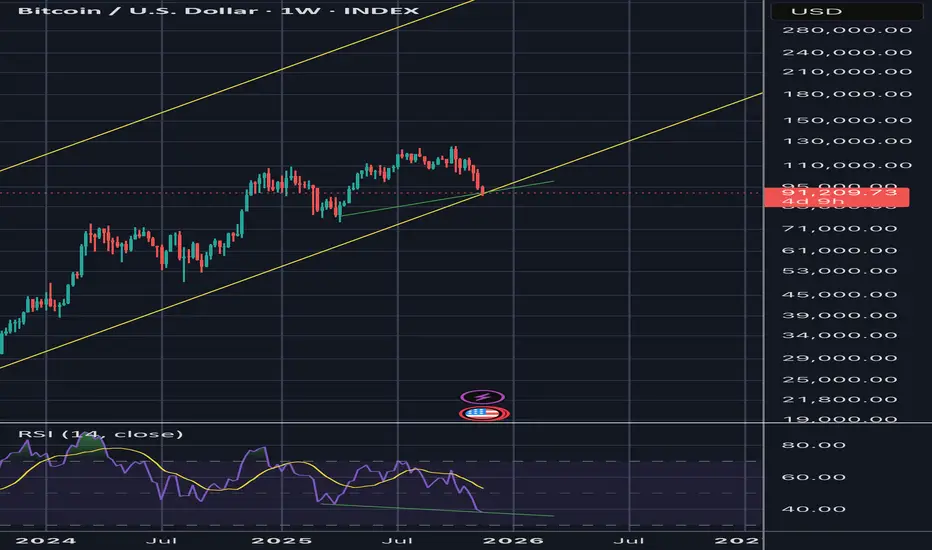
Early Stage Bullish RSI Divergence on BTC Weekly Chart. As shown by the green lines on the chart, early-stage bullish divergence may be forming on the Bitcoin (BTC/USD) weekly chart which:
- Signals a likely end-of-correction zone
- Suggests bull market structure still intact
- Aligns with cycle continuation, not a bear market start
Price and RSI turning upward are needed for confirmation.
Historically:
- 2013 mid-cycle correction with RSI bullish divergence led to a +400% run
- 2017 mid-cycle correction with RSI bullish divergence led to a +300% run
- 2020–2021 mid-cycle pullback with weekly RSI bullish divergence led to new ATH within months
In summary, BTC is likely forming a bottom right around this area, with potential for one more wick lower before reversal.
This is not investment advice. Be sure to do your own research.
XAUUSD GOLDGold can start a bullish move from the current price toward 4,111. The 3,962 level is a critical zone.

solusdt can start bullish SOL can start a bullish move from 123.44. The 94.66 level is a critical zone.

us30 bullishDow Jones can start its bullish move from 46,411 toward 46,681, keeping in mind the critical level at 46,298. CMCMARKETS:US30

Bitcoin 4-Year Halving Cycle | Highs & Lows RhythmA visual comparison of Bitcoin’s market highs and lows across each 4-year halving cycle — from pre-halving accumulation to post-halving expansion.
This chart highlights how BTC typically bottoms around 1 year before each halving and peaks 12–18 months after, revealing the recurring rhythm of supply shock and market psychology.
Key markers: each halving date, cycle bottom, and all-time high zones. Ideal for macro-swing and cycle analysis.
#BTC #Bitcoin #Halving #CryptoCycles #BTCUSD #CryptoAnalysis

Is This Where Bitcoin Makes Its Major Decision?
🔥 The Hidden April Gap Nobody Is Talking About — Is This Where Bitcoin Makes Its Major Decision?
Most traders completely missed this one.
Buried inside April’s fast displacement sits a hidden Fair Value Gap that aligns exactly with the real Monthly–Weekly Higher Low — and if price revisits it, this level could decide the next macro direction.
Let me walk you through it.
⸻
📍 The Level (Rounded for Clarity)
This forgotten 15m imbalance sits between:
• $86,200 (top)
• $85,350 (bottom)
Not just any gap — this one overlaps perfectly with the true HL in the Monthly–Weekly structure, the same HL that has been carrying the entire macro bullish leg.
This is where real decisions are made.
⸻
📉 Why This Zone Matters
If price revisits this area, there are only two outcomes — and both are significant:
1️⃣ Early Reversal Attempt (If Buyers Defend the HL)
A clean bullish reaction here could signal:
• Absorption of sell-side pressure
• Builder structure for a new daily leg
• First real attempt to end the higher-timeframe down sequence
2️⃣ Bearish Absorption (If Sellers Crush the HL)
If price cuts through the gap with displacement,
the Monthly–Weekly HL collapses.
That opens the door to deeper levels with minimal support.
This is not a small level — this is a macro hinge point.
⸻
👁️ My Plan
I’m watching $86.2K – $85.35K very closely.
When price returns to this zone, I want to see whether we get:
• Reversal intent,
or
• Full bearish continuation.
No predictions.
No hopium.
Price action will tell the truth.
⸻
🧭 Final Thought
This April gap isn’t random.
It’s the hidden liquidity pocket sitting directly on the real Monthly–Weekly Higher Low.
If Bitcoin revisits this level, the market will reveal whether buyers still have strength — or whether the bearish macro continues without mercy.
If this analysis brought you clarity or aligns with your view,
please Like ❤️ | Comment 💬 | Follow 🔔 | Share ↗️ —
your support motivates me to keep releasing clean, objective insights for the community.
NFA.
COINBASE:BTCUSD COINBASE:MCZ2025

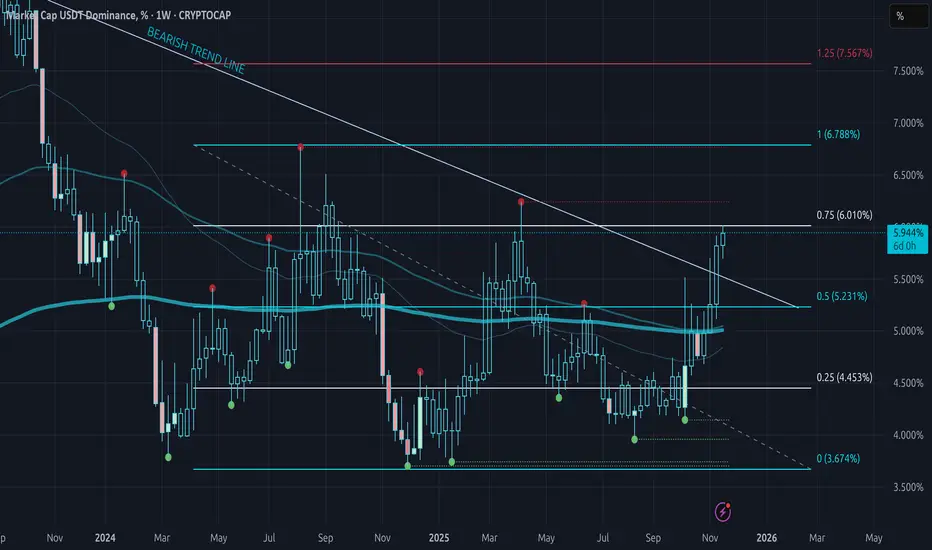
$USDT.D Rejection from 6% level incommingCRYPTOCAP:USDT.D is likely going to reject from the 6% area
0.75 fib level of the current range is sitting there
This will create a lower high inside the actual bearish structure without invalidating it, after creating max pain for spot holders and leverged longs
This will allow liquidity to rotate from BTC into Alts, given the much awaited altseason
Bitcoin Dominance will fall hard along CRYPTOCAP:USDT.D
This is the bullish scenario for crypto right now and the only hope for bulls ATM
If this scenario is invalidated, consider selling everything and re-entering lower, much lower
If CRYPTOCAP:USDT.D wants to reclaim higher levels, it's going to get very ugly.
Fear & Greed Index — Rebuilt as a Macro Oscillator for CryptoThe Fear & Greed Index is everywhere — a popular way to gauge market sentiment.
But it's usually just a mix of volatility, momentum, and social buzz...
📉 Not exactly macro.
This script is a technical reinterpretation of the Fear & Greed concept — but grounded in real, measurable economic behavior .
🧠 The Core Idea
This indicator is powered by the Copper/Gold ratio , a time-tested signal used by economists and institutional traders to track macroeconomic cycles:
- 🟢 When Copper outperforms → the economy is likely expanding → risk-on → Greed
- 🔴 When Gold outperforms → the economy may be contracting → risk-off → Fear
Copper represents industrial growth , while Gold signals defensive capital flows .
We track this ratio over time using a Z-Score oscillator to identify when sentiment is statistically stretched in either direction — highlighting moments of macro-level greed or fear.
📊 Why It Matters for Crypto
Crypto doesn’t live in a vacuum.
It's highly sensitive to the broader risk environment.
This oscillator gives you a macro lens to help:
- Anticipate bullish or bearish shifts in crypto markets
- Avoid common emotional traps at sentiment extremes
- Build entries or exits around macro confluence zones
It doesn’t tell you when to buy or sell — it tells you when the market context is shifting .
🔧 How to Use It
- Watch for the Z-Score entering > +2 (Greed) or < -2 (Fear)
- Use it to confirm broader risk-on/off behavior
- Combine with BTC or ETH price for potential lead/lag relationships
- Customize the tickers to test other macro pairs (e.g. SPX/VIX, BTC/DXY)
📈 Built with Pine Script v6
🔍 Default Tickers: CAPITALCOM:COPPER vs TVC:GOLD
📦 Fully customizable inputs, clean visual design, alert-ready
💡 Use this to trade with context — not emotion.
If you found this useful, give it a like and drop your feedback or improvements below 👇

NASDAQ NASDAQ can start a bullish move from the price zones of 24,767 or 24,682 toward 25,200. However, the 24,530 level is highly critical. NASDAQ:NDX

EURUSDEURUSD is at 1.15939
It has the potential to move towards 1.16152
The critical price level is 1.15797

Bitcoin Is Crashing… Nasdaq Still at Highs. Who’s Lying?For years, Bitcoin and the Nasdaq 100 have shown consistently high correlation, driven by the same macro forces:
• global liquidity cycles,
• risk appetite,
• real-rate expectations,
• and flows into high-beta growth assets.
Both are classic risk-on instruments—they benefit when liquidity expands and suffer when uncertainty rises.
However, the chart above shows a significant decoupling over the past weeks:
🔻 BINANCE:BTCUSDT : Deep Correction & Negative YTD
• Down more than 25% from the highs
• Trading –5% YTD in USD terms
• Volatility expanding and long liquidations accelerating
• Risk sentiment turning sharply lower within crypto
🔺 LSE:NQ11 : Near All-Time Highs
• Still hovering close to ATH levels
• Posting +16% YTD in USD
• Supported by strong earnings, mega-cap tech flows, and continued growth leadership
⚠️ This divergence is unusual — and historically meaningful
BTC and Nasdaq rarely disconnect to this magnitude without one of two outcomes:
1️⃣ Bitcoin Is Leading the Next Risk-Off Move
Crypto often reacts faster to changes in liquidity conditions and risk appetite.
If this is another leading signal, equities (especially high-beta tech) may follow with a lag.
2️⃣ Correlation Break Is Temporary
If the move was primarily crypto-specific (liquidations, funding resets, derivatives unwinds),
BTC could mean-revert upward as flows stabilize.
📌 Our View
Historically, when divergences of this scale have appeared:
Bitcoin leads, equities follow.
The magnitude of BTC’s correction vs the Nasdaq’s resilience suggests that:
👉 BTC may be pricing in a shift in risk conditions ahead of equities, not the opposite.
The key question for the next weeks:
Is the Nasdaq ignoring a message that crypto is already discounting?

Bretton Woods 2.0?Examining the long-term trend of TVC:DXY since the 1980s, we might be facing a staggering 40% reduction in valuation, potentially landing us around 60. If the US were to devalue the dollar this drastically, could it effectively erase the national debt? 🤔 Is Trump bold enough to consider such a move?
We know the FED is going to cut eventually, the question is when and by how much? Initial claims came in higher than estimated, with cracks beginning to show in the labor market, how much longer can JPow hold out?

Bitcoin's 4 year cycle topIt's plausible that we have now passed bitcoins 4 year cycle top this year, given the time band and RSI change in momentum. If so, it would be expected that the year ahead will be bearish and the next cycle top would not be expected until 2029.

XAU USD - correction playing out of ABC
I'm referring to the Daily price chart and key counts are in line with Wave counting and supply and demand curve trading levels based on fair value gap intervals of weekly trading sessions plotted to a daily chart at intervals of 60.
Current wave - 3 of 5 in the Elliott wave count.
Experiencing ABC corrective structure.
Corrective structure B has formed now nicely at $4,232. XX and rejected nicely, with a newly supply formed - based on A point of structure holding at at $4,372 - $4,217 zone within the inside candle.
Price has nicely breached the wick and sold off accordingly.
Now what happens?
two things -
1. Price will fall to $4000.00 and use this psychological zone and the previous order block to create and nice order block and move up - retaining the Demand control.
2. This looks to be a setup of a technical alignment of a drop, base, drop where price channel or corrective wave from Point B - to point C is forming.
The gap between on the daily structure left shows between $3,850 - 3,720 est is the real zone of interest where the Demand driver will derive from.
Master Key for zones
Black = Three Month
Blue = Monthly
Purple = weekly
Pink = Consolidative box example (Daily)
Orange = Daily
White = Wave
Red = Lines - Fibonacci, wave alignment.
Risk Warning
Trading leveraged products such as Forex, commodities and CFDs, carries with it a high level of risk and so may not be suitable for every investor. Prior to trading the foreign exchange, commodity or CFD market, consider your investment objectives, level of experience and risk appetite. You should never risk more than you can afford to lose. If you fail to understand or are uncertain of the risks involved, please seek independent advice and remember to conduct due diligence as criteria varies to suit the individual.
Below are some of the take aways from the video - please listen again incase any detail is missed.
Do you enjoy the setups?
Professional analyst with 8+ years experience in the capital markets
Focus on technical output not fundamentals
Focus on investing for long term positional moves
Provide updates where necessary - with new updated ideas tracking the progress.
If you like the idea, please leave a like or comment.
To all the followers, thank you for your continued support.
Thanks,
LVPA MMXXIV

History always repeats — that’s what trading is about !Hello Traders 🐺
Welcome back to another idea.
I think maybe you said to yourself that this idea could be a total madness :-)
But here is the truth — and we have to be honest with ourselves.
I know it sounds a little bit crazy to see a Skyfall from 96K all the way down to 34K , something around 60% !
But we’ve had similar situations so many times before.
Let me break it down for you, my friends 👇
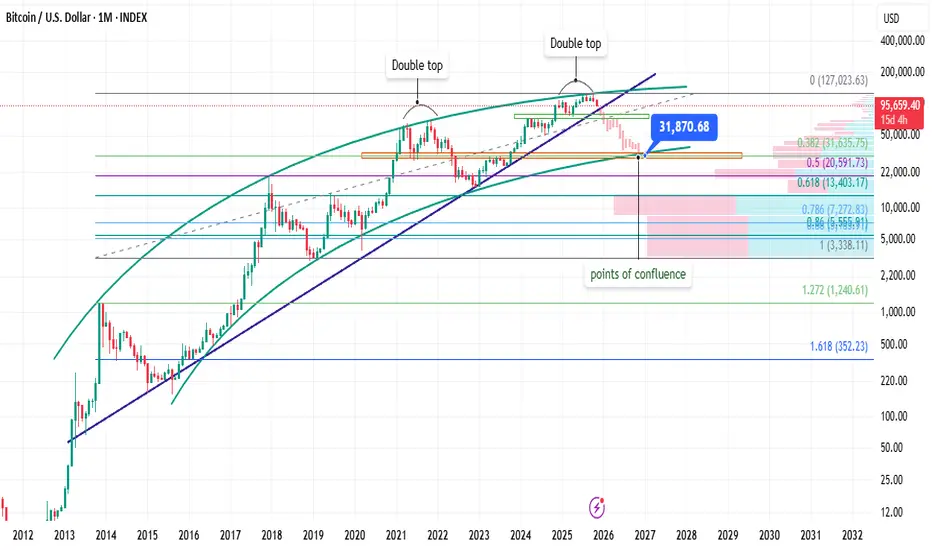
As you can see on the Monthly timeframe , BTC is playing between two curves for almost its whole life.
Yes — looks interesting, and I think we can use it as a very clear map to avoid greed and fear , and control our emotions during the time, especially if you are not a day trader.
I think these two support and resistance curves are very valid because they formed on a high timeframe such as the monthly.
So what else can we see here?
If you pay closer attention to the chart, you’ll find that every time price hits the resistance line (the upper line of our curvy channel),
that was the top of the bull market.
But the interesting point here is:
I am seeing a fractal pattern. Let me show you 🔍
If you go back to 21 November 2021 , you can see that price formed a double-top pattern, and the bear market officially started when price broke below the neckline of that double top.
Now here is the same twist:
We are very close to 21 November again :-)
And price is currently trying to hold above the support line of the double top pattern.
I think if we break below the neckline — which is around 75K —
with a high degree of certainty, BTC would fall straight to the next most important support level, which is 32K.
But why this level?
As you can see, at this level we have 3 points of confluence:
On the right-hand side of the chart, the Anchored VPVR shows a huge demand zone
This zone aligns exactly with the 0.382 Fibonacci retracement level
And the most interesting part: both areas perfectly match the support level of the curvy channel 📉
I think we must be honest in trading and always pay close attention to the warning signs.
This time is no different.
History will always repeat — and this is exactly what trading is about.
I hope you enjoy this idea 🙌
Please drop your comments below so we can share our thoughts together.
And as always remember:
🐺 Discipline is rarely enjoyable, but almost always profitable. 🐺
🐺 KIU_COIN 🐺