ARAM - Correction Ending, New Impulse Loading?About ARAM🔎
- ARAM Group is a UAE-listed company on ADX, operating primarily in industrial, construction, and contracting-related services.
- The company is positioned within sectors tied to infrastructure development and regional growth projects.
- Given the UAE’s long-term expansion plans and ongoing infrastructure initiatives, companies like ARAM operate in structurally important segments of the economy.
Fundamental Analysis🗞
- From a broader perspective:
• ARAM benefits from infrastructure-driven demand in the region 🏗️
• Exposure to government-backed development projects
• Cyclical upside during expansion phases of the economy
• Potential operating leverage during strong project cycles
- Infrastructure and industrial stocks tend to move in waves, quiet accumulation phases followed by strong impulsive expansions.
The question now is: are we entering a new expansion leg?
Technical Analysis📊
- Technically, ARAM has been trading within a wide range for years.
Price recently reacted strongly from the major blue support zone, a level that has historically acted as a solid demand area.
After that reaction, we saw a clear impulse to the upside 🚀 followed by a corrective move inside the falling red channel.
Now price is attempting to complete this correction.
- As long as the blue support structure continues to hold, we will be looking for long setups targeting the upper red resistance zone.
However, for a full bullish continuation and a new major impulse phase 📈, a confirmed break above the falling red corrective channel is required.
Correction… or reload before the next expansion?
⚠️ Disclaimer: This is not financial advice. Always do your own research and manage risk properly.
📚 Stick to your trading plan regarding entries, risk, and management.
Good luck! 🍀
All Strategies Are Good; If Managed Properly!
~Richard Nasr
Economy

$CNIRYY - China's CPI (January/2026)ECONOMICS:CNIRYY +0.2%
January/2026 -0.6%
- China’s annual inflation rate eased sharply to 0.2% in January 2026 from 0.8% in December, marking the lowest print since October and missing estimates of 0.4%.
Food prices fell for the first time in three months while non-food inflation slowed.
Meantime, producer prices shrank 1.4% YoY,
the mildest in 1-1/2 years despite logging a 40th straight month of decline.

$USNFP - U.S Non-Farm Payrolls (January/2026)ECONOMICS:USNFP 130K
January/2026
source: U.S. Bureau of Labor Statistics
- U.S Non-Farm Payrolls rose by 130K in January and the unemployment rate unexpectedly fell to 4.3%, signaling a stable labor market at the start of the year.
Hiring beat forecasts and the drop in joblessness pointed to resilient labor demand. Annual revisions showed that job gains averaged just 15K per month last year, down sharply from the initially reported pace of 49K.

S&P 500 Daily Chart Analysis For Week of Feb 6, 2026Technical Analysis and Outlook:
The Index exhibited notable volatility during the trading session this week, reflecting one of the most robust rebounds observed to date. It has stabilized above the Mean Support level of 6,892 and below the Key Resistance level of 6,993.
It is anticipated that the Index will continue its upward trajectory toward the target of the Outer Index Rally at 7,026, while helming through the newly established Key Resistance level at 6,993.
However, it is imperative to acknowledge that, given the prevailing market conditions, there is a substantial likelihood of a retracement that may lead to revisiting the Mean Support at 6,892, prior to the Index regaining its bullish momentum and progressing toward the projected outcome of the Outer Index Rally at 7,026. At this stage, an In Force retracement is expected to be initiated from that completed target.

EUR/USD Daily Chart Analysis For Week of Feb 6, 2026Technical Analysis and Outlook:
In the past week’s trading session, the Euro has exhibited a limited trading range, having fallen below the Mean Support level of 1.185 and currently trading closely below the Mean Resistance level of 1.183.
It is anticipated that, following the achievement of the letter target, a retracement towards the Mean Support at 1.177 will commence. This retracement is expected to precipitate a renewed downtrend, with the primary target set at the Outer Currency Dip of 1.166, supported by Mean Support levels at 1.177 and 1.168, which will present consequential hurdles. The rebounds are expected to be initiated from the aforementioned support levels and ultimate reached target the Outer Currency Dip 1.166.
Furthermore, market participants should remain vigilant regarding the potential for the currency to experience a gradual intermediate oscillation between the Mean Support at 1.177 and the Mean Resistance at 1.183 before resuming the downward movement.

Bitcoin(BTC/USD) Daily Chart Analysis For Week of Feb 6, 2026Technical Analysis and Outlook:
Bitcoin has experienced a substantial decline this trading week. As outlined in the Bitcoin Daily Chart Analysis for the week of January 30, the cryptocurrency adhered closely to our projections by surpassing the critical Mean Support level at 82,000, ultimately achieving the Outer Coin Dip target at 78,500. Additionally, it fulfilled our long-term objective by reaching the subsequent Outer Coin Dip at 64,000. Following this significant milestone, the digital asset experienced a robust rebound, as anticipated.
Current market analysis indicates a potential downward move to revisit the Main Support level at 62,800 and to reach the Outer Coin Dip at 60,000 before reviving upward momentum.
It is essential to highlight that there may be gradual fluctuations between the Mean Support level of 62,800 and the Mean Resistance level of 71,200 before a breakout in either direction. The target for upward movement is a Mean Resistance of 78,700, while the target for downward movement is an Outer Coin Dip at 44,500.

$EUINTR - Europe's Interest RatesECONOMICS:EUINTR 2%
February/2026
source: European Central Bank
- The ECB left borrowing costs unchanged, as widely expected, with the key deposit facility rate held at 2%.
Policymakers said inflation is likely to stabilize at the 2% target over the medium term and noted that the economy remains resilient despite a challenging global environment.
However, they acknowledged that the outlook remains uncertain, particularly due to ongoing global trade policy uncertainty and geopolitical tensions.

$GBINTR - U.K Interest Rates (February/2026)ECONOMICS:GBINTR 3.75%
February/2026
source: Bank of England
- The Bank of England kept its Bank Rate unchanged at 3.75% in February,
with a narrow 5 to 4 vote, as policymakers balanced easing inflation pressures against risks from a weakening economy.
Four members supported a 25 basis point cut, highlighting growing divisions within the Monetary Policy Committee.
Inflation remains above the 2% target but is expected to fall back to around that level from April due partly to energy price developments.
Pay growth and services inflation have continued to ease, reflecting subdued economic growth and rising slack in the labour market.
Policymakers noted that risks of persistent inflation have diminished, while weaker demand and a softening jobs market pose downside risks.
Bank Rate has already been reduced by 150 basis points since August 2024, lowering policy restrictiveness.
The committee signalled that further rate cuts are likely but will depend on incoming inflation data, with future decisions expected to be finely balanced.

S&P 500 Daily Chart Analysis For Week of Jan 30, 2026Technical Analysis and Outlook:
The Index exhibited considerable volatility during the trading session this week, ultimately finding support at the Mean Support level of 6,897. Following this decline, the Index demonstrated a robust rebound and has stabilized just below the Key Resistance level of 6,977.
It is anticipated that the Index will maintain an upward trajectory towards the outstanding target of the Outer Index Rally at 7,026, and contrive the route through the newly established Key Resistance level at 7,000.
Nonetheless, it is crucial to recognize that, given the current market conditions, there is a significant probability of a retracement that may revisit the Mean Support at 6,897 before the Index regains bullish momentum and progresses towards the foretold outcome of the Outer Index Rally at 7,026 in the previous Daily Chart Analysis. At this juncture, a renewed In Force retracement is expected to be initiated from that level.

EUR/USD Daily Chart Analysis For Week of Jan 30, 2026Technical Analysis and Outlook:
Over the past week, the Euro trading session has demonstrated a substantial upward trajectory, surpassing the Interim Inner Currency Rally target of 1.186 and successfully retesting the completed Outer Currency Rally level at 1.191. Upon reaching this target, the Euro achieved the outstanding Outer Currency Rally level of 1.208, thereby activating a retracement towards the current Mean Support at 1.185.
It is anticipated that this retracement will continue toward the Mean Support at 1.178, with the potential extension to the Mean Support at 1.173. At this juncture, a renewed Inner Rebound is expected to initiate from the forenamed support levels.
Furthermore, market participants should be cognizant of the likelihood that the currency will exhibit a gradual intermediate gyration between the Mean Support at 1.185 and the Mean Resistance at 1.191 before resuming the retracement.

Bitcoin(BTC/USD) Daily Chart Analysis For Week of Jan 30, 2026Technical Analysis and Outlook:
Bitcoin has undergone a significant decline during this week's trading session, resulting in the elimination of both the Mean Support levels at 85,300 and 82,000.
Current market analysis suggests a continued downward trajectory. Should Bitcoin breach the initial support level of Mean Support at 82.000, the immediate downside target will be our ultimate Outer Coin Dip at 78,500, followed by a subsequent target of the next Outer Coin Dip at 64,000.
On the upside, a rebound is anticipated upon reaching the Outer Coin Dip at 78,500. It is important to note that a gradual intermediate gyration may occur between the Mean Support at 82,000 and the Mean Resistance at 86,000 before the continuation of the downward trend.

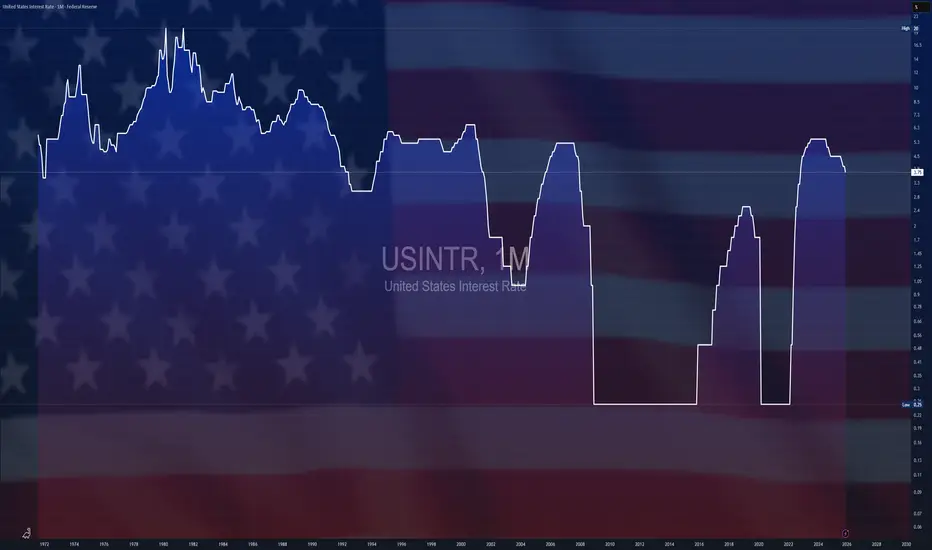
$USINTR - U.S Interest Rates (January/2026)ECONOMICS:USINTR
January/2026
source: Federal Reserve
- The Federal Reserve left the federal funds rate unchanged at the 3.5%–3.75% target range in its January 2026 meeting, in line with expectations.
The central bank paused its easing cycle after three consecutive rate cuts last year that pushed borrowing costs to their lowest level since 2022.
USD/AUD Outlook: RBA Hawkishness Meets Dollar DebasementThe USD/AUD currency pair is undergoing a significant structural repricing. A convergence of persistent Australian inflation and a politically engineered devaluation of the U.S. Dollar has created a powerful bearish trend for the pair (favoring a stronger Australian Dollar).
Macroeconomics: The Inflation Divergence
The primary economic driver is the divergence in monetary policy lifecycles. Australia’s consumer inflation accelerated to 3.6% in the fourth quarter of 2025, exceeding the RBA’s 2–3% target. Monthly data for December printed at 3.8%, forcing the Reserve Bank of Australia (RBA) to maintain a restrictive "higher for longer" stance.
Conversely, the U.S. macro outlook is dominated by fiscal concerns. With U.S. debt approaching $39 trillion, markets are pricing in a higher risk premium for holding U.S. assets. This fundamental mismatch, an RBA forced to fight sticky inflation versus a U.S. regime tolerating currency weakness, creates a distinct downward pressure on USD/AUD.
Industry Trends: Housing as an Inflation Engine
A sector-specific analysis reveals that housing costs are the engine room of Australian inflation, rising 5.5% in December. This reflects deep supply chain constraints and elevated construction costs.
Unlike transitory price shocks, housing inflation is sticky. It spreads across consumption sectors, including "Recreation and Culture," indicating broad-based demand. This industry trend virtually eliminates the possibility of near-term RBA rate cuts, solidifying the Australian Dollar's yield advantage.
Management and Leadership: Policy Culture Clash
The fluctuation is also a result of conflicting leadership styles.
The RBA (Prudence): Deputy Governor Andrew Hauser and Governor Michele Bullock represent a culture of orthodox central banking. They have explicitly ruled out near-term easing, prioritizing mandate compliance over popular sentiment.
The White House (Disruption): President Trump’s management style involves "verbal intervention." His recent comments that the dollar is "doing great" while it plummeted removed the executive safety net. This signaled to traders that the administration implicitly supports a weaker currency to boost exports.
Geopolitics and Geostrategy: The Debasement Trade
Geostrategically, the U.S. Dollar is facing a crisis of confidence dubbed the "debasement trade." Investors are rotating capital out of the USD and into emerging markets and gold to hedge against fiscal unpredictability.
Trump’s tariff threats and unpredictability have alienated allied capital. The market views this not just as a tactical dip, but as a strategic withdrawal of foreign liquidity from U.S. Treasury markets. This geopolitical friction weakens the USD’s status as the ultimate safe haven, benefiting high-beta currencies like the AUD.
Technology and High-Tech: The Algorithmic Shift
In the domain of financial technology, derivatives markets are flashing warning signals. Data from the Depository Trust and Clearing Corporation shows turnover hitting near-record levels.
Algorithmic trading systems are aggressively pricing "risk reversals," with premiums on short-dated options favoring a weaker dollar. This high-tech market sentiment indicates that institutional machines are programmed to sell USD rallies, exacerbating the downward volatility.
Conclusion: A Structural Downtrend
The USD/AUD pair is caught between a rock and a hard place. Australia’s resilient economy (growing at 2.1%) and sticky inflation demand a strong currency to dampen prices. Simultaneously, the U.S. political apparatus is dismantling the "strong dollar" doctrine.
Unless the RBA pivots unexpectedly or the U.S. fiscal outlook stabilizes, the path of least resistance for USD/AUD remains lower.

$GOLD - Yellowstone's Shine'Our TVC:GOLD is no longer safe in the Fed’s vaults’
“Given the current geopolitical situation, it seems risky to store so much TVC:GOLD in the U.S” “In the interest of greater strategic independence from the US, the Bundesbank would therefore be well advised to consider repatriating the $Gold.
- leading economist and former Bundesbank head of research Emanuel Mönch told the German press on Friday.
TVC:GOLD loving uncertainty printed a New All Time High during Asian Session (26/1/2026) ;
defeating swiftly the 5.000$ per troy ounce psychological benchmark.
Seems like every pull back seen on TVC:GOLD 's charts,
is another great opportunity to BUY.
Firmly based on a large scale of structural demand purposes for TVC:GOLD ,
vastly noting the accumulation phase of Central Banks and Sovreings States since 2008 Financial Crisis;
People’s Bank of China ECONOMICS:CNGRES remains a steady long-term buyer, adding TVC:GOLD monthly even amid record prices, out-pacing $USGRESUnited States, ECONOMICS:GBGRES United Kingdom, ECONOMICS:EUGRES European Union as a whole and ECONOMICS:CHGRES Switzerland .
So has done Russia ECONOMICS:RUGRES , Japan ECONOMICS:JPGRES , ECONOMICS:PLGRES Poland and Germany ECONOMICS:DEGRES .
However, current uptrend isn't soly supported by a long accumulation phase past 2008 Financial Crisis.
Tariffs threats of Donald Trump towards China, Canada, South-Korea have spooked investors, trying to hedge on the yellowstone against trade-wars.
Geo-Politics have been popping up on consistent basis ever since Russia-Ukraine war took place on 202;
while lately conflicts brewing with U.S and Venezuela, Iran, and tensions between Greenland take over which has troubled the European Union and NATO.
Also a shunning TVC:DXY and a troubled-policy driven currency like Japanese-Yen are losing strength as an hedge.
Their appeal being dimmed can be found at how Commercial and Central Banks have been adding up on their TVC:GOLD reserves like never before.
With TVC:GOLD and TVC:SILVER prices increasing fast,
seems like retailers have a low probability to accumulate as much as they wish to do so on lower prices.
Wether you're a Spot buyer or a CFD trader, is not smart to counter-trend against precious metals.
While many wondering where the top is, forecasts of big players varies from 5.500$/oz to 7.000$ by end year of 2026.
What's important seeking out is not the peak or the bottom, but rather focusing on what price levels will be for the next pro-longed accumulation phase that shall follow when Geo-Politics uncertainty comes to an end and a more positive stabilization of TVC:DXY and other macro-economics factors such as Interest Rates and Inflation.

Gold at $7,000? The Strategic Case for the Next Historic LeapGold has shattered the psychological glass ceiling. With spot prices piercing the $5,000 mark in January 2026, the yellow metal has entered uncharted territory. While UBS forecasts a consolidation around $5,000, a growing chorus of institutional voices now identifies a credible path to $7,000 per ounce. This trajectory is not merely speculative; it is the mathematical output of a fractured global order. The following analysis dissects the structural drivers propelling gold toward this new paradigm.
Geopolitics: The Chaos Premium
The "fear trade" has evolved into a permanent "chaos premium." Markets are pricing in the unpredictability of the U.S. administration, where foreign policy is increasingly used as a transactional lever. President Trump’s recent threats regarding Greenland’s status and tariffs on European allies have injected unprecedented volatility into the Atlantic alliance. Simultaneously, U.S. military maneuvers involving Venezuela and escalating tensions with Iran have dismantled the traditional assumption that U.S. assets are the ultimate safe haven. Investors are fleeing this geopolitical instability, utilizing gold not just as insurance, but as a non-sovereign store of value immune to sanctions or diplomatic seizure.
Geostrategy: The Sovereign Pivot
A quiet revolution is occurring in central bank vaults. The global monetary architecture is shifting away from a dollar-centric system, driven by the weaponization of finance. Central banks are aggressively diversifying reserves, with official purchases forecast to reach 950 tonnes in 2026. This is a strategic realignment, not a tactical trade. Nations like China and others in the Global South are systematically replacing U.S. Treasuries with gold to inoculate their economies against potential asset freezes. This "sovereign bid" creates a price floor, effectively removing massive quantities of bullion from the circulating supply and tightening the market structure.
Macroeconomics: The Debasement Trade
The most potent catalyst for $7,000 gold lies in the erosion of fiat currency credibility. The "debasement trade" is accelerating as investors confront the reality of U.S. fiscal sustainability. With national debt exceeding $324 trillion globally and U.S. deficits widening, the Federal Reserve faces immense pressure to monetize debt. Real yields are expected to remain subdued or negative, reducing the opportunity cost of holding non-yielding assets. As the Fed potentially moves toward a more dovish stance to support labor markets, the dollar’s purchasing power declines, mathematically necessitating a higher gold price to value the world’s outstanding liabilities.
Industry Trends & Technology: The Scarcity Engine
Physical constraints are colliding with algorithmic demand. Fibonacci extension models used by technical analysts now identify $7,040 as a major target zone, driven by momentum trading and high-frequency algorithms chasing the breakout. On the supply side, the industry faces a geological plateau. New major discoveries are rare, and ore grades are deteriorating, making extraction more expensive and technically challenging. This scarcity is compounded by a structural deficit in silver, which often leads gold in precious metal bull markets. The combination of finite supply and infinite monetary expansion creates a powerful engine for price appreciation.
Conclusion
The ascent to $7,000 is no longer a fringe theory but a plausible outcome of converging crises. Gold has transitioned from a cyclical commodity to a strategic necessity for preserving capital. As faith in political institutions wavers and the global debt burden swells, the market is actively repricing the world’s oldest form of money.

S&P 500 Daily Chart Analysis For Week of Jan 23, 2026Technical Analysis and Outlook:
The S&P 500 Index declined substantially during this week's trading session, eliminating both Mean Support levels at 6,902 and 6,850. Following this decline, the Index has demonstrated a striking rebound, stabilizing above the newly established Mean Support level at 6,897. It is projected that the Index will continue its upward trajectory towards the subsequent target of the Outer Index Rally at 7,026, via Key Resistance at 6,977.
However, it is essential to recognize that, given prevailing market conditions, there is a significant likelihood of a study to lower pullbacks that may retest the Mean Support at 6,897 before the Index returns to bullish sentiment and achieves the Outer Index Rally target of 7,026. At this stage, a renewed In Force retracement is anticipated to initiate from that level.

EUR/USD Daily Chart Analysis For Week of Jan 23, 2026Technical Analysis and Outlook:
Over the past week, the Euro trading session has shown a notable upward rally, surpassing the Mean Resistance level at 1.164. This ascent continued toward the completed Interim Inner Currency Rally target of 1.180 and subsequently extended to a new level identified at 1.186.
Upon reaching this target, an In Force retracement is anticipated toward the Mean Support level at 1.178. Nevertheless, market participants should be aware that the currency may continue its trajectory to retest the completed Outer Currency Rally at 1.191, via the Key Resistance level at 1.187. At this juncture, a renewed In Force retracement is expected to be initiated from the Outer Currency Rally at 1.191.

Bitcoin(BTC/USD) Daily Chart Analysis For Week of Jan 23, 2026Technical Analysis and Outlook:
Bitcoin dropped dramatically in this week's trading session and continued falling sharply after successfully reaching a target price of Interim Inner Coin Rally 98,000, eliminating both the Mean Support levels at 94,200 and 90,500 in the process.
Current market analysis suggests progressive Intermediate Retest gyration between the Mean Resistance 91,300 and Mean Support 88,300, with a prominent drawdown sentiment currently exerting downward pressure, should the initial support level of Mean Support 88,300 be breached, with an immediate downside targets are identified as Mean Support 85,300, with additional targets such as Mean Support 82,000 and the ultimate outcome of Outer Coin Dip 78,500 underlying below.
On the upside, the coin's rebound, breaching Mean Resistance at 91,300, may drive prices higher before resuming its downward trajectory.

$JPINTR -Japan's Interest Rates (January/2026)ECONOMICS:JPINTR
January/2026 0.75%
source: Bank of Japan
-The Bank of Japan kept its key short-term rate unchanged at 0.75% at its first policy meeting of 2026, leaving borrowing costs at their highest since September 1995.
The widely expected decision was backed by an 8–1 vote.
In its quarterly outlook, the board revised up FY 2025 GDP growth to 0.9% from 0.7% and lifted its core inflation forecast for FY 2026 to 1.9% from 1.8%.

$USPCEPIMC - U.S PCE (November/2025)ECONOMICS:USPCEPIMC
(November/2025) +0.2%
source: U.S. Bureau of Economic Analysis
- The US personal consumption expenditures (PCE) price index excluding food and energy increased by 0.2% month over month in November 2025, unchanged from October and in line with market expectations, according to delayed data from the Bureau of Economic Analysis (BEA).
On an annual basis, core PCE inflation edged up to 2.8% in November from 2.7% in October, also matching forecasts. source: U.S. Bureau of Economic Analysis

$USGDPQQ - U.S GDP Q3/2025ECONOMICS:USGDPQQ 4.4%
Q3/2025 +0.6%
source: U.S. Bureau of Economic Analysis
- The US economy expanded at an annual rate of 4.4% in Q3 2025, up from 3.8% in Q2 and slightly exceeding the preliminary estimate of 4.3%.
It marked the fastest pace of growth since Q3 2023, driven primarily by stronger consumer spending, rising exports, increased government outlays, and robust business investment.

$GBIRYY - U.K CPI (December/2025)ECONOMICS:GBIRYY 3.4%
December/2025 +0.2%
source: Office for National Statistics
- U.K consumer price inflation rose to 3.4% in December 2025, up from November’s eight-month low of 3.2% and slightly above market expectations of 3.3%.
This year-end acceleration, the first since July, could complicate the Bank of England’s efforts to guide inflation back toward its 2% target, though the rise is expected to be temporary thanks to government interventions.
The increase was largely driven by higher prices for alcohol and tobacco, which jumped to 5.2% from 4.0% in November due to the timing of tobacco duty changes, and transport costs, which rose to 4.0% from 3.7% on the back of higher airfares.
Additional upward pressure came from food and non-alcoholic beverages (4.5% vs. 4.2%). Services inflation, a key gauge of domestic price pressures for the BOE, edged up slightly to 4.5% from 4.4%, below expectations.
Core inflation, which excludes volatile items like unprocessed food and energy, remained steady at 3.2%, marking its lowest level since December 2024.

USD/IDR Surge: Rupiah Crumbles on Fiscal PanicThe Indonesian Rupiah is in freefall. USD/IDR has breached critical resistance levels as fiscal anxiety grips Jakarta. A failed bond auction and foreign capital exodus have created a perfect storm for the currency. Traders must now navigate a landscape defined by populist spending risks and global contagion.
Macroeconomics and Economics
The latest debt auction exposes deep systemic cracks. Indonesia sold 36 trillion rupiah ($2.1 billion) of debt, yet demand evaporated. The bid-to-target ratio collapsed to 2.51, the weakest since March. Investors are rejecting Indonesian paper. They demand higher premiums to hold assets denominated in a depreciating currency. This waning appetite forces yields higher, further straining the government's balance sheet. The market is effectively pricing in a deterioration of Indonesia's sovereign credit profile.
Geopolitics and Geostrategy
Jakarta is suffering from global collateral damage. A selloff in Japanese notes, triggered by Prime Minister Sanae Takaichi’s aggressive tax plans, sparked a worldwide debt rout. This contagion hit Southeast Asia hard. Indonesia, often viewed as a high-beta proxy for emerging market risk, took the brunt of the hit. Geostrategically, foreign capital is fleeing back to the safety of the US Dollar. The USD/IDR pair is rising not just on Rupiah weakness, but on a strategic flight to safety.
Management and Leadership
Investor confidence in Indonesia's economic stewardship is eroding. Markets are reacting negatively to reports of "populist spending." Traders fear these fiscal expansions will blow out the budget deficit. Furthermore, concerns regarding the independence of the central bank add a risk premium to the currency. Effective leadership demands fiscal discipline, yet the current trajectory suggests the opposite. Without credible austerity signaling, the central bank lacks the credibility to defend the Rupiah effectively.
Business Models and Industry Trends
The business model of "carry trade" is dead for the Rupiah. Foreign investors submitted bids for only 3.9 trillion rupiah, a fraction of last year's 15.6 trillion average. Handy Yunianto of PT Mandiri Sekuritas notes that yield spreads are no longer attractive. The risk-reward ratio has flipped. Global asset managers are liquidating positions in Indonesian fixed income to cover losses elsewhere or to chase higher risk-free rates in the US.
Technology and High-Tech
Modern capital flight occurs at the speed of light. High-frequency algorithmic trading exacerbates these selloffs. Unlike in 1998, digital financial infrastructure allows foreign investors to exit positions instantly. This technological efficiency accelerates volatility in USD/IDR. There are no buffers. When sentiment turns, the digital exit doors are wide open, and capital flows out unchecked.
Conclusion
The USD/IDR pair is unmoored. Fiscal deterioration, combined with a loss of foreign confidence, paints a bearish picture for the Rupiah. Unless the government restores fiscal credibility or global yields stabilize, the path of least resistance for USD/IDR is higher.
