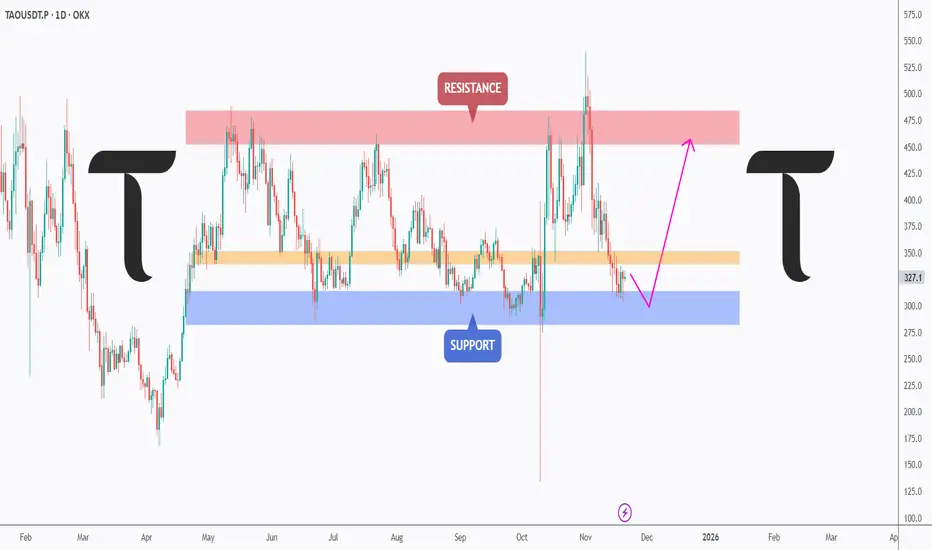
T for TAO… Let’s Keep It Simple!📦 TAO is currently trading inside a wide range , hovering above a major support zone that has held the price multiple times throughout the year. As long as this blue support area continues to hold, we will be looking for longs and expecting buyers to step in.
📈For the bulls to fully take over , TAO needs to break and hold above the orange structure zone, which has been acting as a strong barrier for months. A clean breakout above it would open the way toward the red resistance zone and potentially higher.
Until then, this remains a simple range:
Support for buys… resistance for sells… and structure for confirmation. 🤔
⚠️ Disclaimer: This is not financial advice. Always do your own research and manage risk properly.
📚 Stick to your trading plan regarding entries, risk, and management.
Good luck! 🍀
All Strategies Are Good; If Managed Properly!
~Richard Nasr.
Ecosystem
SOL - Enough is Enough!📉After weeks of selling pressure , SOL is finally approaching a massive confluence zone around the $150 round number, which aligns perfectly with a strong weekly support area highlighted in blue.
⚔️This level has historically acted as a major pivot zone , and as long as SOL holds above it, I’ll be looking for short-term long opportunities, targeting the upper bound of the falling red channel.
🏹However, for the bulls to fully take control, SOL must break above the last major high marked in red, confirming a shift from correction to continuation.
Could this be the point where Solana says - Enough is enough? 👀
⚠️ Disclaimer: This is not financial advice. Always do your own research and manage risk properly.
📊All Strategies Are Good; If Managed Properly!
~Richard Nasr

Alephium (ALPH) - “Wedge of Worth: Poised to Snap Higher"🌱 Fundamentals & Catalyst
- Alephium is a next-generation Layer-1 blockchain combining a stateful UTXO model, sharding tech (BlockFlow), and a “Proof of Less Work” consensus, offering high TPS and energy efficiency.
- The token ALPH powers the ecosystem: mining incentives, developer SDKs, and support for dApps built on the chain.
- Recent news show institutional-grade partnerships and roadmap momentum such as the Phase 2 Roadmap Teaser and PrimeVault custody integration.
Why this matters => The technical stack and ecosystem signals suggest ALPH is moving beyond speculative status into infrastructure play, creating a bullish tailwind for the setup.
📉 Technical Picture
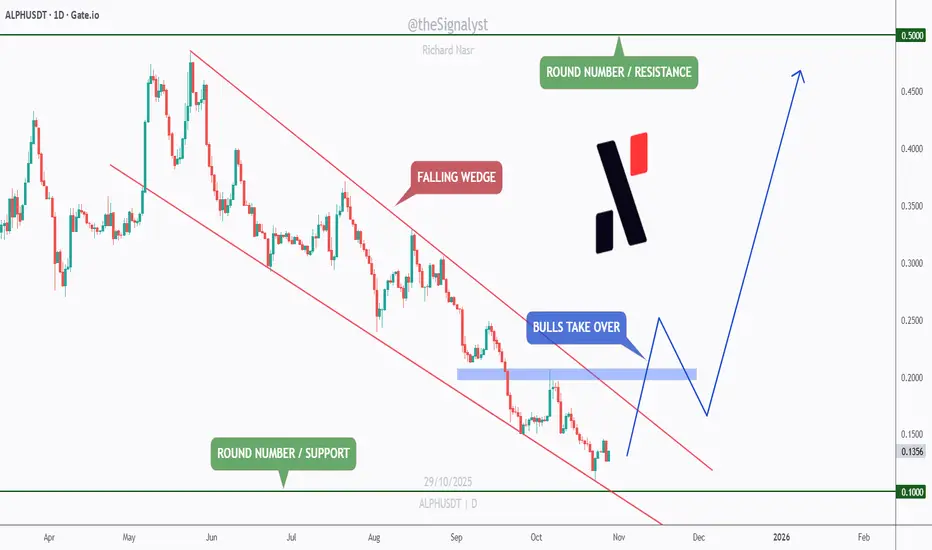
- ALPH has been trading inside a clear falling wedge pattern, a classic bullish reversal structure indicating price compression ahead of a breakout.
- Price is now sliding toward the strong round-number support at $0.10, a psychological anchor and historical inflection zone.
- Trigger for confirmation: A clean break above the last major high (blue zone on chart) followed by a retest or sustained close above it.
- On that breakout, the first target is significant: the next round number at $0.50, offering substantial upside.
- Risk control: A sustained breakdown below $0.10 would invalidate the bullish reversal thesis and turn the wedge into a trap.
🧭 Trading Plan
- Watch zone: ~$0.10 support, ideal area to look for bullish reversal signals (rejection wicks, volume pickup, retest of breakout).
- Entry trigger: Break & hold above recent blue-zone high, with confirmation (H4/DAILY) + backing volume.
- Targets: $0.50 as primary upside; intermediate stops could scale profits earlier.
- Invalidation level: Close below $0.10 turns the bullish scenario off, flip to neutral/bearish until structural support reasserts.
⚠️ Disclaimer: This is not financial advice. Always do your own research and manage risk properly.
📚 All Strategies Are Good; If Managed Properly!
~Richard Nasr
SUI - Oversold and Testing a Major Intersection Zone!🏹SUI has reached a critical technical intersection, where the lower boundary of the long-term channel meets the bottom of the descending red structure. Historically, this area has acted as a launchpad for reversals, with multiple reactions from the same channel base in the past.
After weeks of heavy downside pressure, SUI now looks deeply oversold, both technically and structurally. The confluence between the horizontal support zone and the diagonal trendline adds strength to this level, making it a high-probability area for a short-term relief rally.
📈As long as the price holds above this support intersection , the next potential wave could target the upper red channel first, followed by the upper blue boundary near $4.5 if momentum continues to build.
If this level breaks decisively, it would signal a structural shift — but for now, bulls still have a chance to step in from this confluence zone.
📊All Strategies Are Good; If Managed Properly!
~Richard Nasr

INJ - Back Bullish!Hello TradingView Family / Fellow Traders. This is Richard, also known as theSignalyst.
📈INJ has been overall bullish trading within the rising wedge pattern marked in blue.
This week, INJ has been retesting the lower bound of the wedge.
Moreover, the green zone is a strong demand.
🏹 Thus, the highlighted blue circle is a strong area to look for buy setups as it is the intersection of the lower blue trendline and green demand.
📚 As per my trading style:
As #INJ approaches the blue circle zone, I will be looking for trend-following bullish reversal setups (like a double bottom pattern, trendline break , and so on...)
📚 Always follow your trading plan regarding entry, risk management, and trade management.
Good luck!
All Strategies Are Good; If Managed Properly!
~Richard Nasr

INJ - Back from the Dead?Hello TradingView Family / Fellow Traders. This is Richard, also known as theSignalyst.
INJ has been hovering within a wide range between our two green zones, spanning from $10 to $16.
For the bulls to take control in the medium term, a break above the last major high marked in blue is needed.
To confirm long-term bullish dominance, a breakout above the upper boundary of the green range is required.
📚 Always follow your trading plan regarding entry, risk management, and trade management.
Good luck!
All Strategies Are Good; If Managed Properly!
~Rich

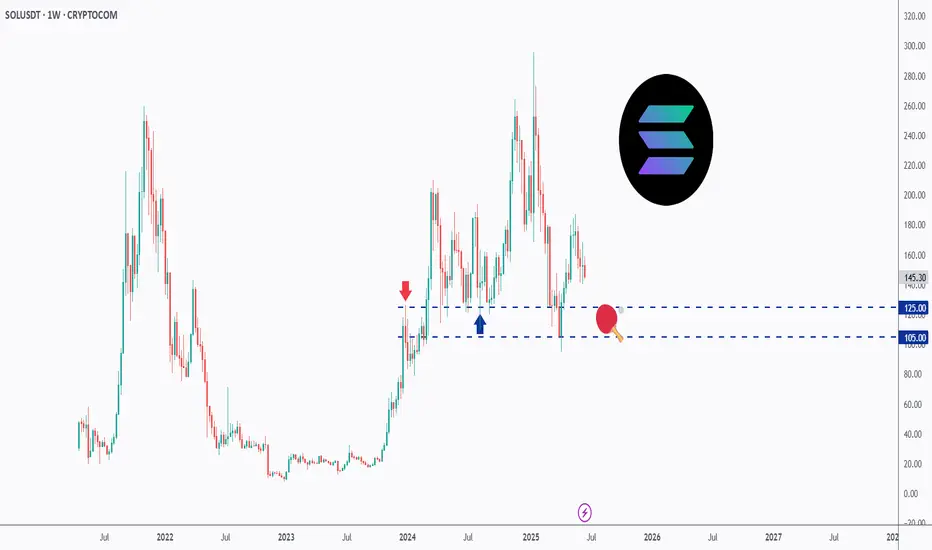
SOL - Playing Ping Pong!Hello TradingView Family / Fellow Traders. This is Richard, also known as theSignalyst.
📈SOL has been trading within a range between $100 and $200 round number.
And it is currently retesting the lower bound of the range which has been acting as a magnet lately.
As SOL approaches the $105 - $125 support zone, and as long as the $105 support holds, we will be looking for longs targeting the $200 round number.
📚 Always follow your trading plan regarding entry, risk management, and trade management.
Good luck!
All Strategies Are Good; If Managed Properly!
~Rich
Axon's Ascent: More Than Meets the Eye?Axon Enterprise, a leader in public safety technology, anticipates a robust first quarter for 2025, with analysts projecting significant increases in revenue and earnings per share. This optimistic outlook builds upon the company's consistent track record of exceeding market expectations in previous quarters. Driving this performance are strong fundamentals, including sustained demand for core TASER products and cartridges, alongside substantial growth in the Software & Sensors division, fueled by expanding user networks, increased adoption of cloud services, and the successful launch of new hardware like the Axon Body 4 camera.
The company actively pursues strategic expansion, entering into key partnerships with entities such as Skydio for drone technology and Ring for community safety integrations. Recent acquisitions, including Dedrone for airspace security, further bolster Axon's comprehensive ecosystem, which is designed to enhance real-time public safety operations. These collaborations and acquisitions, coupled with the introduction of advanced AI-powered tools like Axon Assistant and Draft One, demonstrate Axon's commitment to innovation and its ability to capture new market opportunities, positioning it as a forward-thinking player in the sector.
Investor confidence remains high, evidenced by significant holdings from institutional investors and predominantly positive ratings from Wall Street analysts. This financial backing reflects belief in Axon's growth strategy and its improving profitability profile. While some fringe discussions have attempted to link Axon's trajectory to unrelated societal issues, the company's growth is demonstrably rooted in technological advancement, strategic business development, and meeting the evolving demands of public safety agencies globally. Axon's focus on responsible innovation and building integrated solutions underscores its genuine business drivers.

is APT the next SUI?📌Reason for comparison:
APT (Aptos) and SUI (Sui) are two emerging Layer 1 blockchain platforms that have captured the attention of the crypto community due to their innovative designs and shared heritage.
Both were developed by teams with backgrounds in Facebook’s abandoned Diem project and use the Move programming language, making them natural counterparts.
📌 TA Comparison:
Last year, SUI performed well despite being launched just a few weeks after Aptos.
Will this year belong to Aptos?
If APT follows SUI's price action, we can expect further upside from here after finding the second bottom, as indicated on the chart.
A parabolic movement is likely to begin once APT breaks above the upper boundary of the range.
What are your thoughts?
📚 Always follow your trading plan regarding entry, risk management, and trade management.
Good luck!
All Strategies Are Good; If Managed Properly!
~Rich

The Solana ecosystem continues to thrive...hello friends
This currency, which is from the Solana ecosystem, managed to make a good bottom after a long-term downward trend and managed to hit a new top.
Now that Pullback has stirred, it has provided us with a good opportunity to buy a ladder.
Note that if he keeps his range, he can move to the specified targets.
Dear friends, capital management must be observed.
Be successful and profitable.


ACROSS PROTOCOL (ACX) "connection to UMA"As you'll see on the website for ACX they are powered by UMA. ACS is built using UMA OO (Osnap) a program language to derive the content that created Across Protocol. It is easy to see at the bottom page for Across and also when looking through the ecosystem of UMA on their own website. Fun fact about the newest cryptocurrency listed to Coinbase.

AAPL has IndoChina headwinds SHORTAAPL is here on a 120-minute chart in what appears to be a falling wedge pattern.
As volatility gets compressed further it could break down or break out with a bais for
the latter. I believe that the rise of generic phones in China and Inda with comparable
cameras and other functionality has impacted AAPL as had the rising prices of its
flagship products. Time will tell how this plays out. In the meanwhile, I will consider that
AAPL stays in its wedge and play the top trendline with a short and go long from the
bottom. At present , with price at the upper resistance trendline, I will add to my short
position. I see AAPL staying underneath the 0.5 Fib retracement level of the uptrend for
the time being.

ATOMic Impulse Soon 💣Hello TradingView Family / Fellow Traders. This is Richard, also known as theSignalyst.
📈 ATOM has been overall bullish, trading within the flat rising wedge pattern in black.
Currently, ATOM is in a correction phase, approaching the lower bound of the wedge.
Moreover, it is retesting a strong support and round number $10 in gray.
🏹 Thus, the highlighted Atom logo with the blue arrow is a strong area to look for buy setups as it is the intersection of the gray support and lower black trendline.
📚 As per my trading style:
As #ATOM approaches the blue arrow zone, I will be looking for bullish reversal setups (like a double bottom pattern, trendline break , and so on...)
📚 Always follow your trading plan regarding entry, risk management, and trade management.
Good luck!
All Strategies Are Good; If Managed Properly!
~Rich

INJ - Injecting An Impulse 💉Hello TradingView Family / Fellow Traders. This is Richard, also known as theSignalyst.
📈 INJ has been overall bullish , trading within the flat wedge pattern in red.
Currently, INJ is in a correction phase, approaching the lower bound of the wedge.
Moreover, it is retesting a strong support at $31.5.
🏹 Thus, the highlighted blue circle is a strong area to look for buy setups as it is the intersection of the blue support and lower red trendline.
📚 As per my trading style:
As #INJ approaches the blue circle zone, I will be looking for bullish reversal setups (like a double bottom pattern, trendline break , and so on...)
📚 Always follow your trading plan regarding entry, risk management, and trade management.
Good luck!
All Strategies Are Good; If Managed Properly!
~Rich

BONK: Retest and Potential PUMP !BONK is a Solana-based meme coin that has been gaining popularity in recent weeks. The price of BONK has been on a tear, rising from $0.00000001 to $0.0000023 in a matter of days.
After reaching a high of $0.0000023, BONK experienced a pullback and retested the 4-hour upper resistance trend line. This retest could be a sign that BONK is ready for another leg up.
The AMD setup:
The Wyckoff Accumulation, Manipulation, and Distribution (AMD) setup is a popular technical analysis model that describes the three phases of a market cycle:
Accumulation: During this phase, large buyers accumulate tokens at low prices, often creating a bullish chart pattern.
Manipulation: In this phase, the price is manipulated to create the illusion of a strong uptrend, attracting retail buyers.
Distribution: In this phase, the large buyers sell their tokens at high prices, causing the price to dump.
The current BONK chart:
The current BONK chart shows that the price has been following the AMD setup.
Accumulation: The price accumulated in a horizontal range for several weeks.
Manipulation: The price broke out of the range and rallied sharply.
Distribution: The price pulled back and retested the upper resistance trend line.
Why this is a good time to buy:
Retest: The retest of the upper resistance trend line provides a good entry opportunity.
Volume: The volume is increasing, which is a sign of strength.
Social media hype: There is a lot of hype surrounding BONK on social media, which could provide additional fuel for the rally.
Conclusion:
BONK has been following the AMD setup and is currently retesting the upper resistance trend line. This could be a good time to buy in anticipation of another leg up. However, investors should always do their own research and exercise caution before investing in any cryptocurrency.

$SSE is on the way to reach 30 centsHello Guys,
I am going to analysis chart #SSE token in daily time frame As you can sse the volume is increasing in Bitmart and BingX and potential targets for 2024 are around the area of $0.15 - $0.30
The chart on Bitmart is not clean but in the BingX you can see the chart more reliable and analysis important levels.
According to the fundamental analysis, SSE is the utility token of Soroosh Smart Ecosystem and using as a payment method and Staking and transaction fee in SorooshApp.
So my forecasting is the team are developing the project fast and significant demand gonna be generated for the token according to the project roadmap.
Good Entry levels are around 0.0065 - 0.0080 and it could be growth more than 500% from this levels by the end of 2024
See you in the next technical analysis guys

Coins that are expanding the coin ecosystemHello traders!
If you "Follow" us, you can always get new information quickly.
Please also click “Boost”.
Have a good day.
-------------------------------------
The altcoins that I am thinking of that are expanding the coin ecosystem are as follows.
BNB, XRP, ADA, SOL, DOT, TRX, AVAX, MATIC, NEAR, ATOM, ALGO, KLAY, FTM, LINK, OP, WEMIX
Since BTC and ETH are long-term investment coins, it is always best to have a large amount of them.
BNB Coin is also a mid-term investment coin, but it has the disadvantage of being an exchange coin, so I think it is difficult to be a long-term investment coin like BTC and ETH.
Therefore, please refer to the information explained below.
Coins (tokens) that are expanding the coin ecosystem can be traded in the mid- to long-term in the direction of increasing the number of coins (tokens) corresponding to profits, if possible.
In particular, I think that XRP, ADA, TRX, KLAY, OP, and WEMIX coins should focus on increasing the number of coins for profit.
The reason is that each coin contains definite drawbacks.
(OPUSDT chart)
The key is whether the price can be maintained by rising above 2.289.
(1D chart)
To do so, the key is whether it can rise above the 2.125-2.176 range.
If not, and it falls, you should check for support around 1.926.
--------------------------------------------------
- The big picture
The full-fledged upward trend is expected to begin when the price rises above 29K.
This is the section expected to be touched in the next bull market, 81K-95K.
-------------------------------------------------- -------------------------------------------
** All explanations are for reference only and do not guarantee profit or loss in investment.
** Trading volume is displayed as a candle body based on 10EMA.
How to display (in order from darkest to darkest)
More than 3 times the trading volume of 10EMA > 2.5 times > 2.0 times > 1.25 times > Trading volume below 10EMA
** Even if you know other people’s know-how, it takes a considerable amount of time to make it your own.
** This chart was created using my know-how.
---------------------------------

Dance of DOT and KSM: Unveiling the Symbiotic Symphony of GrowtIn the vibrant realm of blockchain ecosystems, Polkadot (DOT) and Kusama (KSM) take center stage, showcasing a fascinating symbiotic relationship. While their charts may dance to similar tunes, the nuances reveal DOT's resilience and strength, outshining KSM in both resilience during downturns and vigor in uptrends.
Chart Analysis: The Symbiotic Symphony Unraveled
Synchronized Patterns:
DOT and KSM, being integral parts of the Polkadot ecosystem, exhibit synchronized chart patterns.
Both coins share similarities, yet the intricacies of their individual performances unveil a unique narrative.
DOT's Resilience:
During market downturns, DOT has showcased remarkable resilience, holding steadfast above critical support levels.
The global uptrend support maintained by DOT contributed to its ability to weather storms more effectively than KSM.
Comparative Strength: Decoding the Chart Dynamics
Global Uptrend Support:
DOT's ability to maintain a robust global uptrend support has been a key factor in its relative strength.
KSM, in contrast, experienced deeper retracements, testing lower support levels during market corrections.
Impact on Growth Trajectory:
The sustained global uptrend support for DOT has influenced its growth trajectory positively.
DOT's consistent strength has resulted in a notable lead, with a 20-30% advantage in growth compared to KSM.
Strategic Considerations: Navigating the DOT-KSM Symbiosis
Investment Strategies:
Investors may consider the relative strength of DOT as a factor in their investment decisions.
DOT's resilience during market fluctuations suggests potential for sustained growth compared to KSM.
Risk Management:
Traders and investors could employ strategic risk management, factoring in the divergent resilience of DOT and KSM during market volatility.
Understanding the individual dynamics of each coin enhances risk assessment.
Conclusion: DOT's Resonant Strength in the Symbiotic Harmony
In the intricate dance between DOT and KSM, Polkadot emerges as the resounding leader, demonstrating resilience and strength. The synchronized patterns of these ecosystem companions tell a tale of interconnected growth, with DOT leading the way, offering a distinct advantage in both stability and upward momentum.
🌐 Synchronized Patterns | 🌟 DOT's Resilience vs. KSM | 📈 Impact on Growth Trajectory
❗See related ideas below❗
Share your insights on the DOT-KSM symbiosis and engage in discussions about the strategic considerations for navigating this dynamic relationship. 💚🌐💚

XDB: $0.0017 | an under loved issue yet Adored by BIG SHOTSTOKENiZATiON of the world .. and XDB has the infra to make it happen for companies and brands to transition in the blockchain space
think Publicis or Satchi & Satchi BRANDING strategy of Coke Starbuck etc.. only this XDB is the backbone to migrate to the new world
Cap: $5M
Supply: 20bn coins
Float: 15% Regulated
Strategy: dca
Tactic: eye on green VOLUME bar after series of RED bars end on the WEEKLY
Upside: 50x
Bonus: 100x
Sureplay: 10x
Catalyst: BTC breaking Out

RAE 1.15 a Youtube alternative for next generation great project for influencers to get rewarded
it's a fine subscription model that benefits everyone from fans to investors to artist etc..

History will repeat? $182 or $110Monthly Chart
Binance Coin ( BINANCE:BNBUSDT ) is trading around $236 now.
It's dropped from $398.3 and in accumulating
Look back to the history. I see two drops on Jan 2018 and Jun 2019, both of them has the same percent are about 83.64% and 83.89%.
History usually repeats itself!
I wonder how's about this time?
Now, BNB/USDT in Descending Channel and it's support zones by Fib Channel (1.0) and last Swing Month Low $183.4
Supports can hold it and made it bounced back or Binance Coin will break down and drop to around $110.
Wait and see

Coin market theme!!! About coin ecosystemHello?
Traders, welcome.
If you "Follow", you can always get new information quickly.
Please also click "Boost".
Have a nice day.
-------------------------------------
As the coin market goes through rising and falling markets, many themes are being created.
These themes are expanding the interconnected coin ecosystem under the name of ecosystem.
Therefore, I think that the coin market is highly likely to have a circulation pump of theme coins after the rising market next year.
Numerous coins (tokens) are being created and also disappearing.
In order to survive in this situation, they are trying to increase their viability by creating and expanding a coin ecosystem.
Apart from this trend, there are coins (tokens) that do not belong to any coin ecosystem.
When trading coins (tokens) that are continuing to survive independently, I think you should invest in a short-term perspective or trade in a trading method that increases the number of coins (tokens) corresponding to profit while recovering the principal amount as much as possible.
Otherwise, you have to be careful because when and how you can plunge and never recover again.
Existing investment companies, institutional investors, and whales are gradually eating into the coin market due to funds entering the coin market through USDC and newly launched coin investment products in the stock market.
These funds will make more individual investors invest in the investment market, but it is expected that the time when individual investors earn large profits by trading on their own will gradually decrease.
There will come a time when individual investors will have less and less information available, and they will have to follow in their footsteps and trade with information provided by investment companies, institutional investors, and whales.
I believe this movement is unstoppable.
Therefore, from now on, it is necessary to find the coins (tokens) that are expanding the coin ecosystem (ecosystem) that is being formed and tie them together to figure out what kind of circulation pumping will occur.
As before, it is expected that the roadmap of one coin (token) or such technical stories from the foundation will no longer be able to move the hearts of investors.
Among these coin ecosystems, the ones we are interested in are as follows.
Ethereum Ecosystem
BNB chain Ecosystem
Cardano Ecosystem
Solana Ecosystem
Polkadot Ecosystem
TRON Ecosystem
Avalanche Ecosystem
Polygon Ecosystem
Near Protocol Ecosystem
Cosmos Ecosystem
Fantom Ecosystem
Optimism Ecosystem
As above, it is an 11 coin ecosystem.
Representative coins of the coin ecosystem are as follows.
BTC
ETH
BNB
ADA
SOL
DOT
TRX
AVAX
MATIC
NEAR
ATOM
FTM
OP
In addition, it is a coin that has the potential to create coins and coin ecosystems with large user communities.
XRP
ALGO
KLAY
Among the coins belonging to most of the current coin ecosystems, LINK is a representative coin.
However, due to the coin's own issue, the coins that need to increase the number of coins (tokens) corresponding to profits while recovering the purchase principal as much as possible are as follows.
XRP
SOL
TRX
KLAY
OP
The above coins (tokens) have self-restraint issues, so I don't think it's good to trade them with the traditional trading method.
Of these, the OP token has just been created in the coin ecosystem, so I think a trading method is needed to increase the number of coins (tokens) corresponding to the profit while recovering the purchase principal as much as possible, at least until the next wave.
In conclusion, the coin market will start to be flooded with information comparable to the stock market after the bull market next year.
In this situation, in order to earn steady profits in the coin market, you need to start paying attention to a newly changing theme, the coin ecosystem.
-------------------------------------------------- -------------------------------------------
** All descriptions are for reference only and do not guarantee profit or loss in investment.
** If you share this chart, you can use the indicators normally.
** The MRHAB-T indicator includes indicators that indicate points of support and resistance.
** Check the formulas for the MS-Signal, HA-Low, and HA-High indicators at ().
** SR_R_C indicators are displayed as StochRSI (line), RSI (columns), and CCI (bgcolor).
** The CCI indicator is displayed in the overbought section (CCI > +100) and oversold section (CCI < -100).
(Short-term Stop Loss can be said to be a point where profit or loss can be preserved or additional entry can be made by split trading. This is a short-term investment perspective.)
---------------------------------
