Let's play with Fibonacci Price Theory & EPP PatternsThis video is an update for the SPX500 and Bitcoin - showing you how price structure tells you everything you need to know about the markets and which direction you need to stay focused on.
For me, trading is about learning to identify where the next big move is going to be and how I can position my trades to benefit from that move. It is not about chasing 20-50 minute trends. I'm going for the bigger price swings and I want to safely deploy my capital to profit from those moves.
I teach these techniques to help traders understand PRICE is all you need to focus on. Sure, other indicators are interesting and useful to help you understand where and how price may move in the future. But I believe PRICE tells us everything we need to know.
Watch this video. Ask questions if you have any.
Learning to use PRICE as an indicator is critically important.
GET SOME!
Community ideas

TEL THEORY: SURFING THE WAVES OF CERTAINTYPEACE to all the viewers of this publishing. in this post i will share a philosophical, and most importantly a safe practical way to to participate in the wonderful land we call the markets. im under the assumption that the viewers are novice to expert traders so depth can be found at all levels of traders. with that being said lets begin.
in many post i attempt to dismantle retail of conceptions of trading to put the trader in a new space where they can feel safe to operate. here will be no different. in my attempt to deconstruct retail models i will highlight how what i present today can be used to complete all other models but NO OTHER RETAIL entry mechanism(what most retail traders call a set up or a full strategy to the market they trade).
PHILOSOPHY: Trading = real-time wave alignment across information fields.
DEFINITIONS-
1. Transverse Waves (up–down motion) LOOK AT CHART.
Visual:
Wave moves →
Amplitude moves ↑↓
Examples:
Light waves
Water surface waves
EM fields
Trading parallel:
Price candles (what you see)
Volatility spikes
Emotional reaction waves
These are surface expressions.
2.2. Longitudinal Waves (back–forth compression)
Oscillation is parallel to direction of travel
Examples:
Sound waves
Pressure waves
Shockwaves
Moves as compression and rarefaction
Trading parallel:
Liquidity compression
Accumulation / distribution
That “pressure in the head or gut” you feel
This is the hidden driver.
3. Standing Waves (structure formation)
Examples:
Guitar strings
Room acoustics
Atomic orbitals
Key trait:
Nodes (still points)
Antinodes (max oscillation)
Energy oscillates without traveling
Trading parallel:
Ranges
Consolidation
This is where structure lives.
Ranges are not “indecision.”
They are standing information waves.
4. Interference Waves
Types:
Constructive (amplitude increases)
Destructive (amplitude cancels/decreases)
Trading parallel:
Trend acceleration (constructive)
Chop (destructive)
Fakeouts (partial cancellation)
That nauseous chop feeling?
That’s destructive interference.
Now: oscillation mechanics (this is where peaks & troughs come from)
Every wave—no matter the type—has the same core components:
• Amplitude
→ Energy / strength
→ In trading: volatility, conviction,
• Frequency
→ How often it oscillates
→ In trading: pacing, session rhythm
• Phase
→ Where you are in the cycle
→ In trading: timing
Being right but early = correct wave, wrong phase.
A peak is NOT “overbought”
It is:
Maximum displacement from equilibrium
Translation:
Max emotional extension
Max liquidity imbalance
Max informational asymmetry
A trough is NOT “oversold”
It is:
Maximum counter-displacement
Constructing vs deconstructing waves (THIS is the key insight)
🔨 Constructing waves
Happens when:
Multiple frequencies align
Phases synchronize
Energy stacks
In markets:
London + NY alignment
HTF bias + LTF execution
Narrative + liquidity + timing
This is when moves feel inevitable.
🧨 Deconstructing waves
Happens when:
Frequencies desync
Phases misalign
Energy cancels
In markets:
Chop
Failed breakouts
False urgency
Geometry of waves (why this matters to you)
1.Waves aren’t lines.
2.They’re functions in space and time.
Trading-the act of processing information in real time to align with a certain event over a window.
now lets take it one step furthuer: WAVE MECHANICS
The first thing you must understand about trading the chaotice waves of the market is to know the laws of the domain you are operating in. the best is to atleast have a concept of a time series analysis/ Fourier analysis (decomposing waves into frequencies)
The core idea (no math yet) :Any complex wave — no matter how chaotic it looks — is actually the sum of many simple waves at different frequencies.
One big slow wave (structure)
Several medium waves (sessions, ranges)
Many fast waves (noise, microstructure)
Fourier analysis answers one question:
What frequencies are currently active in this system?
Trading translation
A “messy” chart = many frequencies interfering
A clean trend = one dominant frequency
Chop = competing frequencies with similar energy
What you feel as clarity vs overload is your nervous system sensing:
frequency dominance
not direction
That’s why:
Some days feel obvious instantly
Other days feel exhausting even if price moves
You’re not wrong — the spectrum is crowded.
Key insight:
Price charts are time-domain views.
Your intuition is reading the frequency-domain view
2. Harmonics — why patterns repeat but don’t copy
What harmonics are
When a fundamental wave exists, it automatically generates related waves at integer multiples:
Fundamental (base rhythm)
2×, 3×, 4× harmonics (overtones)
In music: this is why a note has character.
In markets: this is why patterns rhyme.
Trading translation
HTF bias = fundamental frequency
LTF setups = harmonics
Session windows = harmonic gates
3.Coupled Oscillators — why markets sync and desync
What coupled oscillators are
When oscillating systems interact, they tend to:
Sync up (phase lock)
Drift
Or destabilize
Examples:
Pendulums on the same table
Fireflies flashing
Heart cells beating
Trading translation
Markets are coupled oscillators:
Asia ↔ London ↔ New York
Indices ↔ FX ↔ Bonds
Narrative ↔ liquidity ↔ execution
This explains:
Why London sets up NY
Why NY reverses Asia
Why some weeks feel globally “in sync”
When oscillators lock:
Trends accelerate
Volatility expands
Direction feels certain
When they desync:
Chop
Fakeouts
Conflicting signals
FINALLY THE FUN PART THATS STILL PRATICAL.
1. SIMPLE INTRADAY MODEL.
MEASURE THE ASAIN RANGE 7PM-3AM(CLOSE OF 2AM CANDLE IF USING 1HR.)
USE A FIB AND MEASURE THE RANGE IN ITS DIRECTION BULLISH OR BEARISH. SIMPLY ADD THE -25 AND 132%. the -25% is your first target and the 132 will be a structure limit. not your stop loss. meaning the 132 is where you would see the "liquidity sweep" type of move. if you want an absolute structural level then use the 168% as a stop but as you will quickly see that the RR aren't too good with that sl.
statistically the -25 gets hit 85+5 of time with deeper extensions maintaing accuracy( through simple testing you will quickly find deeper levels the -25 is the clue to deeper understanding.
and statistically the 132% gets hit 76% of the time.
UNTIL THE NEXT TRANSMISSION

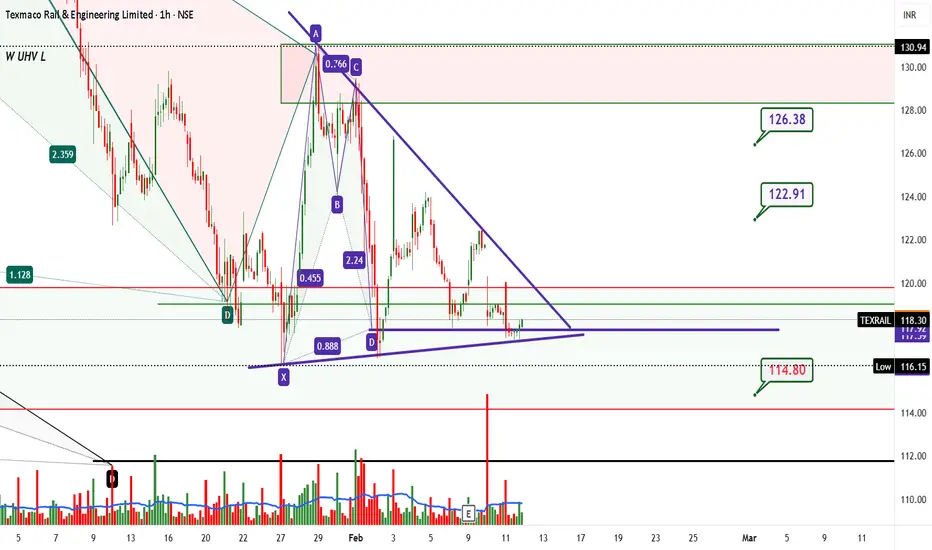
TEXRAIL 1HRStrong Potential Reversal Zone
Confluence of Daily Bullish crab i.e RED Zone and 4HR Bullish shark@1.13XA i.e GREEN LINE with 1HR Bullish Bat i.e BLUE LINES strong reversal took place 3 times with
strong tren d line support to BUY with those TARGETS and SL
Profitable GBPUSD Forex Trading Strategy Explained
Want a profitable pullback trading strategy for GBP/USD Forex pair?
I will show you a very accurate method using simple support and resistance and price action analysis.
We will start with a theory for beginners and I will explain to you the e xact setup and the signal that you should look for.
Then, I will show you a real trading signal on GBPUSD that we spotted on a live stream with my students.
Market Analysis
For this pullback strategy, we will use 2 time frames.
A daily time frame for analysis and hourly time frame for entry confirmation.
Your main task on a daily time frame will be to analyze supports and resistances.
In up-trend, I suggest trading from supports
and in a down-trend, I recommend selling from resistances .
That is how a complete daily time frame analysis should look.
I spotted significant support and resistance zones and identified the market trend on a daily chart.
Signal to Buy
After the identification of supports and resistances, wait for its test.
We will look for a pullback strictly from these structures.
After a test, start analysing the hourly time frame for a confirmation.
Your buy signal on support will be a formation of any bullish price action patter n.
The best ones are inverted head and shoulders, double & triple bottom, ascending triangle and cup & handle.
Neckline breakout of the pattern will be your signal to buy.
Target will be the closest intraday strong resistance,
stop loss below the lows , entry on a retest .
Signal to Sell
Your sell signal from resistance will be a formation of a bearish price action pattern on that on an hourly.
Here are the best patterns: head and shoulders, double & triple top, descending triangle, inverted cup & handle.
Neckline breakout of the pattern will be your signal to sell.
Target will be the closest intraday strong support,
stop loss above the highs, entry on a retest.
Trade Example
Following these simple rules, we found a trading setup on GBPUSD with my students on a live stream.
Trading in uptrend, GBPUSD tested a key daily support.
Following the rules of our strategy, we started looking for a confirmation signal on 1H chart. The price formed a double bottom pattern.
Long trade was opened after a breakout of a neckline, on its retest.
SL was below pattern lows, TP was a the closest strong intraday resistance.
And here is what happened after a couple of hours.
More than 70 pips of profit were made.
Most traders use the wrong entry rules for trading pullbacks.
This strategy is Clean, Simple, Profitable.
It will help you to easily trade pullback on GBPUSD or any other forex pair
❤️Please, support my work with like, thank you!❤️
I am part of Trade Nation's Influencer program and receive a monthly fee for using their TradingView charts in my analysis.

Boring Trading Builds Real WealthHollywood has lied to everyone about financial markets. We expect shouting, broken keyboards, and constant adrenaline. Real professional trading looks nothing like that. It looks like a quiet office job. True consistency is actually quite boring.
If you feel a rush of excitement when you click the buy button, you are in danger. You have confused a business with a casino. The market charges a very high price for entertainment.
Recognize the Gambling Mindset
Most traders do not fail because they lack technical knowledge. They fail because they cannot handle their own chemistry. Dopamine is the enemy of your bank account.
Check yourself for these red flags:
- Your heart rate increases when entering a trade.
- You feel a need to recover losses immediately.
- You enter the market just to feel involved.
- If you recognize these signs, stop immediately. You are providing liquidity for the professionals.
The Art of Doing Nothing
There is a dangerous myth that you must always be in a trade to make money. This is false. Cash is a valid trading position. It protects your capital for the right moment.
Amateurs try to catch every market swing. They fear missing out on a move more than they fear losing money. This is FOMO. It forces you to buy at the top and sell at the bottom.
Sniper Versus Machine Gunner
Imagine a machine gunner firing wildly into the dark. They waste ammunition and reveal their position. Now imagine a sniper. They wait for days for a single perfect target.
Professional trading requires the patience of a sniper:
- Wait for the setup to come to you.
- Ignore price action that does not match your plan.
- Preserve your capital for high-probability scenarios.
- If a chart only matches 80 percent of your criteria, you must pass. Missing a trade is not a loss. It is discipline.
Process Over Outcome
The market is chaotic and infinite. You cannot control price action. You can only control your reaction to it. Discipline means following your rules when every emotion tells you to do the opposite.
Shift your focus entirely. Stop thinking about the money you want to make. Focus only on executing your system perfectly. Profit is just the byproduct of a boring, repetitive, and well-executed routine.
Boredom is your best indicator of success.

The Simplest, Most Reliable, and Highest Frequency way to TradeGet back to basics, avoid overcomplicating to profit, and trade using old school ways!

How to properly assess the underlying trend of the US dollar?Within global high finance, analysts in the floating foreign exchange (Forex) market use a currency index to analyze and determine the underlying trend of the US dollar. This is the well-known “DXY”, the index measuring the US dollar against a basket of major currencies. However, one should not limit the analysis of the US dollar’s trend solely to the DXY. Indeed, the latter reflects the dollar’s trend against Western currencies, notably the euro, the Japanese yen, and the British pound.
It therefore seems relevant to me to include major emerging market currencies in the analysis, so-called “core” currencies such as the Chinese yuan or the Indian rupee. In this analysis, I propose a table that summarizes the underlying trend of the US dollar using the DXY as well as its performance against the six major so-called emerging currencies.
Ultimately, when a weighted average of all these trends is calculated, it can be observed that, at the current stage, the underlying trend of the US dollar remains bearish, particularly against the euro and the yuan renminbi.
The underlying trend of the US dollar must therefore be the synthesis of:
• The underlying trend of the US dollar (DXY)
• The underlying trend against the main emerging market currencies
This approach makes it possible to avoid a common bias in macro-monetary analysis, which consists of equating the strength of the dollar solely with its evolution against developed currencies. However, the center of gravity of global growth has shifted over several decades toward emerging economies, both in terms of international trade and capital flows. Ignoring these currencies therefore amounts to analyzing the dollar through a partial and sometimes misleading prism.
“Core” emerging market currencies play a key role because they combine market depth, geopolitical importance, and structural economic weight. The Chinese yuan, for example, is directly linked to global trade dynamics and China’s monetary strategy. The Indian rupee, for its part, reflects the trajectory of an economy with strong demographic and industrial growth. The Brazilian real, the Mexican peso, and the South African rand also provide complementary insight into global risk appetite or aversion.
The value of a summary table, such as the one presented, lies in its ability to quickly visualize trend divergences between the dollar and these different monetary areas. When the dollar weakens simultaneously against several emerging currencies while showing signs of fragility against the euro, the macro signal becomes more robust than that provided by the DXY alone. Conversely, dollar strength concentrated solely on certain safe-haven currencies can mask a more nuanced underlying dynamic.
It is also essential to recall that the weighting of the DXY gives a predominant place to the euro, which can artificially amplify or dampen the perception of the dollar’s overall trend.
DISCLAIMER:
This content is intended for individuals who are familiar with financial markets and instruments and is for information purposes only. The presented idea (including market commentary, market data and observations) is not a work product of any research department of Swissquote or its affiliates. This material is intended to highlight market action and does not constitute investment, legal or tax advice. If you are a retail investor or lack experience in trading complex financial products, it is advisable to seek professional advice from licensed advisor before making any financial decisions.
This content is not intended to manipulate the market or encourage any specific financial behavior.
Swissquote makes no representation or warranty as to the quality, completeness, accuracy, comprehensiveness or non-infringement of such content. The views expressed are those of the consultant and are provided for educational purposes only. Any information provided relating to a product or market should not be construed as recommending an investment strategy or transaction. Past performance is not a guarantee of future results.
Swissquote and its employees and representatives shall in no event be held liable for any damages or losses arising directly or indirectly from decisions made on the basis of this content.
The use of any third-party brands or trademarks is for information only and does not imply endorsement by Swissquote, or that the trademark owner has authorised Swissquote to promote its products or services.
Swissquote is the marketing brand for the activities of Swissquote Bank Ltd (Switzerland) regulated by FINMA, Swissquote Capital Markets Limited regulated by CySEC (Cyprus), Swissquote Bank Europe SA (Luxembourg) regulated by the CSSF, Swissquote Ltd (UK) regulated by the FCA, Swissquote Financial Services (Malta) Ltd regulated by the Malta Financial Services Authority, Swissquote MEA Ltd. (UAE) regulated by the Dubai Financial Services Authority, Swissquote Pte Ltd (Singapore) regulated by the Monetary Authority of Singapore, Swissquote Asia Limited (Hong Kong) licensed by the Hong Kong Securities and Futures Commission (SFC) and Swissquote South Africa (Pty) Ltd supervised by the FSCA.
Products and services of Swissquote are only intended for those permitted to receive them under local law.
All investments carry a degree of risk. The risk of loss in trading or holding financial instruments can be substantial. The value of financial instruments, including but not limited to stocks, bonds, cryptocurrencies, and other assets, can fluctuate both upwards and downwards. There is a significant risk of financial loss when buying, selling, holding, staking, or investing in these instruments. SQBE makes no recommendations regarding any specific investment, transaction, or the use of any particular investment strategy.
CFDs are complex instruments and come with a high risk of losing money rapidly due to leverage. The vast majority of retail client accounts suffer capital losses when trading in CFDs. You should consider whether you understand how CFDs work and whether you can afford to take the high risk of losing your money.
Digital Assets are unregulated in most countries and consumer protection rules may not apply. As highly volatile speculative investments, Digital Assets are not suitable for investors without a high-risk tolerance. Make sure you understand each Digital Asset before you trade.
Cryptocurrencies are not considered legal tender in some jurisdictions and are subject to regulatory uncertainties.
The use of Internet-based systems can involve high risks, including, but not limited to, fraud, cyber-attacks, network and communication failures, as well as identity theft and phishing attacks related to crypto-assets.

Designing a Trading Process You Can ScaleA scalable trading process is built to function independently of mood, focus, or screen time. Many traders remain inconsistent because results depend on how alert they feel or how closely they watch price. That approach does not scale. A process that scales is one where decisions are defined in advance, execution follows fixed rules, and outcomes can be evaluated objectively. The trader executes the process rather than improvising inside it.
The foundation of scalability is clear role separation. Analysis, execution, and review must operate as distinct phases with defined inputs and outputs. Analysis establishes context. It answers where the market is positioned, which conditions are active, and which areas matter. Execution exists only to act on pre-approved conditions with predefined risk. Review evaluates whether rules were followed and whether the process behaved as expected. When these phases overlap, emotional interpretation enters the workflow and consistency breaks down.
The next requirement is standardized inputs. A scalable process uses the same timeframes, the same market types, and the same session windows every day. It does not scan endlessly for opportunity or adapt rules based on boredom. Instead, it waits for price to reach predefined locations under known conditions. This reduces trade frequency, but it increases signal quality and mental clarity. Fewer decisions lead to higher execution accuracy.
Risk rules are the structural backbone of scalability. Fixed risk per trade, daily loss limits, and exposure caps ensure that no single decision can materially damage the system. These rules must be non-negotiable. They protect the process during drawdowns and prevent emotional recovery behavior. A strategy that cannot survive losing periods without modification is not scalable, regardless of its upside.
A scalable process also defines when not to trade. Conditions such as low volatility, unfavorable sessions, or unclear structure should be explicitly excluded. This prevents forced participation and preserves capital for higher-quality environments. Discipline is reinforced not by activity, but by selective absence.
Finally, the process must be transferable. A scalable framework can be written, explained, and followed by someone else. If your edge exists only in intuition or experience, growth is capped. When rules are documented, tested, and reviewed, improvement becomes systematic. Performance feedback becomes actionable rather than emotional.
Scaling in trading is not about increasing trade count or leverage. It is about building a process that holds up under repetition, pressure, and time. When execution no longer depends on how you feel, consistency becomes a natural outcome rather than a constant struggle.
Keep it short, keep it simple and avoid unnecessary mistakes is the path to greatness. 💚

Become a Successful Trader- Full Course in 10 minutesThis is not an advert, this is my entire trading curriculum taught as a lesson live on trading view to help you guys out. This covers your motivation for trading, trading maths (risk of ruin, variance, expected value, game theory), momentum structures to read price action correctly, Money Makers (key levels to target for liquidity and why) and finally managing trades and yourself through journaling and trendlines.
Hopefully this is a great starting point for you guys and you get value from this!

Prop trading: capital under management or self-insurance?The market is changing rapidly, not gradually — it knows how to switch . Yesterday there were neat breakouts and trend continuations, today there are sudden shoots, sharp reversals, knocking out stops and moving on the news, which you will see after the candle has made a maximum and a minimum at the same time.
There is a lot of talk right now that the market has become more manipulative, nervous and volatile . And let someone argue with the wording, the essence remains: in such conditions, it is not the smartest and not the fastest who survives, but the one who respects the risk .
And here prop trading suddenly stops being a fashionable way to get money fast , and begins to look like ...** a protective contour . And not only for beginners, but also for strong traders who have already seen how easily the market takes away capital from those who decide to break the rules a little .
Disclaimer: the material is educational. Not an investment council.
1) What is prop trading really?
Prop trading (proprietary trading) — trading on the company's capital. In classical logic, everything is simple:
the firm allocates capital (or gives a risk limit),
the trader trades according to the rules,
profits are divided by agreement,
Loss is limited: there is a loss limit after which trading stops or conditions become tougher.
The main truth about prop sounds dry, but it's more important than all the advertising:
A prop firm does not buy signals — it buys manageable risk .
A stable trader is more valuable to a company than a genius who sometimes makes X's, but periodically makes a “peak" in drawdown.
---
2) Why prop has become relevant again right now
There is a feeling that the market has become tougher towards discipline in recent years. And this is evident from the typical stories.
Previously, you could afford to disrupt the risk a little bit : increase the leverage, move the stop, sit out the negative - and sometimes the market returned. Today, such a number increasingly ends the same way: a sharp move against a position , a series of liquidations, and you look at the chart not as a trader, but as a person who has just dropped an important thing from his hands.
Many previously successful traders lost deposits not because they forgot how to analyze, but because:
stopped complying with the risk,
began to catch up with the market,
confused confidence in the setup with the right to ignore the stop.
And against this background, the professionals had a very pragmatic idea.:
what if we stop substituting fixed assets for a series of mistakes or a “bad phase of the market"?
Hence the new perspective on prop: a prop firm is not easy money , but a way to take the risk of capital loss outside , keeping for yourself what you know how to trade.
The meaning is simple:
you risk your capital minimally (the cost of an attempt/subscription),
and you work at a volume that would otherwise be psychologically and financially too dangerous,
in fact, you shift the risk of a complete loss of the deposit to the prop rules.
---
3) The two worlds of prop firms: Don't confuse them
Today, the word prop firm refers to very different models.
A) Classic prop desks (traditional prop)
more often offline or hybrid,
selection through an interview/internship/verification of real trading,
capital is really “branded”, relationships are built for a long time.
Advantages: A more transparent model, less marketing, and a higher chance of a real career .
Disadvantages: harder to get in, stricter requirements, sometimes limited markets/instruments.
B) Online prop with challenges (evaluation model)
entry through a paid assessment,
Strict drawdown/day/series limits,
After completing the course, you will receive a “funded” account and profit-split payments.
Advantages: Accessibility, quick start, clear “entrance ticket".
Disadvantages: the rules are sometimes designed so that you compete not with the market, but with the mathematics of the rules.
---
4) A new class of traders: acceleration from $100 to “millions”
There is another reason why the prop theme has become popular: the market has brought a whole wave of people who sincerely believe that trading is overclocking .
You've probably seen these scenarios:
deposit of $100–$300,
shoulder 50–100x,
An all-or-nothing bet,
a few successful attempts — and the feeling that the grail has been found,
then one candle, and “why am I always being carried out?”
The problem is not that overclocking is impossible as a fact. The problem is that:
luck can be repeated a couple of times ,
but system trading cannot be built on a constant huge risk , because mathematics and variance will catch up with you.
The market can deliver a series of victories. But the market has never signed a contract to forgive such maneuvers . Sooner or later, the inevitable happens: one impulse against a position erases everything.
And that's where prop firms turn out to be for different :
A prop can give a beginner discipline and a loss ceiling (if he is willing to obey the rules),
experienced — to protect the fixed capital from a period of mistakes, emotions or the wrong phase .
5) What are you really paying for in the prop model
Prop is sold as capital , but in reality you are buying a combination of four things:
1. A risk framework (restrictions that cannot be persuaded)
Prop does not allow you to “merge everything to zero”. And sometimes it saves you from the most dangerous enemy— your own impulse.
2. The psychological contract
When you know that you will be turned off for a certain drawdown, you suddenly begin to respect the stop.
3. Infrastructure and access (not always)
Some models have a platform, data, fees, and conditions.
4. Funnel (if the business is built on paying for attempts)
If the company earns mainly on challenges, you are the client. If you are a trader, you are a partner. These are different worlds.
---
6) The advantages of prop trading when it suits your style
✅ Limited worst case scenario
Ideally, you only risk the cost of the attempt, not the entire deposit.
✅ Discipline is built into the rules
You don't need to reassemble your willpower every day. The frame will do it for you.
✅ Rapid growth of responsibility
You start thinking like a risk manager, not an X-hunter.
✅ Potential scalability
If you are stable, the company can increase the limits / give more accounts / improve the conditions.
---
7) Cons and pitfalls: Where even the strong ones break
## The main enemy is not the market, but the rules
Many fail not according to strategy, but according to the mechanics of limits.:
daily loss limit,
maximum drawdown,
equity calculation (including floating minus),
bans on news/overnight/weekend,
requirements for consistency.
The same regulation can be the norm for a scalper and a death sentence for a swing trader.
❌ Trailing drawdown is a hidden mine
If the maximum drawdown is considered from the peak of equity (and tightens after your profit), an unpleasant paradox arises: you have earned — and the usual rollback of the strategy begins to look like a violation.
This changes behavior: the trader is afraid of normal pullbacks, closes profits too early, and worsens expectations.
## Conflict of interest in the evaluation model
If a company earns mainly by paying for attempts, it is beneficial for it that there are many attempts, but only a few pass.
## Execution, spreads and toxic flow
Delays, widening spreads, paragraphs about “abuse” and latency — all this should be read in advance, not after problems.
❌ Consistency as a KPI trap
Restrictions on an “overly profitable day” can provoke overtrading and trading for the sake of the report.
8) Who is prop suitable for and who is not
### Suitable if you:
you already know how to trade and want to scale the risk without threatening the fixed capital,
understand the series, the variance, the inevitability of drawdowns,
ready to live by the rules.
### Not suitable if you:
looking for “magic capital" without a system,
trading martingale/averaging without restrictions,
emotionally “catching up” after the cons,
not ready to read the rules as a legal document.
---
9) The checklist: what to watch BEFORE payment
A) The mathematics of constraints
* Drawdown: fixed or trailing? by balance or equity?
* daily limit: on closed trades or on floating PnL?
* what happens in case of violation: closing positions or blocking?
* minimum trading days? a one-day profit limit? consistency?
B) Terms of trade
* fees/spreads, especially on volatility,
* is it possible to trade news,
* is it possible to hold positions through the night/weekend,
* Style restrictions: scalping, arbitration, copying.
C) Payments and legal aid
* payment frequency, minimum threshold, KYC,
* conditions for canceling payments in case of “violations”,
* reputation and payment history (preferably verifiable).
---
10) How to trade prop in an adult way so that it helps, not hinders
1) Choose a company for the style, not the style for the company.
A swing trader in tight daily limits will suffer.
2) Immediately build a risk plan for the limits.
Not “how much I want to earn", but:
what is the risk of the transaction,
how many cons are allowed in a row,
where is the stop for the day,
what I do after the series.
3) Not to “finish off the target”, but to protect statistics.
The best prop trader is not the one who made x, but the one who does not break down in a bad week.
4) Keep a journal as a risk manager.
Reason for entry, invalidator, violation of rules, quality of execution.
---
All the arguments about prop trading sound easy on paper. But the market doesn't read the articles — the market checks in practice. Therefore, we decided not to limit ourselves to theory.
Our team also accepted the challenge of the time and decided to go all the way from the inside out on their own experience:
test our trading strategy under real-world prop constraints,
understand where the rules really discipline and protect,
and where they start to get in the way and require an adaptation of the approach.
We took a challenge from a popular prop firm and will share with you not only the final results , but also the process itself:
how do we build a risk plan, how do we conduct transactions, what difficulties arise, what needs to be changed, and what is confirmed in practice.
The market has become more complicated. But this is not a reason to play all-in. This is a reason to grow up: build a system, keep the risk and survive where others burn out.

SAVE YOURSELF FROM LOSSES IN TRADING Q1 | W6 | D9 | Y26📅 Q1 | W6 | D9 | Y26
📊 GBPUSD | FRGNT DAILY FORECAST |
BEFORE YOU PLAN TO MAKE MONEY ! PLAN HOW TO PRESERVE YOUR ACCOUNTS !!!
WISH TO FIND OUT MORE ! YOU KNOW WHERE TO FIND ME !
🔍 Analysis Approach
I’m applying a developed version of Smart Money Concepts, with a structured focus on:
• Identifying Key Points of Interest (POIs) on Higher Time Frames (HTFs) 🕰️
• Using those POIs to define a clear and controlled trading range 📐
• Refining those zones on Lower Time Frames (LTFs) 🔎
• Waiting for a Break of Structure (BoS) as confirmation ✅
This process keeps me precise, disciplined, and aligned with market narrative, rather than reacting emotionally or chasing price.
💡 My Motto
“Capital management, discipline, and consistency in your trading edge.”
A positive risk-to-reward ratio, combined with a high-probability execution model, is the backbone of any sustainable trading plan 📈🔐
⚠️ On Losses
Losses are part of the mathematical reality of trading 🎲
They don’t define you — they are necessary, expected, and managed.
We acknowledge them, learn, and move forward 📊➡️
🙏 I appreciate you taking the time to review my Daily Forecast.
Further context and supporting material can be found in the Links section.
Stay sharp 🧠
Stay consistent 🎯
Protect your capital 🔐
— FRGNT 🚀📈

Unlocking Altseason: Chart Signals You Can't IgnoreAltseason without myths: what actually shows up on charts before alts go crazy
Everyone loves to say “altseason is coming” the same way kids say “summer is coming” in March. Feels good, zero responsibility.
But altseason isn’t magic. It’s just money rotating. And that rotation leaves fingerprints on the charts way before your favorite microcap does +500%.
Let me walk you through the main conditions I usually want to see before I start taking alt setups seriously – not memes, not hopium, just price.
1. King Bitcoin does his move first
Healthy altseasons rarely start from flat Bitcoin.
Typical pattern:
- First, a strong impulsive move up on BTC
- After that move, BTC stops trending and starts chopping in a range
- Volatility cools down, candles get smaller, volume drops
TL;DR: Big boys rode BTC, locked in chunky profits, and now their fresh capital is looking for higher beta plays. That’s when alts start feeling “lighter”.
If BTC is nuking or making fresh parabolic highs every day, alts usually just get dragged around like bags on a train.
2. BTC dominance stops climbing and starts bleeding
Open BTC.D (Bitcoin dominance) and zoom out.
Before most big alt runs, I usually see:
- A clear uptrend in dominance while BTC is running
- Then a topping structure: double top, lower high, or a fake breakout above the previous high
- And then – the key part – a confirmed breakdown with lower lows
That’s literally money leaving BTC relative to alts.
No need to overcomplicate:
Rising dominance – market respects Bitcoin.
Falling dominance – market starts gambling on the side quests.
3. ETH vs BTC wakes up
ETHBTC is my canary in the coal mine.
If ETH can’t even beat BTC, why should I expect your random GameFi coin to do it?
Before many altseasons I’ve watched:
- ETHBTC prints a base or higher low
- Breaks local resistance
- Starts grinding up, even if slowly
ETH often leads the rotation. When this pair wakes up, liquidity is starting to accept “more risk”.
4. Total alt market cap breaks structure
Open TOTAL2 or TOTAL3 – that’s your x-ray of altcoins as a whole.
What I like to see:
- A clear downtrend turning into a sideways accumulation range
- Higher lows forming under a big horizontal resistance
- Breakout of that resistance with expanding volume
That’s not your random lucky pump – that’s the whole sector getting repriced.
5. Volume rotation: BTC quiet, alts noisy
Check the volume bars:
- BTC: volume fades while it ranges
- Major alts: volume spikes on green days, pullbacks on lower volume
That’s exactly what “rotation” looks like. Money doesn’t appear from nowhere – it walks from chart to chart.
Maybe I’m wrong, but I think “altseason” is mostly a marketing word influencers use when they ran out of Bitcoin content. On charts it’s just a sequence:
BTC pumps → BTC chills → dominance tops → ETHBTC turns → alt market cap breaks out → volume rotates.
Last nuance: don’t try to guess the exact start like it’s New Year’s midnight. Focus on conditions, not dates. When several of these signals line up, I start hunting alt setups. When they disappear, I stop dreaming about 50x and go back to trading what the market actually gives.
In the end, altseason is just greed with a chart pattern. Learn to spot the pattern – and the greed will find you on its own.

Strategic Investment Update – A Long-Term Rotation OpportunityThis investment is not in AI or technology.
It is in a sector that rarely receives attention, yet remains essential to the stability of the global economy.
The recent narrative of moving away from physical goods has begun to reverse. We are returning to an environment where tangible, real-world assets carry increasing value.
I have previously outlined why, at current valuations, I prefer energy producers over precious metals. But alongside energy, there is another overlooked sector that I believe is positioned for a significant re-rating:
Agriculture – specifically the critical inputs required to feed a growing global population.
For this reason, I am actively accumulating shares of Nutrien (NTR), the world’s largest provider of crop nutrients.
At current levels, the gap between Nutrien’s market valuation and the underlying fundamentals of global food security appears substantial. The company is trading at a fraction of its replacement value, while supply and demand dynamics for potash are tightening for the first time in years.
The market seems to be pricing in a prolonged downturn, yet the structural need for fertilizers and agricultural inputs continues to grow. Arable land is limited, global populations are expanding, and crop yields depend on these essential products.
From a risk-reward perspective, I am far more comfortable owning a business built on hard assets, recurring demand, and strong cash flow than I am holding speculative technology stocks trading at elevated multiples.
The downside is supported by tangible infrastructure and consistent demand. The upside lies in a potential market rotation as investors refocus on sectors grounded in real economic necessity.
I am sharing this position publicly because I believe it represents a compelling long-term opportunity.
This is not a short-term trade. It is a two to three-year investment thesis based on fundamentals rather than sentiment.
Regardless of what happens in technology markets or with AI-related stocks, one reality remains constant:
People must eat.
As always, this is not financial advice—only an overview of my personal strategy and perspective.

When to Close Losers and When to Hold WinnersClosing losers and holding winners is not a mindset problem. It is a structural one. The decision should come from whether the market has invalidated your narrative or continues to support it. Emotion enters when that framework is missing.
A losing trade should be closed when the reason for the trade no longer exists. In practice, this happens when structure breaks beyond the point that defined risk. If price violates the level that anchored the setup, the market has proven a different story. Holding beyond that point turns analysis into hope. The stop is not there to protect comfort. It is there to protect logic.
Losers also need to be closed when market conditions change.
Volatility expansion, liquidity drain, or session transitions can invalidate a setup even if price has not reached the stop. If execution relied on clean participation and that participation disappears, staying in the trade increases risk without increasing probability. Capital is better preserved for conditions that support the original thesis.
Winners require a different lens. A trade should be held as long as structure continues to support the direction. Higher lows in an uptrend or lower highs in a downtrend indicate that control remains intact. Premature exits usually occur when traders focus on unrealized profit instead of structural confirmation.
Partial profit-taking can be used to reduce pressure, but full exits should align with objective signals. Momentum decay, failure to progress toward the next liquidity objective, or a clear structural break against the position are valid reasons to reduce or exit.
Another consideration is location. When price reaches major opposing liquidity or higher timeframe levels, risk increases. Holding through these areas without reassessment often leads to giving back gains. Exiting or reducing exposure here is a strategic decision, not a fear-based one.
The discipline lies in treating losses and gains symmetrically. Both decisions are governed by structure, liquidity, and environment. When trades are managed by narrative instead of emotion, losses remain controlled and winners are allowed to develop. Over time, this alignment does more for performance than any adjustment to entry technique.

Why Risk Management works differently in Funded AccountsRisk management inside funded accounts is often reduced to position sizing and percentage risk. In reality, it operates under a very different set of constraints than personal capital. The presence of hard rules changes what risk actually represents.
In a funded account, risk is not only financial. It is structural. Daily loss limits, maximum drawdowns, and trailing equity thresholds define a fixed boundary. Once that boundary is crossed, the account ends. There is no recovery phase, no opportunity to adjust or wait for conditions to improve. This turns normal variance into a critical threat rather than a temporary setback.
Because of this, two trades with identical risk on paper can carry very different consequences. A perfectly valid loss taken early in the day may remove the ability to participate in high-quality setups later. A sequence of small losses, well within a strategy’s historical tolerance, can still violate account rules simply due to timing. Risk becomes path-dependent rather than distribution-based.
This reality shapes execution. Traders tighten stops to protect drawdown, even when market structure suggests wider protection is needed. They reduce position size beyond what their edge requires to survive longer. Some shift toward higher win-rate setups with lower expectancy to smooth equity. These adjustments are logical responses to constraints, but they redefine what “good” risk management looks like.
In personal accounts, drawdown is elastic. Losses are uncomfortable, but they do not end participation. This allows traders to think in terms of long-term expectancy, sample size, and recovery. Risk management focuses on sustainability over time rather than immediate survival.
Problems arise when traders apply real-account logic to funded environments, or vice versa. What feels conservative in one context can be reckless in another. Funded accounts reward survival within limits. Real accounts reward consistency across cycles.
Understanding this distinction removes confusion and self-blame. Effective risk management is not universal. It is conditional on capital structure. Traders who adapt their expectations and execution to those constraints stop fighting the rules and start working within them.


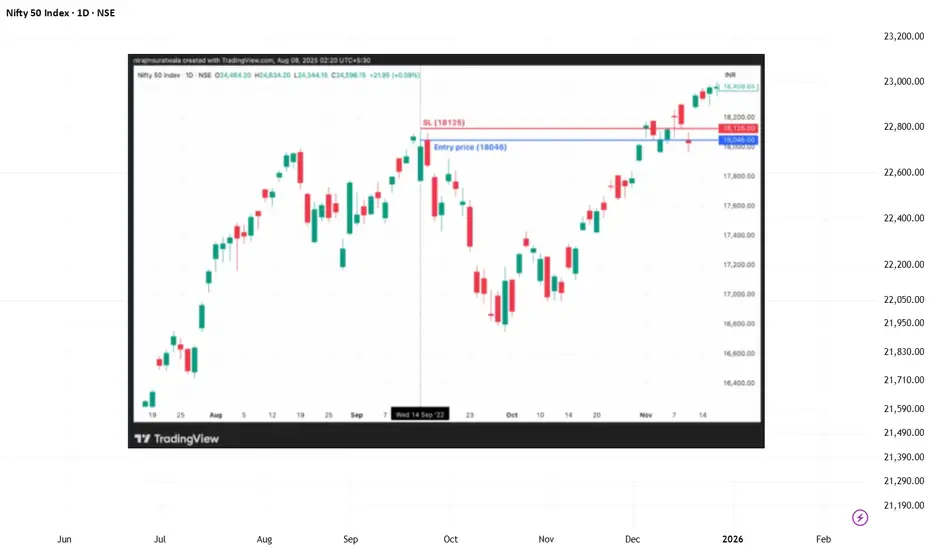
NIFTY 50 | Price–Time Exhaustion Zone Study (September 2022)This idea presents a historical market structure study based on WD Gann’s price–time principles, focusing on how downside pressure often pauses near exhaustion zones.
⚠️ This post is not a trading signal and is shared strictly for educational purposes.
📌 Context of the Study
By late September 2022, NIFTY was still under downside pressure.
However, price–time symmetry and vibration balance suggested that the decline was approaching a temporary pause zone, rather than an immediate trend reversal.
The key observations were:
Downside momentum was losing balance
A pause or consolidation phase was statistically more likely
Blind buying without confirmation carried higher risk
Sustainable moves require price confirmation after pressure release
📊 What the Chart Illustrates
A well-defined downside pressure zone
Price reaction near a time-aligned level
Market stabilization following pressure exhaustion
How markets often pause before clarity emerges, not at emotional extremes
🧠 Educational Takeaways
Markets respond to pressure zones created by price and time
Not every pause is a reversal — structure comes first
WD Gann analysis emphasizes patience and confirmation
Studying completed structures improves future decision-making
⚠️ Disclaimer
This analysis is shared for educational and research purposes only and does not constitute financial advice.

NIFTY 50 | Vibration-Based Reversal Zone Study (September 2022)This idea shares a historical market structure study based on WD Gann’s Law of Vibration, focusing on how specific price zones become sensitive when vibration balance shifts.
⚠️ This is not a trade recommendation or signal.
The post is shared strictly for educational purposes.
📌 Study Background
In mid-September 2022, NIFTY reached a price region where vibration alignment and structural symmetry became more relevant than short-term momentum.
Rather than reacting to price movement, this study observes:
Pre-defined vibration-sensitive zones
Market behavior near structural extremes
How reversals often occur when vibration conditions change
📊 What the Chart Demonstrates
A clearly defined resistance zone
A time-aligned price reaction
Expansion in volatility following vibration shift
How markets often move after internal balance changes, not news events
🧠 Educational Takeaways
Vibration governs when reversals become possible
Price reacts only after internal conditions shift
WD Gann analysis focuses on structure and balance
Studying completed cycles helps understand future behavior
⚠️ Disclaimer
This analysis is shared for educational and research purposes only and should not be considered financial advice.
Stock Market Illusions: My Battle of Logic & ResilienceStock Market Illusions: My Battle of Logic & Resilience
I am not a financial guru. I am an ordinary individual who entered the market with thousands of dreams. Like many, I chased the illusions of "Dalal Street" without a solid foundation, took a massive hit, and lost a major part of my life's savings. The pain and isolation of hitting rock bottom are something only a fellow trader can truly understand.
But in that darkness, I discovered the most powerful tool in trading: Accountability.
I stopped blaming the market, luck, or external tips. I took 100% responsibility for my situation. I realized that while I couldn't control the market, I could control my knowledge and my systems.
As a simple Arts graduate with zero background in programming, the world of coding seemed like an impenetrable wall. However, I had a clear, unshakeable 'Logic'—an understanding of price action, liquidity, and market noise. To bridge the gap between my logic and an automated system, I turned to AI. By structuring my thoughts and giving precise instructions, I began building my own tools in Pine Script.
To breathe life into these ideas, TradingView provided a phenomenal canvas. It allowed me to take my logic off the paper and test it in live markets. This journey is where the identity uniGram was truly born—not just as a username, but as a symbol of resilience.
Through persistence, I have published 13 custom indicators under the uniGram banner (including the GCM Series). Today, seeing these tools reach over 75,000 views, receive 6,000+ boosts, and attract 360+ followers feels surreal. It proves that if someone with no coding background can build robust systems through pure logic and discipline, then anyone can find their edge in this market.
My goal in sharing this is to inspire fellow traders who might be struggling today. The market is a maze, but with the right mindset and a systematic approach, you can find your way out.
Stay strong, keep learning, and keep building.

How To Change Candle Color And Use Indicator Candle ColoringI get a lot of questions about using the custom candle coloring features on my indicators, so I wanted to make a quick walkthrough on exactly how to change your candle colors and how to get custom indicator candle coloring to show up properly on your charts. I also cover how to change your candle type.
Step 1 : Click the 3 dots next to the indicator name and then hover over Visual Order and then click on Bring To Front. This brings the indicator visual order to the very front of the chart so that other indicators don't overlap your custom indicator candles.
Step 2 : Click the nut icon in the top right of your chart for chart settings. Then click on the Symbol tab and either update your candle colors or turn off the body, borders and wick. In order to know where price is at all times when your indicator candle coloring lags, try leaving on the border or body toggle.
That's all you need to do to get your custom indicator candle coloring to work properly.
If you want to change your candle type to heikin ashi or another different type of candle, just click on the candle icon in the top middle of your chart options and then select the type of candle you want to use.
Hope this helps.
Happy Trading :)
- Trend Friend

Relative Strength Isn’t Price — Here’s How to Read ItOne clean ratio chart.
No predictions. Just structure.
This is the VRT / SMH daily ratio — a way to observe which name is gaining leadership inside semiconductors, not whether price is moving up or down.
What the ratio is showing
• 20 / 50 EMA relationship
The 20 EMA has just crossed above the 50 EMA.
This reflects improving relative structure. Leadership pressure is beginning to shift, but not yet confirmed.
• RSI (14)
Short-term RSI is pointing slightly lower but remains elevated near 62, suggesting a normal pause rather than rejection.
Longer-term RSI structure continues to trend higher, indicating that acceptance remains intact.
• Rate of Change (ROC)
Momentum has paused, supporting a short-term breather in the current environment.
This behavior often appears after leadership acceleration, not at the start of a breakdown.
How to interpret this (without forecasting)
This is what early leadership transition often looks like:
Structure improves first
Momentum pauses to digest
Acceptance stays constructive
Leadership doesn’t move in straight lines.
It rotates, compresses, and resets before becoming obvious.
No outcome implied.
No trade suggested.
Just observing how relative strength behaves before price alone tells the story.

THE Motivational Talk you needed!Trading Psychology, mindset adjusting focused talk on what it takes to think right and succeed. This will fire you up and it will train your mind to be as it should be for succcess

Weekly Review of Your TradesA weekly review is not a recap of wins and losses. It is a diagnostic process. The goal is to identify patterns in behavior, execution, and decision-making that are invisible during live trading. Without this review, mistakes repeat quietly and improvements stay accidental.
The review begins with context. Each trade should be grouped by market environment: trending, ranging, or transitioning. Volatility conditions and session timing matter. A losing trade taken during thin liquidity or volatility expansion carries a different lesson than one taken during a clean trend. Results mean very little without environment classification.
Next comes execution sequencing. Review whether trades followed the intended order of events. Liquidity interaction, structural shift, displacement, and retest should be evaluated in that sequence. When trades fail, the question is not whether the idea was wrong, but which step was skipped or rushed. Most performance leaks come from entering before permission is established.
Risk behavior deserves its own section. Compare planned risk to actual exposure. Check whether position size increased after wins or clustered during the same session. Identify correlation between trades that relied on the same narrative. Many drawdowns are not caused by bad ideas but by stacking exposure when conditions deteriorate.
Entry and exit behavior often reveals more than setups. Early exits during valid moves point to discomfort with unrealized profit. Late exits on losers point to avoidance of taking losses. These patterns repeat until they are measured. The chart alone rarely explains them.
Quantify execution quality separately from outcome. Track how many trades met all setup criteria, how many were partial alignments, and how many were impulse decisions. A profitable week with poor execution is a warning sign. An unprofitable week with disciplined execution is often progress.
The final step is adjustment. One or two focused changes are enough. Narrow session windows, reduce exposure during specific environments, or tighten rules around confirmation. A weekly review should simplify trading, not complicate it.
Consistency is built between trades, not during them. The weekly review is where structure replaces emotion and where improvement becomes intentional rather than accidental.
