GBPUSD LONG LOSSTook a clean loss that should have been a break-even trade. Price came within one pip of take profit while I was asleep. Break-even and TP were both set, but the WiFi disconnected during the night — so neither was executed. Woke up to the loss. That’s life. Still the same system.
MT5 screenshot in the comments
Educationalposts

GBPUSD SHORTWas able to hop into a winning short after today’s earlier loss, as the 5M supply took back control. 4H demand hasn’t made its intentions clear yet — we’ll see what happens tomorrow.
MT5 screenshot in the comment section

CM - The Best Method I’ve Found For Finding - Stocks That MOVE!!Today I want to show you The Best Method I’ve Found to Create a list of Stocks to find the most profitable stocks to TRADE consistently.
Please leave a comment below if:
You find this video useful.
You have any questions.
You want me to do a video on how I built the screeners shown in the video.
You want me to continue providing the up to date watchlists.
The link to import the watchlist from the video:
www.tradingview.com
Thanks...

GBPUSD SHORT4H demand remains in control, coming from the weekly demand zone we shared last week.
To continue the bull run, price needs to pull back — room for shorts before bulls take full control again.
As a result, price gave a clear reason for lower prices.
Exited after 3RR achieved. No more, no less.
Same system, every time.
There’s literally nothing to change.
Data over emotion.
(And like I always say… you should say it too.)
MT5 screenshot in comment.

“Little Entry Ticket” Scam: Why $50 Can Ruin Your Trading CareerI don’t think there’s a single reader here who hasn’t come across this type of scam.
You know the story: “The next BTC! The next ETH! Entry only $50.”
At first sight, it doesn’t even feel dangerous. So what if you lose $50? That’s a few beers on a terrace.
But here’s the problem: it’s not about the money — it’s about your mindset.
________________________________________
How It Works
1. The promise: “Early entry into the next big coin.”
2. The hook: the price of admission is low — $50 or $100, something anyone can afford to lose
3. The thought trap: “I can’t lose much… but what if it moons?”
4. The harvest: thousands of people fall for it, and the scammer collects a fortune.
5. The ending: the token dies, liquidity vanishes, and your “lottery ticket” is worthless.
________________________________________
Why It’s Dangerous
It’s not dangerous because you’ll lose $50.
It’s dangerous because it sets your brain on the wrong track.
• Instead of thinking in terms of probabilities and risk management, you start thinking in terms of what if .
• Instead of trading or investing, you’re gambling.
• And once your mindset shifts that way, you’ll chase “cheap tickets” over and over, until the small losses pile up — or worse, you start adding bigger amounts hoping for that one lucky hit.
________________________________________
Final Note
Trading or investing isn’t about lottery tickets. It’s about discipline, probabilities, and outcomes.
If you find yourself drawn into a “little entry” scam, remember: the real danger is not losing $50 — it’s losing your focus, your discipline, and eventually your trading career.

WEEKLY PERFORMANCE RECAPWeekly Performance Recap
Week Ending: August 15
Trades Taken: 3
Results: 2 Wins · 1 Loss . Risk Model: 3% per trade · 3RR target · Monthly compounding.
Week Outcome: +15% Gain

From Cold Calling to Whitepapers: Same Game, New ToolsRemember that legendary scene in "The Wolf of Wall Street"?
Jordan Belfort (DiCaprio) picks up the phone to pitch “Aerotyne International” — a company “poised to explode” — operating from… a garage.
The sales pitch is flawless. The story is strong. The potential? Unlimited.
Except it was nothing more than a fantasy designed to move shares from one set of hands to another — at a profit for the seller.
There is a Romanian saying: "Same Mary, different hat"...
________________________________________
Fast forward to crypto
Today, we don’t have cold calls and penny stock brochures.
We have:
• Whitepapers describing revolutionary technology with no working product.
• Influencer threads promising “undervalued gems” to millions of followers.
• Slick promo videos replacing the boiler room pitch.
• Discord AMAs instead of dinner seminars.
The garage is still there — it’s just virtual now, hidden behind a Twitter banner and a Telegram admin.
________________________________________
Human psychology hasn’t changed
The tools evolved, but the emotions stayed the same:
• Greed — “I don’t want to miss the next big thing.”
• Fear — “If I don’t buy now, it’ll be too late.”
• Trust in authority — “He has a big following, he must know.”
Belfort sold the dream of massive returns.
Modern-day devs and influencers sell the dream of “generational wealth” from coins that exist only as code on a blockchain.
________________________________________
The mechanics are identical
1. Create a story.
2. Amplify it through trusted voices.
3. Target an audience hungry for “the next big thing.”
4. Offload the asset onto those late to the party.
Whether it’s “Aerotyne” or “MoonPepeMooning,” the pattern is the same — transfer value from the hopeful to the prepared.
________________________________________
How to not be the exit liquidity
• Verify: A whitepaper is just words. Look for a product, adoption, and revenue.
• Ignore the hype cycle: By the time it reaches you, someone else is unloading.
• Follow the money: Who benefits if you buy right now?
• Remember history: Tools change, human nature doesn’t.
________________________________________
Bottom line:
Cold calling in the ’90s or a viral thread in 2025 — it’s still a sales pitch.
The sooner you recognize it, the less likely you are to fund someone else’s yacht. 🚀

GBPUSD LONGNot really the cleanest chat today. Check comment for multi-timeframe clear picture with 15s chart and MT5 screenshot.
Long today following the weekly demand we discussed yesterday, with 4H demand still holding. 5M demand also held. Dropped to the 15s for entry as usual, right as price tapped into our 5M zone. Entered and exited at 3RR — not more, not less.

Skeptic's Night Byte: 3 Hacks to Beat a Losing StreakHey, it’s Skeptic 👋
We’ve all been there — losing streaks suck, but they don’t have to wipe you out.
In under 60 seconds, I’ll show you 3 quick hacks that make a huge difference:
Build friction into your trading decisions
Stop letting news events wreck your win rate
Use higher time frames to avoid the noise
Simple moves. Massive impact.
If this helped, hit that boost so I know to drop more tips like this.

The 50/50 Account Management Scam- How it WorksFrom Cold Calling to Telegram
I’ve been in the markets for so long I feel like a dinosaur, and I’ve probably seen every scam out there.
The truth is, none of them are really new — they’re just adapted to the new social paradigm.
What was done in the 2000s through cold calling is now done through Telegram, Instagram, X, and other social platforms.
I didn’t really want to write this article, in case it gave someone ideas.
But since anyone who wants to be a scammer already knows how it works, maybe this article can warn those who still have no idea how the so-called account management scam operates — especially its most common form: the coin flip scam (50/50 scam, Opposite trades scam, Split-direction scam, Two-group margin call trick, as is also known)
Step-by-Step: How the Coin Flip Scam Works
1. Gathering the victims
The scammer starts by fishing for victims through Telegram channels/groups, Instagram profiles, Facebook groups, or even X posts.
They present fabulous profits, post ads with guaranteed return offers, and flood the feed with so-called “proofs” — screenshots of winning trades, client testimonials, and account statements. Most of these are either fabricated or selectively chosen to show only the winning side.
Once someone shows interest, the scammer’s first move is to earn their trust.
They’ll tell you the broker doesn’t matter, that you can choose it, and that they have no access to your money — which is, technically, true.
Then comes the closer:
“You don’t have to pay me upfront. I only get paid if I make you money, so it’s in my best interest not to lose. You see? We’re on the same side.”
This combination of flashy results and “risk-free” terms makes you feel safe enough to hand them trading access.
________________________________________
2. Splitting into two groups
The accounts are divided into two equal batches:
• Group A → All-in BUY
• Group B → All-in SELL
With high leverage (e.g., 1:200), a 50-pip move means either doubling the account or wiping it out completely.
Note: I won’t go too deep into the details here, because the exact margin call level depends on the broker. But trust me, it’s easy for a scammer to plan the money split based on the different brokers’ rules. What we’re talking about here is just the general principle.
________________________________________
3. Guaranteed winners and losers
The market moves.
One group hits margin call and loses, while the other doubles or triples its capital (depending on broker's leverage, even more on 1:500).
The scammer now has perfect marketing material: “Look how I doubled my client’s account!”
________________________________________
4. Milking the winners
Clients who made a profit are celebrated and told something like:
“I only worked with low capital this time just to show you I can do it. I have big clients and serious strategies — now that you’ve seen the proof, deposit more so we can make real money.”
The scammer frames the initial gain as a “demo run” to gain the client’s confidence, pushing them to commit much larger sums next.
________________________________________
5. Recycling the losers
The wiped-out clients are told:
“It was an unusual market move. Deposit another $1,000 and we’ll recover it tomorrow.”
Some quit, but others fall for it again.
________________________________________
6. Repeat the process
The cycle continues. There’s always a “happy” group and real account statements to attract fresh victims, while the losers are quietly discarded or convinced to reinvest.
________________________________________
Why the scam works
• The proof are authentic – Screenshots and MT4/MT5 statements for the winners are real.
• Survivorship bias – Prospects only see the successes, never the failures.
• Hope psychology – Losers believe “next time” will be different (and it can be if they end up in the "winner group" next time
________________________________________
Final word
If someone promises to double your account quickly and safely — walk away.
Real trading is about risk management and long-term consistency, not betting your capital on a 50/50 gamble.
Don’t be the next screenshot in a scammer’s sales pitch. 🚀
P.S.
Stop believing they “made you money on purpose” at the beginning and then “lost it on purpose” after you deposited more.
If they truly had the skill to do that, they wouldn’t need to be scammers in the first place.
The reality is simple — once you put in more money, you just happened to land on the losing side of their scam.

Why You’re Not Successful as a Trader(And What Nobody Tells You)A lot of people want to know how to succeed at trading. They jump into day trading thinking it’s super easy. Just click a button and make money, right? And in a way, it really is that simple because every trade has about a 50/50 chance of being right or wrong. But here is the thing most people do not realize.
To be truly successful long term (a month or more) you have to treat trading like a business and perform like a top athlete.
Let me explain why by sharing a story from my own life.
Back in high school I was one of the top two athletes in my city. Imagine a sport similar to tennis. There were others who were taller, stronger, more naturally gifted in every way. But they were not as consistent as I was. That consistency gave me the edge.
Here is what I did differently.
I worked out every day building cardio and training specific muscles in my arms, shoulders, and legs for explosive power.
I practiced really difficult shots hundreds and hundreds of times. When I made those shots during games people called it luck. But I knew better. I had rehearsed those shots so much that there was almost a 99 percent chance I would make them.
I also played mind games with my opponents. I talked to them before matches and gave them false confidence by saying I had injuries or wasn’t feeling great. Sometimes I praised a shot they had but secretly I had studied it carefully and knew exactly how to counter it. I was setting them up to lose.
The stock market is just the same.
It is a competition. The market is full of opponents, other traders, institutions, algorithms, all fighting for an edge. If you want to be in the top 10 percent who consistently make profits you have to be at the top of your game mentally, physically, and emotionally.
That is why so many traders fail. They don’t realize they need to train themselves like athletes. Having the right indicators or a big account is not enough. If you are tired, stressed, or emotionally drained, you are far more likely to make mistakes.
Ask yourself.
Did I sleep well last night?
Am I managing my stress and emotional environment like family issues or distractions?
Am I exercising enough to keep my heart and mind sharp?
Am I fueling my brain with the right nutrition and supplements?
Am I constantly learning and keeping my mind sharp enough to spot patterns and make quick decisions?
For me trading is like those athlete days. I take supplements to keep my mind sharp and my emotions steady throughout the day. I aim for 5,000 to 10,000 steps daily to stay physically fit. I carefully track my sleep with my Oura ring because getting good rest is critical to trading well.
Trading is a competition you show up to every single day. If you are not in your best shape losing that day is expected. And while even top athletes sometimes lose when they are at their best losing because you were not prepared is something you cannot accept.
Knowing the rules is just as important.
I once played a match where the sun was setting right on my side during the game. The other team had sun visors allowed by the rules. We only had hats but hats were banned. That small difference made a huge impact on the outcome.
Trading has its own rules and invisible players too like the Plunge Protection Team which steps in to prevent market crashes past a certain point. There are many hidden mechanics in the market you have to understand.
For example moving averages are not just about the famous 50 and 200-day crosses. There are many subtle details about how they are calculated and used that most traders miss unless they study deeply.
So honestly ask yourself these questions.
Do I really want to succeed in this market?
Am I willing to put in the time and effort it takes?
Am I treating trading like the serious business it is?
If your answer is yes then start treating yourself like the most important asset in your trading business. Train your body and mind. Learn the rules inside and out. Practice with discipline and consistency.
Success is not going to be easy. But it will be earned.

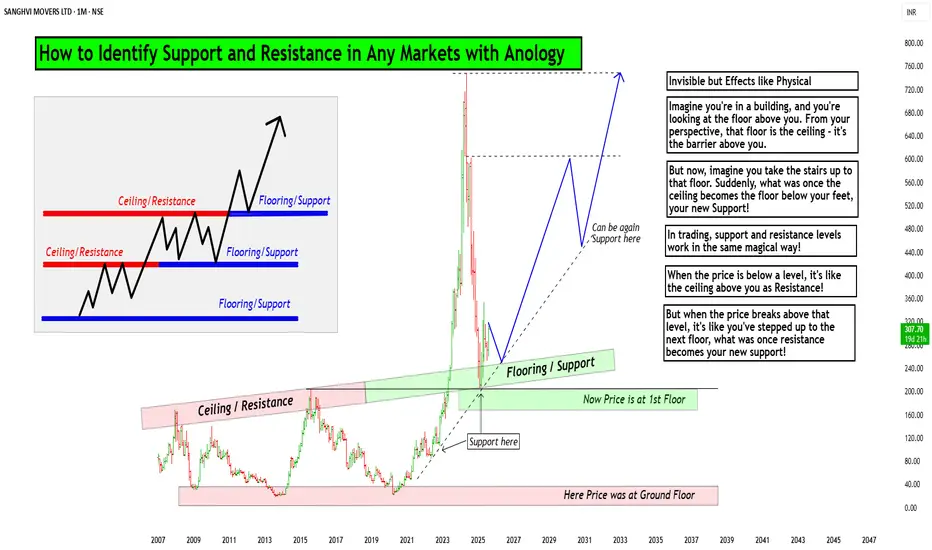
How to Identify Support and Resistance in Markets with AnologyHello Friends,
Welcome to RK_Chaarts,
Today we are going to learn & understand real work of Supports and Resistances in markets,
and Market structure with very good examples (Educational Post)
The Market's Architecture: Support and Resistance
This is an excellent analogy for understanding two of the most worthful concepts in technical analysis: support and resistance. By thinking of the market as a multi-story building, we can visualize how price moves and what happens when it hits certain levels.
- The Core Analogy: The Building and the Elevator
- Imagine the market as a large building with many floors. The price of an asset (like a stock or a cryptocurrency) is like an elevator moving up and down within this structure. The floors and ceilings of the building are not physical barriers but represent specific price points that the market has collectively agreed upon as important.
- The Floor (Support)
The floor of a building provides a solid base and prevents the elevator from falling further. In the market, this is called a support level. A support level is a price point where buying pressure is strong enough to stop the price from declining. When the "elevator" (price) reaches the floor, it finds enough buyers to give it a lift, preventing a deeper fall. A strong support level is like a thick concrete floor—it has been tested multiple times and holds firm, showing that there is significant demand for the asset at that price.
- The Ceiling (Resistance)
- The ceiling of a building sets the upper limit for the elevator's movement on a given floor. This is the market's resistance level. A resistance level is a price point where selling pressure is strong enough to prevent the price from rising further. When the "elevator" hits the ceiling, it encounters a large number of sellers who are ready to take profits, pushing the price back down. A strong resistance level is like a low ceiling—the price hits it and retreats, indicating that many investors believe the asset is overvalued at that point.
Breaking Through: New Levels
The most dynamic part of the analogy is what happens when the elevator breaks through a floor or ceiling.
Breakout (Breaking the Ceiling):
When the price has enough momentum to push through the resistance level (the ceiling), it has essentially moved to a new, higher floor. This is a significant event. The old ceiling, which was previously a barrier, now becomes the new floor. This is a key trading principle: old resistance often becomes new support. The market has established a new, higher trading range, and if the price falls back to that level, it will likely find buyers there, who now see it as a good value.
Breakdown (Breaking the Floor):
Once if price falls from that floor (Support level) which is called as Breakdown in technical language, then lower floor can be the next stop for elevator (Next Support for price), The old floor, which once provided support, now becomes a new ceiling. This is the reverse principle: old support often becomes new resistance. If the price tries to rally back up, it will likely get stuck at this old support level, as it's now seen as a good place to sell.
Structural Integrity (Volume)
Think of market Volume like a construction team. When a lot of people are involved (high volume), the structure is stronger.
Imagine a ceiling in the market. If lots of buyers (high volume) break through it, that's like a robust construction team building a new floor. It's unlikely to collapse.
On the other hand, if sellers break through a floor with high volume, that's a strong sign they're serious about the downward move.
But if the volume is low, it's like a weak construction team. Even if they break through, the move might not last. It's like a flimsy wall that could easily be reversed.
So, volume gives us a sense of whether the market's moves are strong and reliable, or weak and likely to change.
I am not Sebi registered analyst.
My studies are for educational purpose only.
Please Consult your financial advisor before trading or investing.
I am not responsible for any kinds of your profits and your losses.
Most investors treat trading as a hobby because they have a full-time job doing something else.
However, If you treat trading like a business, it will pay you like a business.
If you treat like a hobby, hobbies don't pay, they cost you...!
Hope this post is helpful to community
Thanks
RK💕
Disclaimer and Risk Warning.
The analysis and discussion provided on in.tradingview.com is intended for educational purposes only and should not be relied upon for trading decisions. RK_Chaarts is not an investment adviser and the information provided here should not be taken as professional investment advice. Before buying or selling any investments, securities, or precious metals, it is recommended that you conduct your own due diligence. RK_Chaarts does not share in your profits and will not take responsibility for any losses you may incur. So Please Consult your financial advisor before trading or investing.
GBPUSD SHORTPrice still pushing from the weekly demand zone. 4H demand remained in control, but 5M supply took over, which justified Friday’s short. We don’t stay in the market too long on Fridays. Tapped 3RR and exited — not more, not less. Same system, same rules.

XAUUSD Chart Analysis – Smart Money Concepts (SMC) Based🔍 XAUUSD Chart Analysis – Smart Money Concepts (SMC) Based
1. Market Structure Overview:
The chart clearly shows a bullish market structure forming after a sequence of Breaks of Structure (BOS) and Change of Character (CHoCH) events.
The market has consistently made Higher Lows, indicating strength from the bulls and institutional order flow to the upside.
2. Key Zones Identified:
✅ Strong Support Zone (Demand Area):
Around $3,260–$3,280, this level has been respected multiple times.
It is marked with BOS, CHoCH, and a Bullish Fair Value Gap (FVG) indicating institutional accumulation and unfilled orders.
The area also contains a Weak Low, which gives price a reason to stay above if bullish sentiment continues.
❌ Strong Resistance Zone (Supply Area):
Around $3,420–$3,460, this area shows signs of Level Rejection and is labeled with Buy-Side Liquidity.
This is where price previously reversed after grabbing liquidity—indicating distribution and possible shorting interest from smart money.
3. Liquidity Zones:
Buy-Side Liquidity: Above recent swing highs near $3,420–$3,440. Price tapped this level and sharply rejected.
Sell-Side Liquidity (Target Area): Currently aiming for the zone around $3,350, which aligns with a recent imbalance (FVG) and a clean liquidity pool below short-term higher lows.
4. Fair Value Gaps (FVGs):
A Bullish FVG is seen mid-chart, where price was rapidly driven up, leaving a gap—price later returned to this zone, respected it, and pushed higher again.
This is a strong sign of institutional entry and provides excellent long entries.
5. Trend Confirmation:
BOS + CHoCH + Higher Lows = Bullish Bias.
Each low is forming higher than the previous, with strong rejections from demand zones.
6. Entry & Target Insight:
Entry Point: After price reacted from support and printed another Higher Low.
Target: Currently price is targeting $3,350 (short-term retracement or pullback target).
This target is likely an internal liquidity sweep before potential continuation to retest the resistance zone again.
7. Educational Takeaways:
Market Structure is King: Observe BOS/CHoCH for directional bias.
Liquidity Matters: Understand where liquidity is resting—price seeks it.
FVG as Entry Tool: Fair Value Gaps provide high-probability trade setups when aligned with structure.
Patience at Key Zones: Wait for confirmations at resistance/support rather than impulsive trades.
✅ Summary:
Bias: Bullish, until structure breaks.
Short-Term Target: $3,350 (as per the chart).
Long-Term View: If price maintains higher lows, potential revisit to the resistance zone ($3,420–$3,460) is likely.
Invalidation Level: Break and close below strong support ($3,260) would shift bias.

GBPUSD LONGCheck comment for the proper multi-timeframe layout due to TradingViews publishing restriction
MT5 screenshot also attached.
Still moving in line with the bullish bias I shared in Monday’s post.
Things may shift eventually, but for now — we ride it.
4H supply in control, aligned with weekly demand. 5M demand held strong.
Waited for price to return to the mapped zone, dropped to 15s for execution.
Tapped out after 3RR achieved — not more, not less.
Same system. Same pair. Different day.

From Fakeout to Takeoff: How the V-Pattern REALLY WorksEver seen a support level break, only for the price to rocket back up in a V-shape? That’s the V-Pattern in action! In this post, Skeptic from Skeptic Lab breaks down the step-by-step mechanics of this powerful setup. From the fakeout that traps short sellers to the surge of buy orders from liquidations, you’ll learn exactly how buyers flip the script and create explosive reversals. Perfect for traders looking to spot high-probability setups. Join me to decode the markets—check out the steps and level up your trading game!

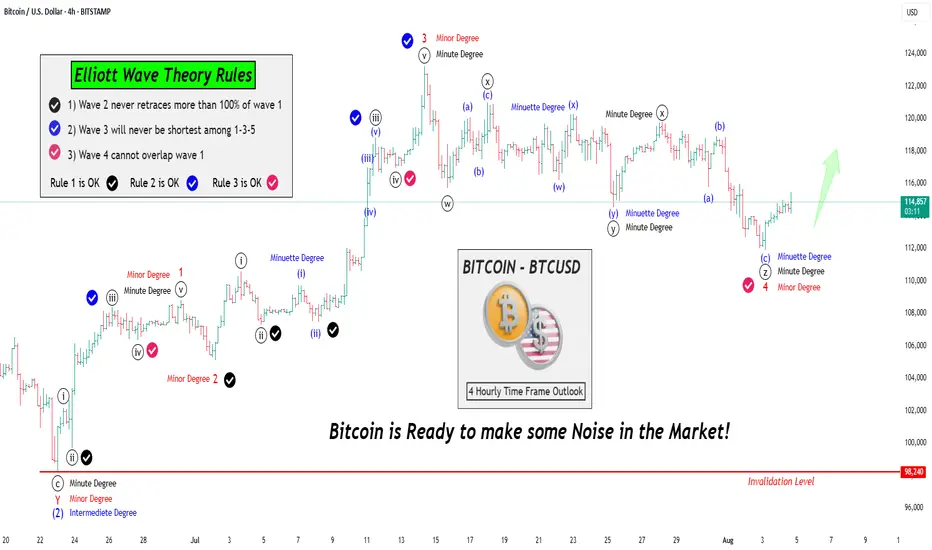
Let's learn & Apply Elliott Wave Rules on chart: BTCUSD BitcoinHello Friends,
Welcome to RK_Chaarts,
Friends, Today we are going to learn 3 Rules of the Elliott Wave theory, there are three principles and some patterns. Impulses move in a 1-2-3-4-5 pattern, either as an impulse or a motive wave. However, within impulses, there are three rules:
Rule No 1:
Wave 2 will never retrace more than 100% of Wave 1.
Rule No 2:
Wave 3 will never be the shortest among Waves 1, 3, and 5; it can be the largest, but never the smallest.
Rule No 3:
Wave 4 cannot overlap Wave 1, except in diagonals or triangles; in impulses, it cannot overlap.
We've checked these three rules and marked them with separate tick marks on the chart with different colors, making them clearly visible. You can review the chart and verify these rules yourself, learning how wave principles are applied and checked.
We've explained all this through a drawing on the chart, so we won't elaborate further here. Moving forward, let's analyze what the wave theory suggests about the current market trend. This entire analysis is shared for Educational purposes only.
I hope you'll consider this educational post as a learning resource, Definitely, I encourage you to review the chart as an image or picture to better understand the concepts we've worked hard to explain.
Our effort will be successful if you gain a deeper understanding and learn something new from this post. If you find this helpful and informative, our hard work will have paid off. Please keep this in mind as you review the material.
Now let's explore how wave counts within wave counts, or lower degrees within higher degrees, unfold through complete wave theory patterns and following theory Rules all the times.
Let's take a closer look at the Bitcoin chart we've analyzed using Elliott Waves. From this perspective, it's clear that the Intermediate Degree Wave (2) concluded around June 23rd.
After this, we observe that the internal wave counts of the lower degree, specifically Wave 1-2-3 (in red) have completed their cycle of Minor degree. Furthermore, Red Wave 4 of same Minor degree has been moving sideways, characterized by a downward trend.
Notably, the fall of Red Wave 4 is classified as a Minor Degree movement. Interestingly, this downward movement appears to have terminated in an even lower degree, namely the Minute Degree, which we've marked in black as ((w))-((x))-((y))-((xx))-((z)) that means Wave 4 of Minor degree (in Red) is complete.
Given that Red Wave 4 Minor has reached its conclusion, it's highly plausible that Wave 5 has initiated. This development suggests that Bitcoin is poised to make a significant move.
Moving on to the analysis, we observe that:
- Rule 1: Wave 2 has not retraced more than 100% of Wave 1, so this rule is intact.
- Rule 2: Wave 3 is not the shortest among Waves 1, 3, and 5, so this rule is also valid.
- Rule 3: Wave 4 does not overlap Wave 1, so this rule is also satisfied.
Bitcoin is all set to shake things up! We eagerly anticipate further rallies in the market.
This post is shared purely for educational purpose & it’s Not a trading advice.
I am not Sebi registered analyst.
My studies are for educational purpose only.
Please Consult your financial advisor before trading or investing.
I am not responsible for any kinds of your profits and your losses.
Most investors treat trading as a hobby because they have a full-time job doing something else.
However, If you treat trading like a business, it will pay you like a business.
If you treat like a hobby, hobbies don't pay, they cost you...!
Hope this post is helpful to community
Thanks
RK💕
Disclaimer and Risk Warning.
The analysis and discussion provided on in.tradingview.com is intended for educational purposes only and should not be relied upon for trading decisions. RK_Chaarts is not an investment adviser and the information provided here should not be taken as professional investment advice. Before buying or selling any investments, securities, or precious metals, it is recommended that you conduct your own due diligence. RK_Chaarts does not share in your profits and will not take responsibility for any losses you may incur. So Please Consult your financial advisor before trading or investing.
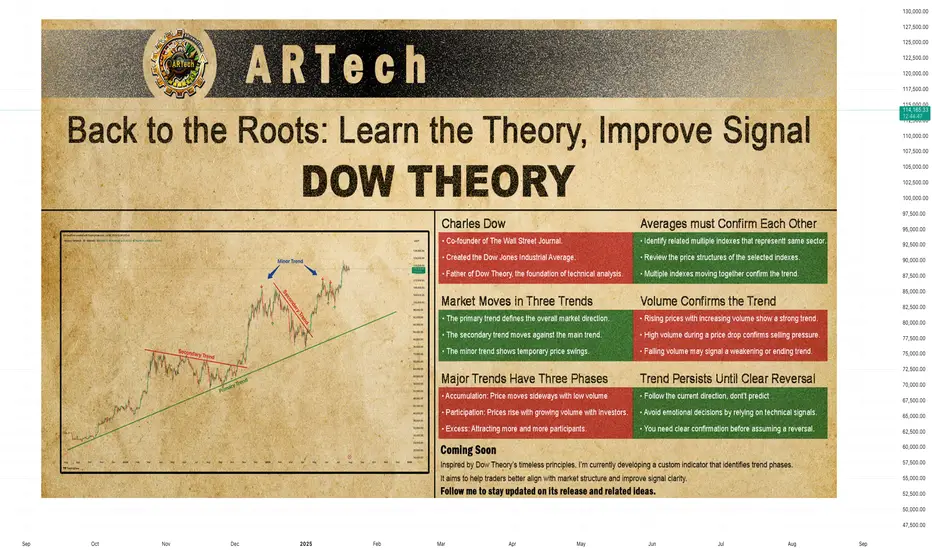
DOW THEORYBack to the Roots: Learn the Theory, Improve Signal
Charles Dow
Before we explore Dow Theory, let’s take a moment to understand who Charles Dow was — and why his ideas still matter today.
Charles Dow wasn’t a financial expert. He was a journalist with a sharp eye for market behavior. In the late 1800s, he began to write about how prices move, how trends form, and what they might mean. His goal was simple: to bring structure and logic to the chaotic world of stock prices.
More importantly, he believed that markets move in trends , and that these trends reflect the collective psychology of all investors. This basic idea became the starting point of technical analysis .
Dow created one of the first stock indexes, which helped investors see the bigger picture instead of focusing only on individual stocks. He also promoted transparency in financial data — long before it was required by law.
In 1889, Dow co-founded The Wall Street Journal, a newspaper that became the voice of financial markets. Through its pages, he published his observations on price behavior, setting the foundation for what would later be known as Dow Theory .
Dow Theory
At the heart of Dow Theory lies a simple but powerful idea:
The market discounts everything.
This means that all known information — earnings reports, interest rates, economic events, political changes, and even future expectations — is already reflected in the price. Price is not random. It is the result of collective investor behavior based on all available knowledge.
Charles Dow didn’t write this exact sentence, but his work clearly reflected this belief. He trusted that by analyzing price movements alone, one could understand the overall direction of the market — because price already includes all the important signals.
Dow and later analysts outlined a set of guiding principles. These are now known as the Six Core Principles of Dow Theory , and they continue to serve as a foundation for modern technical analysis.
The market discounts everything
The market moves in three trends
Major trends have three phases
Averages must confirm each other
Volume confirms the trend
A trend stays in place until it clearly reverses
🔸🔸🔸 The Market Moves in Three Trends 🔸🔸🔸
According to Dow Theory, market movements are not random. Prices move in three different dimensions and time frames: the primary trend , the secondary trend , and the minor (short-term) trend. These three types of movement often occur at the same time. It is very important for an investor to distinguish between them.
The primary trend shows the general direction of the market and can last for months or even years. It’s the major upward or downward movement.
The secondary trend refers to corrections or pullbacks that move in the opposite direction of the primary trend.
The minor trend typically consists of daily or weekly fluctuations and is often considered market “noise.” These short-term movements can occur in the same or opposite direction of the primary trend and may last from a few hours to two or three weeks.
Dow Theory emphasizes that understanding this three-layered structure can protect investors from many mistakes. The theory not only classifies trends but also offers valuable lessons about investor behavior.
It especially highlights the importance of three key principles:
Don’t go against the main trend
Short-term moves can easily confuse traders. Trading against the primary trend often leads to losses. That is why it is crucial to identify the main trend and follow it.
Diversify your exposure
In Dow’s time, technology wasn’t as advanced as it is today, but he still followed multiple indexes (like industrials and transport) to reduce risk. The same principle applies today: investors shouldn’t rely on a single asset — diversification remains a critical part of managing risk.
Define your holding period before entering a trade
Each type of trend comes with a different time expectation. The holding period you choose will play a key role in shaping your trading strategy and aligning it with your financial goals. Instead of debating how long each type of trend should last, it’s more important to define your intended holding period before entering a position.
Your answer to the question “Which holding period suits me?” reflects not only your trading style and lifestyle, but also determines which chart timeframes and indicator timeframes you should use.
🔸🔸🔸 Major Trends Have Three Phases 🔸🔸🔸
According to Dow Theory, major (primary) trends consist of three phases. This structure reflects how investor psychology changes over time and how those emotions are reflected in price action. Regardless of whether the trend is bullish or bearish, each major trend includes these three stages:
Accumulation Phase
The first stage of a bull market often looks like a small bounce during a bear trend. Most people still feel negative about the market. They are afraid to buy again after losing money. Trading volume is low, and prices move in a narrow range. The market stops making new lows, but investors are still unsure. Many have left the market or are very careful now. The price action becomes slow and sideways. It feels boring. But during this quiet time, smart investors slowly start buying. This is how a new trend begins — silently and with doubt.
However, there is no clear signal that a bull market has started. Buying now carries two big risks. First, the market may still go lower. Second, even if a bull trend is coming, no one knows when it will start. How long can you wait while the market does nothing? Holding positions in a flat market has costs — financial, emotional, and missed opportunities elsewhere. That’s why this phase is difficult for most traders to handle.
Public Participation Phase
The market begins to recover, and the broader investor base starts to notice positive changes. News improves, technical indicators give bullish signals. Prices rise, and trading volume increases. This is usually the strongest part of the trend. At this stage, more disciplined and research-driven investors — who follow the market closely — start buying in. They see confirmation in both price action and economic data. Their confidence supports the trend, and momentum grows. The market attracts more attention. Confidence replaces fear. Many investors who stayed out during the earlier phase now feel safer to enter.
Joining the market during this phase is important. The trend is already underway, but there’s still room to grow. Risk is lower than in the early phase, and potential rewards are still high. For many investors, this is the best time to take a position.
Excess Phase
The market enters a phase of excessive optimism. Prices have been rising for a long time, attracting more and more participants. However, during this stage, institutional investors and professional traders who entered earlier begin to gradually take profits.
Although prices remain high, momentum weakens, and the rate of increase slows down. Looking at the volume profile, prices may reach new highs but often without volume support. Technical indicators frequently show bearish divergences. These conditions generate early technical signals that the primary trend may be coming to an end.
🔸🔸🔸 Averages must Confirm Each Other 🔸🔸🔸
According to Dow Theory, a market trend is considered valid only when different indexes move in the same direction. The term “average” here refers to an index or the general direction of a price series. This principle is used to assess whether a price movement is supported by broad market participation.
A single index reaching a new high or low is not enough. For a real and sustainable trend to be confirmed, related indexes are expected to show similar movement and generate signals in the same direction. If this confirmation is missing, the current move may be considered weak or temporary.
How to Analyze It:
Identify related indexes
Choose multiple indexes that represent the same market, sector, or economic domain.
Compare trend direction
Review the price structures of the selected indexes. Are they all showing similar patterns? Did the new highs or lows form around the same time?
Look for confirmation
If multiple indexes form new structures in the same direction (e.g., all make new highs in an uptrend), this increases the validity of the trend.If only one index is moving while others are not participating, confirmation is lacking.
Be cautious without confirmation
When confirmation is missing, trading strategies should be more conservative, or additional signals should be awaited before taking action.
🔸🔸🔸 Volume Confirms the Trend 🔸🔸🔸
According to Dow Theory, the validity of a market trend depends not only on price movement but also on trading volume. For a trend to be considered strong and sustainable, price action should be supported by volume.
Why Is Volume Important?
In a rising market, increasing volume is expected. This indicates growing investor interest and broader participation in the trend.
In a falling market, if the decline happens with high volume, it suggests serious selling pressure and strengthens the trend.
Declining volume may signal a loss of momentum and suggest that the current trend is weakening or nearing its end.
How to Analyze It:
Observe the relationship between price and volume:
Price rising + volume increasing → Strong trend
Price rising + volume decreasing → Lack of confirmation; caution is advised
Check volume during breakouts:
If resistance or highs are broken with strong volume → Reliable signal
If breakouts happen on low volume → May indicate a false move (fakeout)
🔸🔸🔸 A Trend Persists Until a Clear Reversal Occurs 🔸🔸🔸
This core principle of Dow Theory is at the heart of all trend-following strategies.
It states that once a price begins moving in a certain direction, the trend is assumed to continue — until there is clear and technically confirmed evidence that it has ended.
Why Is This Principle Important?
Follow, don’t predict
Instead of guessing what the market will do next, traders stay with the current direction.
Reduces emotional decisions
Trades are based on technical signals, not assumptions like “the price is too high, it must fall.”
A weak trend is not the same as a reversal
Not every pullback means the trend is over. You need clear confirmation before assuming a reversal — such as a breakdown, volume shift, momentum loss, or structural change.
How to Apply It
First, identify the trend direction clearly, and trade in that direction.
Pullbacks are seen as normal movements within the trend — not as reversals.
Even when signs of a reversal appear, wait for confirmation before acting.
Confirmation signals may include:
Failure to form new highs or lows
A break of previous support or resistance
Sudden drop in volume or volume rising in the opposite direction
Weakness or divergence in momentum indicators
Strategic Benefit
This principle is especially useful in trend-following strategies. It helps avoid premature exits and allows traders to stay in profitable trends longer. By focusing on technical confirmation instead of speculation or panic, it encourages disciplined and systematic decision-making.
DOGEUSDT Technical Analysis – Bullish Reversal Anticipated DOGEUSDT Technical Analysis – Bullish Reversal Anticipated
🔍 Key Technical Zones:
Support Zone: $0.1990 – $0.2015
Strong bullish reactions noted from this level in previous attempts.
Confluence with volume accumulation on the left (as seen in the Volume Profile).
Signifies a strong demand zone where buyers are stepping in.
Resistance Zone / Target: $0.2220 – $0.2240
Previous structural high and supply zone.
Marked as the first major liquidity area.
Also aligns with imbalance and CHoCH (Change of Character), a common SMC concept.
🔄 Market Structure:
CHoCH (Change of Character) marked multiple times, indicating attempts by bulls to reclaim structure.
Recent price action shows accumulation near support.
Sideways consolidation suggests potential for a bullish breakout.
Liquidity sweep of recent lows could indicate that smart money is accumulating positions before a move higher.
🎯 Trade Setup Idea:
Entry Area: Between $0.2000 – $0.2060 (inside the support zone)
Target: $0.22396 (as marked)
Stop Loss: Below $0.1980 (below the visible support range)
🔧 Indicators and Tools Used:
Volume Profile (VRVP): Shows most volume traded around $0.205 – $0.207, indicating strong positioning from market participants.
Smart Money Concepts (SMC): CHoCH and liquidity concepts signal potential accumulation and reversal.
Price Action Analysis: Clean swing structure with support-resistance rotation visible.
📌 Conclusion:
DOGEUSDT is currently trading in a range-bound structure with a bullish bias from the support zone. If the price sustains above $0.205 and breaks above minor resistance, the upside target of $0.22396 is likely. This setup is supported by strong volume accumulation and smart money structure shifts.

Mechanical vs. Anticipation Trades: The Fine LineWhen traders talk about discipline, they often refer to following rules — sticking to a plan, being methodical, and avoiding emotional decisions. But there's a subtle and powerful difference between being rule-based and being blindly mechanical. And even more, there's a moment in every trader’s process where discipline demands adaptation.
Let’s look at a recent trade on Gold to understand this better.
On Thursday, I published an analysis on Gold stating that the recent breakdown of support had turned that zone into resistance. A short entry from that level made sense.
It was mechanical, clean, and aligned with what the chart was showing at the time.
And, at first, it worked. Price rose into the resistance area and dropped. Perfect reaction. Textbook setup. Confirmation. The kind of trade you want to see when following a rule-based system.
But then something changed.
Price came back. Quickly.(I'm talking about initial 3315-3293 drop and the quick recover)
So, the very next rally pushed straight back into the same resistance area, hmmm...too simple, is the market giving us a second chance to sell?
That was the first sign that the market might not respect the previous structure anymore.
It dipped again after, but the second drop was different: slower, weaker, choppier.
That told me one thing: the selling pressure was fading.
So I shifted. From mechanical execution to anticipatory mindset.
This is where many traders struggle — not because they don’t have a system, but because they don’t know when to let go of it. Or worse: they abandon it too quickly without cause.
In this case, the evidence was building. The failed follow-through. The loss of momentum. The compression in structure. All signs that a reversal was brewing.
Rather than continuing to blindly short, referring to a zone that no longer held the same weight, I started looking for the opposite: an upside breakout and momentum acceleration.
That transition wasn’t based on emotion. It was based on market behavior.
________________________________________
Mechanical vs. Anticipation: What’s the Real Difference?
A mechanical trade is rule-based:
• If X happens, and Y confirms, then enter.
• No need for interpretation, no second guessing.
• It can (in theory) be automated.
An anticipatory trade is different:
• It’s about reading intent in price action before confirmation.
• Higher risk usually, but higher reward if you’re right.
• Can’t be automated. It requires presence, experience, and context.
And the tricky part? Often, we lie to ourselves. We say we’re "mechanical" while actually guessing. Or we think we’re being smart and intuitive, when in fact, we’re being impulsive.
The key is awareness.
In my Gold ideas, the initial short was mechanical. But the invalidation came quickly — and I was alert enough to switch gears. That shift is not a betrayal of discipline. It’s an upgrade of it.
________________________________________
Final Thoughts:
Discipline is not doing the same thing no matter what. Discipline is doing what the market requires you to do, without emotional distortion.
And that, often, means walking the fine line between the setup you planned for, and the reality that just showed up.
Disclosure: I am part of TradeNation's Influencer program and receive a monthly fee for using their TradingView charts in my analyses and educational articles.

XAUUSD – Strong Bullish Reversal from Key Support XAUUSD – Strong Bullish Reversal from Key Support
Chart Summary:
Gold (XAUUSD) has shown a clear reaction from a strong support zone near 3260, suggesting bullish momentum is gaining strength. The chart highlights multiple key market structure elements and confirms the potential for a bullish move.
Technical Highlights:
🔻 Strong Support Zone (3260–3280):
Price tapped into a well-defined demand zone with historical significance, initiating a bullish response.
🔺 Resistance Zone (3460+):
A strong resistance level lies ahead. This area may act as a potential target for bulls.
🔁 Break of Structure (BOS):
Multiple BOS marks on the chart indicate trend shifts and liquidity grabs. Most recent BOS aligns with potential reversal.
💹 Bullish Fair Value Gap (FVG):
A bullish FVG near mid-structure confirms institutional interest and adds confluence to the upside move.
📈 Target: 3,366.984 USD
Marked as the next probable short-term liquidity target. If momentum sustains, price may approach resistance above this.
Price Expectation:
If the current bullish momentum holds above the strong support zone, we may see a rally towards 3,366–3,400 USD.
This move could be driven by:
Buy-side liquidity grab above prior highs
Breakout traders entering above BOS
Reaction to macroeconomic calendar (highlighted on the chart)
✅ Educational Takeaway:
This is a textbook example of:
Support-resistance flip
Liquidity concepts (Buy-Side Liquidity)
Fair Value Gaps usage
Volume Profile confluence

14-Day Mindset Challenge: Become a Top Trader — Day 114 Days. Challenge: How to Become a Mindset-Strong Trader
Day 1: The Power of Physical Exercise in Enhancing Trading Performance
Embarking on a trading journey demands more than just technical knowledge and market analysis; it requires a resilient and focused mindset. One often overlooked but incredibly powerful tool to develop this mental strength is physical exercise. Regular movement not only benefits your body but also profoundly influences your mental clarity, emotional stability, and overall performance as a trader.
When you engage in physical activity, your brain releases a cascade of chemicals that improve mood, focus, and resilience—crucial qualities for navigating the volatile world of trading. Think of your body and mind as interconnected systems: by strengthening your physical health, you lay a solid foundation for a sharper, more disciplined trading mindset. Over the next 14 days, committing to a simple, consistent exercise routine can transform how you approach your trading sessions, helping you stay calm under pressure, make better decisions, and recover quickly from setbacks.
Let's start!
How Physical Exercise Improves Your Trading Results
1. Boosts Endorphin Production for Positive Feelings
One of the most immediate benefits of exercise is the release of endorphins—natural chemicals that promote feelings of happiness and reduce stress and pain. This positive mood boost helps traders maintain a calm and focused mindset, even amidst market volatility. Scientific studies have shown that regular physical activity increases endorphin levels, which can combat anxiety and improve overall emotional resilience.
2. Enhances Insulin Activity and Energy Levels
Exercise improves insulin sensitivity, enabling your body to more efficiently process glucose for energy. This increased metabolic efficiency helps combat fatigue and sustains mental alertness during prolonged trading sessions. Research indicates that physically active individuals experience higher energy levels and better stamina, which are vital for maintaining attention and decision-making capacity.
3. Reduces Disease Risk and Promotes Long-Term Health
Regular physical activity reduces the risk of cardiovascular disease, diabetes, and other chronic health issues. By maintaining good health, traders are less likely to experience unexpected absences due to illness and can trade consistently over time. Scientific evidence supports that healthier individuals have better cognitive function and emotional stability, both crucial for trading success.
4. Boosts Brain Health and Cognitive Function
Exercise increases heart rate and blood flow, delivering more oxygen and nutrients to the brain. Numerous studies have demonstrated that physical activity stimulates the growth of new neural connections and enhances neuroplasticity—the brain’s ability to adapt and learn. This leads to improved memory, concentration, and problem-solving skills, all essential for analyzing markets and executing trades efficiently.
5. Enhances Stress Regulation and Emotional Control
Research shows that regular exercise helps regulate the hypothalamic-pituitary-adrenal (HPA) axis, which controls stress responses. By improving your body’s ability to handle stress, exercise reduces the likelihood of emotional reactions such as impulsivity or panic during trading. This emotional regulation is key to maintaining discipline and sticking to your trading plan under pressure.
6. Improves Sleep Quality
Quality sleep is fundamental for cognitive performance and emotional regulation. Scientific studies have consistently shown that physical activity, especially aerobic exercise, improves sleep quality and duration. Better sleep enhances focus, decision-making, and emotional resilience—traits that directly impact trading performance.
7. Promotes Neurotransmitter Balance
Exercise influences the production and regulation of neurotransmitters such as dopamine, serotonin, and norepinephrine. These chemicals play a vital role in mood, motivation, and alertness. Balanced neurotransmitter levels support a positive mindset, resilience to setbacks, and sustained motivation—key ingredients for consistent trading.
8. Increases Resilience to Market Stressors
Finally, regular physical activity builds overall resilience—both physically and mentally. This resilience helps traders recover quickly from losses, handle unexpected market shocks, and stay committed to their strategies without succumbing to frustration or panic.
Incorporating these scientifically-backed points emphasizes how exercise not only benefits physical health but also fundamentally enhances the mental and emotional capacities critical for successful trading.
Taking Action: Your 14-Day Exercise Implementation Plan
1. Decide Your Exercise Routine
Choose activities that you enjoy and can commit to every day for the next two weeks. Whether it’s walking, jogging, weightlifting, yoga, Pilates, push-ups, mountain climbers, or any other physical activity—what matters is consistency. Pick something that makes you feel energized and motivated.
2. Set a Daily Time Commitment
Determine how much time you can dedicate each day—start with 30 minutes to 1 hour. Make it a non-negotiable part of your daily schedule. For example, you might decide to go for a brisk walk in the morning, do bodyweight exercises at home, or hit the gym. The goal is to establish a routine that becomes a natural part of your day.
3. Use Reminders and Push Through Initial Discomfort
Especially during the first two weeks, it’s normal to feel some resistance or emotional stress about starting new habits. Set reminders on your phone or calendar to prompt you. Be patient and persistent—initial discomfort will fade as your body adapts. Once exercise becomes a habit, it will feel less like a chore and more like a source of strength.
Final Tips for Success
Start Small, Progress Gradually: Don’t overcommit at the beginning; build gradually to avoid burnout.
Stay Consistent: Consistency beats intensity—daily effort compounds over time.
Track Your Progress: Keep a journal or use an app to monitor your activity and observe how you feel over the days.
Enjoy the Process: Find joy in the movement itself. As it becomes part of your routine, you'll notice improvements not only physically but also in your trading mindset.
Conclusion
A 14-day commitment to physical exercise can be a game-changer for your trading mindset. By boosting endorphins, increasing energy, enhancing brain function, and reducing health risks, you set the stage for more disciplined, confident, and resilient trading. Embrace this challenge—your mind and your portfolio will thank you.
✅ Follow me and save this educational post: "14-Day Mindset Challenge: Become a Top Trader — Day 1". Tomorrow, I'll be releasing Day 2 of the transformation... Stay tuned!
✅ Please share your thoughts about this article in the comments section below and HIT LIKE if you appreciate my post. Don't forget to FOLLOW ME; you will help us a lot with this small contribution.

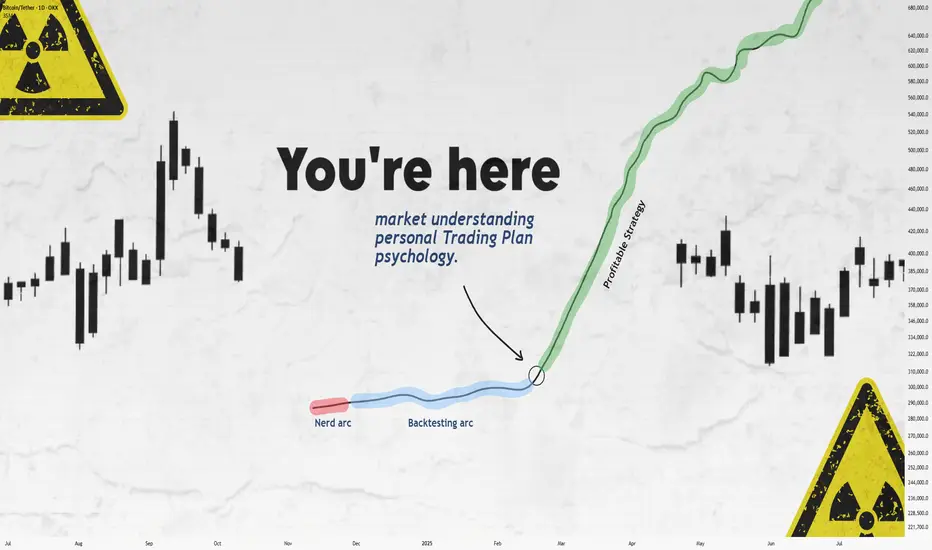
Still Losing After Backtesting? This Fixed It.Let’s get straight to it.
If you’ve gone through the "nerd arc" and the "backtesting arc" but still aren’t profitable...
What’s the fix?
In this short write-up, I’ll walk you through 3 brutal truths that made me finally see green.
Is it hard?
UH—Damn right.
But let’s go 👇
1. Market Understanding
This isn’t something you "learn" from a course.
It’s something that clicks after dozens of stop losses and live trades.
Here are a few ways I got more comfortable with it:
1. Don’t fear opening trades or hitting stop loss.
Each trade gives you data. More trades = more experience = better market feel.
What’s the requirement? Capital and risk management. Without that, you won’t even survive long enough to "get" it.
2. Journaling every single trade.
Write everything: your thoughts, screenshots, feelings — before and after.
Too lazy to do it? Left trading. Simple.
3. Be the detective.
Read the chart like a story. No, seriously.
Think of Bitcoin as a character with real moods.
Every candle tells you something.
That 5% pump? Buyers pushing up. Then bears smacked it down — candle closed red.
Now price is bleeding again.
Why?
🔍 Be the detective.
4. Analyze the market every day — even without trading.
The more you observe, the more you see. Structures. Patterns. Behavior.
Easy? Nah.
It takes discipline — like posting one story text to Insta for 1,000 days straight. Still wanna try?
2. Personal Trading Plan
Remember how I said "don’t fear opening trades"?
Well — after you’ve opened a bunch, you can start tailoring your own trading plan based on you.
This isn’t a PDF you can steal off Google.
Only after seeing how you behave in trades, you’ll know what rules make sense.
Maybe:
"I don’t trade when I’m emotionally off."
"This setup gave me the best results over 100 trades."
Just don’t copy-paste someone else’s rules.
Make a flexible structure, then let the details emerge from the market and your own experience.
Now —
Take a deep breath.
When was the last time you enjoyed your coffee?
More than a day ago?
Go make one now.
Might not get to taste it tomorrow.
Not everything in life is trading :)
3. Psychology
Ah, the final boss.
Still my weakest area, honestly.
But here are a few real things that helped:
Tip 1: WRITE.
Just write whatever you feel.
Telegram saved messages? Notebook?
Or if you're like me (🧠nerd), Notion.
Do it for 60 days straight — then feed that journal to ChatGPT and analyze yourself.
Takes time, but the patterns you'll see are... magical.
Tip 2: Money & Risk Management.
When you know your stop loss means only -0.25% of your capital…
why should you panic?
For me:
I place the SL, set a TP alert, and leave the screen.
No emotions, no fear.
Why? Because when capital is protected, so is my psychology.
Truth is, trading emotions aren’t just during the trade — they live in your head all day.
When your mental energy’s drained?
You’ll miss A+ setups.
Fall for BS ones.
Lose focus.
It’s complicated.
Because humans are complicated.
Our brains are the most tangled system known.
And somehow, out of all that noise, consciousness emerges.
A miracle.
So don’t expect to always feel calm.
Just aim to get better.
That’s it.
Thanks for sticking around.
These are just my thoughts, from one tired trader to another 🧠
I’m no expert—just sharing what’s worked (and what hasn’t).
If it helped, a boost would mean a lot.
🚫 Don’t FOMO
✅ Manage your capital
Until tomorrow —
Peace out. ✌️