Trend Doesn’t Cancel Corrections (And the Herd Always Pays)Yesterday, I made a call that sounded “wrong” to most retail traders.
✅ Silver will fill the gap.
✅ Gold will drop into the 4750 zone.
Both happened.
Not because I’m a prophet.
But because markets don’t work like retail emotions want them to work.
Even in a strong bullish trend, corrections are not a surprise — they’re a requirement.
And the trader who understands that simple fact will outperform the trader who only understands “up or down”.
1) A Trend Is Not a Straight Line — It’s a Negotiation
Retail traders love clean narratives:
- “Gold is bullish, so it must go up.”
- “Silver is strong, so dips are impossible.”
- “If news is positive, price must pump.”
But a real trend is not a straight line.
A trend is a sequence of impulses and corrections.
And every correction exists for a purpose:
- to rebalance positioning
- to shake out weak hands
- to refill liquidity
- to reset the market’s ability to continue
In other words:
Corrections are not “against the trend.”
They are the trend’s fuel.
If you’re only prepared for continuation, you’re not trading a trend…
You’re worshipping it.
2) The Herd Always Thinks in One Direction (Because It Feels Safe)
Here’s one of the most dangerous illusions in trading:
When everyone agrees, it feels like certainty.
But in markets, mass agreement usually means something else: the trade is already crowded.
That’s when you start seeing the same comments everywhere:
- “Gold only goes up 🚀”
- “This is the breakout!”
- “Buy every dip!”
- “No more pullbacks, strong fundamentals!”
And that’s exactly the moment you should pause.
Not because the crowd is always wrong…
…but because when everyone is positioned the same way, the market has a problem:
✅ too many stops in one place
✅ too many emotions in one direction
✅ too little liquidity for continuation
✅ too many people chasing the “obvious move”
That’s where the correction becomes not only likely… but necessary.
3) Even If You Don’t Fade the Herd… At Least Don’t Join It Late
Let’s be clear:
You don’t need to be the hero who always sells the top or buys the bottom.
Sometimes the highest-IQ decision is simply: Stay out.
Because most traders don’t lose money by being wrong…
They lose money by being late.
They enter after:
- the breakout is old news
- the move is extended
- the risk is huge
- the stop placement is obvious
- the crowd is fully committed
So the market does what markets always do: it punishes certainty.
That’s how bullish trends still produce brutal red candles.
Not because the trend is broken…
…but because positioning needs to be cleaned.
4) The Market Isn’t “Against You” — It’s Against Predictability
Retail wants predictability.
Smart money wants liquidity.
And retail provides liquidity in the most predictable way possible:
- buying after too many green candles
- selling after too many red candles
- placing stops in obvious locations
- reacting emotionally to headlines
This is why the “herd trade” is so profitable for the other side.
Not because smart money is magical.
But because retail behavior is repetitive.
And anything repetitive becomes exploitable.
5) “Trading Is Zero-Sum” — So Ask the One Question That Matters
Here is the part most traders avoid because it kills their fantasy: Trading is a zero-sum game (especially in leveraged derivatives).
Meaning: If you win, someone else loses.
Now ask yourself: If all retail is bullish… who is left to buy?
And more importantly: If everyone is bullish, who is the liquidity?
Because it’s never “smart money”.
Smart money isn’t the one buying the last breakout candle at maximum risk.
Retail is.
So if all retail is bullish and fully committed… then the real question becomes:
✅ who is trapped?
✅ who owns their stops?
✅ who will panic first?
And once you think this way, the market becomes clearer.
Not easier.
But clearer.
The Real Lesson: Trends Are Easy — Positioning Is Hard
Anyone can say:
“Gold is bullish.”
That’s not analysis.
That’s a weather report.
The real skill is knowing when:
- the bullish trend needs a correction
- the “obvious continuation” becomes the trap
- the herd has overloaded one side
- patience becomes the edge
Because the market rewards:
✅ timing
✅ discipline
✅ structure
✅ emotional neutrality
Not crowd confidence.
Final Thought
When you see everyone on the same side… don’t blindly fight them.
But most of all, don’t blindly join them.
Do the professional thing: pause, reassess, and respect the correction inside the trend.
Because in the end…
Smart money doesn’t need to outsmart everyone.
It only needs retail to behave like retail.
And retail never disappoints.
✅ Stay sharp.
✅ Stay patient.
✅ Stay out when it’s crowded.
That alone puts you ahead of 90% of traders.
Best Of Luck!
Mihai Iacob
Educationaltrade

Why Every Profitable Trader Keeps a JournalThe Difference Between Traders Who Improve and Those Who Don't? A Journal.
Every professional trader I've met keeps a journal.
Every struggling trader I've met doesn't.
This isn't coincidence. It's causation.
A trading journal transforms random experiences into systematic improvement. Without it, you're just gambling with extra steps.
Why Journaling Works
The Problem Without a Journal:
Same mistakes repeated
No idea what actually works
Feelings override facts
No feedback loop for improvement
The Solution With a Journal:
Patterns become visible
What works is documented
Data replaces feelings
Continuous improvement becomes possible
The Science:
Writing forces clarity. Reviewing creates awareness. Data enables optimization.
What to Track
Essential Data (Every Trade):
1. Trade Details
Date and time
Symbol
Direction (long/short)
Entry price
Exit price
Position size
2. Risk Parameters
Stop loss level
Take profit target
Risk amount ($)
Risk percentage (%)
3. Results
Profit/Loss ($)
Profit/Loss (%)
R-multiple (profit ÷ initial risk)
Win/Loss
4. Setup Information
Strategy/setup name
Timeframe
Market conditions
Reason for entry
Advanced Data (Recommended):
5. Execution Quality
Did you follow your rules?
Entry timing (early/on-time/late)
Exit timing
Slippage
6. Psychological State
Confidence level (1-10)
Emotional state before trade
Emotional state during trade
Any urges to deviate from plan
7. Market Context
Overall market direction
Volatility level
News/events
Sector performance
8. Screenshots
Chart at entry
Chart at exit
Annotated analysis
Journal Metrics to Calculate
Performance Metrics:
Win Rate = Winning Trades / Total Trades
Average Win = Total Profits / Winning Trades
Average Loss = Total Losses / Losing Trades
Profit Factor = Gross Profits / Gross Losses
Expectancy = (Win Rate × Avg Win) - (Loss Rate × Avg Loss)
Average R-Multiple = Total R / Total Trades
Process Metrics:
Rule Adherence = Trades Following Rules / Total Trades
Execution Score = Trades with Good Execution / Total Trades
Emotional Deviation Rate = Emotional Trades / Total Trades
Journal Analysis Framework
Weekly Review:
Total trades taken
Win rate for the week
Total P&L
Best and worst trades
Rule adherence score
Lessons learned
Monthly Review:
Performance vs expectations
Strategy breakdown (which strategies worked?)
Time analysis (best/worst times to trade)
Psychological patterns
Areas for improvement
Goals for next month
Quarterly Review:
Overall performance assessment
Strategy evaluation (keep/modify/discard)
Risk management review
Goal progress
Major lessons
Plan adjustments
AI-Enhanced Journaling
1. Automatic Data Capture
AI can automatically log:
Trade executions from broker
Entry/exit prices
Position sizes
Timestamps
2. Pattern Recognition
AI analyzes your journal to find:
Which setups perform best
What times you trade best
Which market conditions suit you
Emotional patterns affecting performance
3. Performance Attribution
AI breaks down returns by:
Strategy
Time of day
Market condition
Position size
Holding period
4. Predictive Insights
AI identifies:
When you're likely to make mistakes
Which trades to avoid
Optimal position sizing based on conditions
Performance degradation signals
5. Automated Reporting
AI generates:
Daily summaries
Weekly performance reports
Monthly analytics
Custom dashboards
What Your Journal Reveals
Pattern 1: Time-Based Performance
"I lose money in the first hour of trading."
→ Solution: Don't trade the first hour.
Pattern 2: Setup Performance
"Breakout trades have 30% win rate, pullback trades have 60%."
→ Solution: Focus on pullback trades.
Pattern 3: Emotional Patterns
"After a big win, my next trade is usually a loss."
→ Solution: Take a break after big wins.
Pattern 4: Size Impact
"Larger positions have worse performance."
→ Solution: Reduce position sizes.
Pattern 5: Market Conditions
"I perform well in trending markets, poorly in ranging."
→ Solution: Reduce trading in ranging markets.
Journaling Mistakes
Only Logging Winners — Selective memory makes you feel good but teaches nothing. Log every trade, especially losers.
Not Reviewing — A journal you never read is just a diary. Schedule weekly and monthly reviews.
Too Much Detail — Overwhelming detail leads to abandonment. Start simple, add complexity gradually.
Only Tracking Results — P&L alone doesn't tell you why. Track process metrics, not just outcomes.
Inconsistent Logging — Gaps in data make analysis impossible. Log immediately after every trade.
Getting Started
Week 1: Basic Logging
Log every trade with essential data
Don't worry about analysis yet
Build the habit
Week 2-4: Add Context
Include screenshots
Note emotional state
Record market conditions
Month 2: Begin Analysis
Calculate basic metrics
Do first weekly review
Identify one pattern
Month 3+: Optimize
Refine based on findings
Add advanced metrics
Implement AI tools if available
Key Takeaways
A trading journal transforms random experience into systematic improvement
Track both results (P&L) and process (rule adherence, emotions)
Review regularly — weekly, monthly, quarterly
AI can automate data capture and reveal hidden patterns
The journal is only valuable if you actually use it to change behavior
Your Turn
Do you currently keep a trading journal?
What's the most valuable insight you've discovered from reviewing your trades?
Share your journaling approach below 👇

Hidden Risk: When All Your Trades Move TogetherYou Think You Have 10 Positions. You Actually Have 1 Big Bet.
"I'm diversified - I have positions in 10 different stocks."
But if those 10 stocks all move together, you don't have 10 positions. You have one giant position wearing 10 different masks.
Correlation is the hidden risk that destroys "diversified" portfolios. Understanding it is non-negotiable.
What Is Correlation?
Definition:
Correlation measures how two assets move in relation to each other.
The Scale:
+1.0 = Perfect positive correlation (move together exactly)
0.0 = No correlation (independent movement)
-1.0 = Perfect negative correlation (move opposite exactly)
In Practice:
0.7 to 1.0 = Highly correlated
0.3 to 0.7 = Moderately correlated
-0.3 to 0.3 = Low correlation
-0.7 to -0.3 = Moderately negative correlation
-1.0 to -0.7 = Highly negative correlation
Why Correlation Matters
The Diversification Illusion:
You have 5 positions, each risking 2% of your account.
Total risk = 10%, right?
Wrong.
If all 5 positions are highly correlated (0.9+), your true risk is closer to:
5 × 2% × correlation factor = much higher than 10%
When they all move against you simultaneously, you don't lose 2% five times. You lose 10% all at once.
The 2008 Lesson:
"Diversified" portfolios collapsed together because correlations spiked to near 1.0 during the crisis. Everything fell at once.
Types of Correlation
1. Asset Correlation
How individual assets move together.
AAPL and MSFT: High correlation (both tech)
AAPL and XOM: Lower correlation (different sectors)
2. Sector Correlation
How sectors move together.
Tech and Growth: High correlation
Utilities and Tech: Lower correlation
3. Asset Class Correlation
How different asset classes move together.
Stocks and Bonds: Historically negative (but not always)
Stocks and Crypto: Increasingly correlated
4. Strategy Correlation
How different trading strategies move together.
Two momentum strategies: High correlation
Momentum and Mean Reversion: Lower correlation
Correlation Dynamics
Key Insight: Correlations Change
Correlations are not static. They shift based on:
Market regime (risk-on vs risk-off)
Volatility levels
Macro events
Time period measured
The Danger:
Correlations tend to spike toward 1.0 during crises.
Normal times: Assets move somewhat independently
Crisis times: Everything falls together
This Is When Diversification Fails You Most
Exactly when you need protection, correlations increase and your "diversified" portfolio acts as one.
How AI Analyzes Correlation
1. Real-Time Correlation Matrices
AI calculates correlation between all portfolio assets continuously.
2. Rolling Correlation
AI tracks how correlations change over time.
30-day rolling correlation
90-day rolling correlation
Identifies correlation regime changes
3. Stress Testing
AI simulates portfolio behavior when correlations spike.
What if all correlations go to 0.9?
What's the worst-case portfolio loss?
4. Correlation Clustering
AI groups assets by correlation patterns.
Identifies hidden clusters
Reveals true portfolio concentration
Managing Correlation Risk
Strategy 1: True Diversification
Don't just own different tickers. Own truly uncorrelated assets.
Checklist:
Different sectors
Different asset classes
Different geographies
Different strategies
Strategy 2: Correlation-Adjusted Position Sizing
Reduce position sizes when adding correlated assets.
Example:
First tech stock: 2% risk
Second tech stock (0.8 correlation): 1% risk
Third tech stock (0.85 correlation): 0.5% risk
Strategy 3: Correlation Limits
Set maximum correlation exposure.
Rule Example:
"No more than 30% of portfolio in assets with correlation > 0.7"
Strategy 4: Hedge with Negative Correlation
Add assets that move opposite to your main positions.
Examples:
Long stocks + Long volatility (VIX)
Long growth + Long value
Long risk assets + Long safe havens
Correlation Mistakes
Assuming Stable Correlations — "These assets have been uncorrelated for years." Reality: Correlations change, especially during stress. Plan for correlation spikes in your risk management.
Sector "Diversification" — "I own 10 different tech stocks, so I'm diversified." Reality: Same sector = high correlation = concentrated risk. Diversify across sectors, not just tickers.
Ignoring Strategy Correlation — Running 5 momentum strategies thinking they're independent. Reality: Same strategy type = correlated returns. Diversify strategy types, not just parameters.
Chasing Negative Correlation — "I'll just add negatively correlated assets." Reality: True negative correlation is rare and unstable. Focus on low correlation (near 0), not negative.
Correlation Analysis Framework
Step 1: Map Your Portfolio
List all positions and their characteristics:
Sector
Asset class
Strategy type
Geography
Step 2: Calculate Correlations
Use historical data to calculate correlation matrix.
Minimum 1 year of data
Consider multiple timeframes
Step 3: Identify Clusters
Group highly correlated positions.
Treat clusters as single positions for risk purposes
Step 4: Stress Test
Ask: "What if correlations spike to 0.9?"
Calculate worst-case portfolio loss
Ensure it's survivable
Step 5: Adjust
Reduce correlated positions
Add uncorrelated assets
Set correlation limits
Correlation Red Flags
All Positions in Same Sector — Even "different" companies in same sector are highly correlated.
All Positions Same Direction — All long or all short = directional concentration.
Correlation Increasing — Rolling correlation trending toward 1.0 = increasing risk.
Crisis Correlation Spike — During market stress, check if correlations are spiking.
Key Takeaways
Correlation measures how assets move together — high correlation = concentrated risk
"Diversified" portfolios often aren't — same sector/strategy = hidden concentration
Correlations spike during crises — exactly when you need diversification most
AI can calculate real-time correlation matrices and stress test portfolios
True diversification requires different sectors, asset classes, and strategies
Your Turn
Have you ever been surprised when "diversified" positions all moved against you?
How do you currently think about correlation in your portfolio?
Share your experience below 👇

The trend is your friendHello everyone. I’m a financier and this is educational post that might help you get closer to consistent profitability (if you actually get the point).
Today I want to talk about trend trading. Yes - that very “best friend of a trader” that every book and every course keeps repeating. And after years in the market I can say: it’s not just a cliché - it really works.
I’ve been through plenty of strategies: classic TA, Elliott Waves, Smart Money Concepts, Williams’ trading chaos - you name it. I’ve traded with the trend, against it, and inside ranges.
Honestly, the results were average. My monthly win rate was about 30–40%. Not terrible, but I wanted fewer mistakes and more stability.
Eventually I set one hard rule for myself:
👉 I only trade in the direction of the trend.
And statistically, that mostly means trading the uptrend.
Here’s the logic. Any asset can drop around 99.99% - the downside is capped. But to the upside there is no limit. An asset can grow 2x, 5x, 10x and more. So statistically, longs are more favorable. I still take shorts when the market structure is bearish, but lately most assets are trending up.
So what’s the real advantage of trading with the trend?
The market has its own momentum. It’s simply easier to move with that flow than to fight it. I stopped trying to outsmart the market or predict every reversal. I don’t obsess over overbought/oversold signals. I just wait for my setup - the same repeatable scenario - and I trade it in the direction of the trend.
I’m a boring trader - and that’s exactly why I’m a profitable trader.
On social platforms my job is to share analysis and possible scenarios. But trading itself is different: the goal is not to predict, the goal is to execute. If the setup plays out - great. If not -no problem, I wait for the next one. I’m no longer a hostage to my own forecasts, which only kill objectivity.
Trend filters out a huge number of bad trades. It instantly removes about half of all random entries. After I really internalized that, my win rate improved, my psychology inside trades got much cleaner, less FOMO, less second-guessing. I stopped guessing - and started systematically executing.
So my takeaway for today:
👉 Trend really is your friend.
Try focusing only on trend trading and then tell me in the comments how it changed your results and mindset.

Zooming Out and In: AI-Powered Multi-Timeframe Mastery
You're Bullish on the 5-Minute Chart. You're Bearish on the Daily. Who's Right?
This conflict destroys more traders than bad entries ever will.
Multi-timeframe analysis isn't optional - it's the difference between trading with the current and swimming against it.
AI doesn't have the human limitation of only seeing one chart at a time. Here's how to think like the machine.
The Timeframe Hierarchy
The Principle:
Higher timeframes carry more weight than lower timeframes.
Why:
More data points = more statistical significance
Larger players operate on higher timeframes
Trends on higher timeframes persist longer
Lower timeframe noise gets filtered out
The Hierarchy:
Monthly → Macro Trend
Weekly → Swing Trend
Daily → Position Trend
4H → Swing Trade
1H → Day Trade
15M → Scalp
5M/1M → Noise
The Three-Timeframe Framework
Timeframe 1: Trend (Higher)
Purpose: Determine overall direction
What is the dominant trend?
Where are major support/resistance levels?
What's the big picture context?
Timeframe 2: Signal (Trading)
Purpose: Find entry opportunities
Where are setups forming?
What patterns are developing?
Where should entries be placed?
Timeframe 3: Execution (Lower)
Purpose: Optimize entry timing
Where is the precise entry?
What's the immediate momentum?
Where should the stop go?
Example Combinations:
Position Trading: Monthly → Weekly → Daily
Swing Trading: Weekly → Daily → 4H
Day Trading: Daily → 1H → 15M
Scalping: 4H → 15M → 5M
How AI Processes Multiple Timeframes
Human Limitation:
You can only look at one chart at a time. Switching between timeframes takes time and mental energy.
AI Advantage:
Processes all timeframes simultaneously, identifying:
Alignment (all timeframes agree)
Conflict (timeframes disagree)
Confluence (multiple signals at same price)
AI Multi-Timeframe Logic:
Calculate trend on TF1 (higher)
Calculate trend on TF2 (trading)
Calculate trend on TF3 (lower)
If all aligned: Signal strength = HIGH
If 2 of 3 aligned: Signal strength = MEDIUM
If conflicting: Signal strength = LOW or NO TRADE
Timeframe Alignment Signals
Full Alignment (Strongest)
Higher TF: Uptrend
Trading TF: Uptrend
Lower TF: Uptrend
Action: High-confidence long entries
Partial Alignment (Moderate)
Higher TF: Uptrend
Trading TF: Pullback in uptrend
Lower TF: Downtrend (temporary)
Action: Wait for lower TF to turn, then enter
Conflict (Weakest/No Trade)
Higher TF: Uptrend
Trading TF: Downtrend
Lower TF: Uptrend
Action: Wait for clarity or reduce size
Practical Multi-Timeframe Workflow
Step 1: Start High
Open your highest timeframe first.
What's the trend?
Where are key levels?
What's the context?
Step 2: Move to Trading Timeframe
Look for setups that align with higher TF.
Is there a pattern forming?
Does it align with higher TF direction?
Where would entry make sense?
Step 3: Drop to Execution Timeframe
Fine-tune your entry.
What's the immediate momentum?
Where's the optimal entry point?
Where should the stop go?
Step 4: Execute and Manage
Enter on lower TF, manage on trading TF.
Don't let lower TF noise shake you out
Use trading TF for trade management
Reference higher TF for overall thesis
Common Multi-Timeframe Mistakes
Fighting the Higher Timeframe — Taking shorts in a strong weekly uptrend because the 15M looks bearish. Higher timeframe wins. Trade with it, not against it.
Analysis Paralysis — Looking at so many timeframes that you never take a trade. Stick to three timeframes maximum.
Timeframe Hopping — Switching timeframes to justify a trade you want to take. Define your timeframes BEFORE looking at charts.
Managing on Wrong Timeframe — Entering on 1H, then panicking at every 5M candle. Manage trades on the timeframe you entered on.
Ignoring Timeframe Transitions — Not recognizing when higher TF trend is changing. Regularly check higher TF for trend health.
AI-Enhanced Multi-Timeframe Indicators
Concept 1: Trend Alignment Score
Single number showing alignment across timeframes.
Score = (TF1_trend × 3) + (TF2_trend × 2) + (TF3_trend × 1)
Where trend = +1 (up), 0 (neutral), -1 (down)
Max bullish = +6
Max bearish = -6
Concept 2: Multi-Timeframe Moving Average
Shows MA from higher timeframe on lower timeframe chart.
Application:
Daily 200 MA plotted on 1H chart
Provides context without switching charts
Concept 3: Timeframe Confluence Zones
Identifies price levels significant on multiple timeframes.
Application:
Support on daily AND weekly = stronger level
Resistance on 4H AND daily = more significant
Building Your Multi-Timeframe System
Define Your Timeframes:
Based on your trading style, select:
Trend timeframe (context)
Signal timeframe (setups)
Execution timeframe (entries)
Create Alignment Rules:
What constitutes "aligned"?
What do you do when conflicted?
How do you handle transitions?
Build Checklists:
Before Any Trade:
What's the higher TF trend?
Does trading TF setup align?
Is lower TF confirming entry?
During Trade:
Is higher TF thesis still valid?
Is trading TF structure intact?
Am I managing on correct TF?
Timeframe-Specific Characteristics
Monthly/Weekly:
Institutional positioning
Macro trends
Major support/resistance
Slow to change
Daily:
Swing trade setups
Clear trend structure
Key for most traders
Balances noise and signal
4H/1H:
Day trade setups
Intraday trends
More noise than daily
Faster signals
15M/5M:
Scalp entries
Execution timing
High noise
Requires quick decisions
1M:
Mostly noise
Only for precise execution
Not for analysis
Easy to overtrade
Key Takeaways
Higher timeframes carry more weight than lower timeframes
Use three timeframes: Trend (context), Signal (setups), Execution (entries)
Full alignment = strongest signals; conflict = wait or skip
AI can process all timeframes simultaneously — humans must be systematic
Manage trades on the timeframe you entered, not lower
Your Turn
What timeframes do you currently use in your trading?
Have you experienced the conflict of different timeframes showing opposite signals?
Share your multi-timeframe strategy below 👇

Sentiment Analysis: How AI Reads the Market's Emotional State
Markets Are Driven by Emotion - AI Can Now Read That Emotion at Scale
"Be fearful when others are greedy, and greedy when others are fearful."
Everyone knows this quote. Few can actually measure fear and greed in real-time.
AI changes that. Sentiment analysis allows you to quantify what the crowd is feeling - and position accordingly.
What Is Sentiment Analysis?
Definition:
Sentiment analysis uses natural language processing (NLP) to determine the emotional tone of text — positive, negative, or neutral.
In Trading:
Applied to:
News articles and headlines
Social media posts (Twitter/X, Reddit, etc.)
Earnings call transcripts
Analyst reports
Forum discussions
The Goal:
Quantify market mood to identify extremes and potential turning points.
How AI Processes Sentiment
Step 1: Data Collection
AI gathers text from multiple sources:
Financial news feeds
Social media APIs
Forum scrapers
Earnings transcripts
Step 2: Text Processing
Natural Language Processing (NLP):
Tokenization (breaking text into words)
Removing noise (stop words, punctuation)
Identifying relevant entities (tickers, companies)
Step 3: Sentiment Classification
Each piece of text is scored:
Positive (+1)
Negative (-1)
Neutral (0)
Or a continuous scale (-1 to +1)
Step 4: Aggregation
Individual scores are combined:
By asset (all mentions of a ticker)
By time (hourly, daily sentiment)
By source (news vs social media)
Step 5: Signal Generation
Extreme readings trigger alerts:
Extreme fear → potential buying opportunity
Extreme greed → potential selling opportunity
Types of Sentiment Indicators
1. News Sentiment
Analyzes financial news headlines and articles.
Characteristics:
More reliable, professional sources
Slower to update
Often reflects institutional view
Less noise, more signal
2. Social Media Sentiment
Analyzes Twitter/X, Reddit, StockTwits, etc.
Characteristics:
Real-time updates
High noise level
Reflects retail sentiment
Can identify viral narratives early
3. Options Sentiment
Derived from options market activity.
Indicators:
Put/Call ratio
Implied volatility skew
Options volume patterns
4. On-Chain Sentiment (Crypto)
Blockchain data revealing holder behavior.
Indicators:
Exchange inflows/outflows
Holder distribution changes
Stablecoin flows
5. Composite Sentiment
Combines multiple sources into single score.
Example: Fear & Greed Index
Volatility
Market momentum
Social media
Surveys
Safe haven demand
Trading Sentiment Extremes
The Contrarian Approach:
Sentiment works best at extremes:
Extreme fear often marks bottoms
Extreme greed often marks tops
Why This Works:
At extremes, most participants are already positioned
Few buyers left at peak greed
Few sellers left at peak fear
Reversals become more likely
The Confirmation Approach:
Use sentiment to confirm existing analysis:
Bullish setup + improving sentiment = stronger signal
Bearish setup + deteriorating sentiment = stronger signal
Sentiment Analysis Framework
Level 1: Identify Current Sentiment
What is the overall market mood?
Is it extreme or neutral?
What's driving the sentiment?
Level 2: Compare to Price Action
Is sentiment confirming price?
Or is there divergence?
Divergence often precedes reversals
Level 3: Identify Sentiment Shifts
Is sentiment improving or deteriorating?
Rate of change matters
Rapid shifts can signal turning points
Level 4: Context Integration
What's the fundamental backdrop?
Are there upcoming events?
Does sentiment make sense given context?
AI Sentiment Tools and Techniques
Technique 1: Keyword Scoring
Simple approach:
Define positive words (bullish, moon, buy)
Define negative words (crash, dump, sell)
Count occurrences and calculate ratio
Limitation: Misses context and sarcasm
Technique 2: Machine Learning Classification
Train models on labeled data:
Human-labeled examples of positive/negative text
Model learns patterns
Applies to new text
Advantage: Better context understanding
Technique 3: Large Language Models
Modern approach:
Pre-trained on massive text datasets
Fine-tuned for financial sentiment
Understands nuance and context
Advantage: Handles complex language, sarcasm, implied meaning
Technique 4: Entity-Specific Sentiment
Not just "is this positive?" but "is this positive for NASDAQ:AAPL ?"
Same headline can be:
Positive for one company
Negative for competitor
Neutral for market
Sentiment Analysis Pitfalls
Lagging Indicator — By the time sentiment is measurably extreme, the move may be mostly done. Focus on rate of change, not absolute level.
Noise in Social Media — Bots, spam, and coordinated campaigns distort readings. Filter sources, weight by credibility.
Sarcasm and Context — "Great, another crash" — is this positive or negative? Use advanced NLP models.
Self-Fulfilling Prophecy — If everyone uses the same sentiment indicator, it stops working. Combine with other analysis.
Different Timeframes — Social media sentiment changes hourly. Fundamental sentiment changes monthly. Match to your trading timeframe.
Building a Sentiment Dashboard
Components:
Overall Market Sentiment — Fear & Greed Index or equivalent, historical percentile ranking
Asset-Specific Sentiment — News sentiment for your watchlist, social media buzz and tone
Sentiment Momentum — Is sentiment improving or deteriorating? Rate of change indicators
Divergence Alerts — Price up, sentiment down (warning); Price down, sentiment up (opportunity?)
Extreme Readings — Historical extreme alerts, percentile rankings
Practical Implementation
For Beginners:
Use existing sentiment indicators (Fear & Greed Index)
Monitor social media manually for your assets
Note sentiment in your trading journal
For Intermediate:
Subscribe to sentiment data feeds
Build simple sentiment tracking spreadsheets
Backtest sentiment signals
For Advanced:
Build custom NLP pipelines
Train asset-specific sentiment models
Integrate real-time sentiment into trading systems
Sentiment Case Studies
Case 1: COVID Crash (March 2020)
Fear reached historic extremes
Social media was apocalyptic
Contrarian buyers were rewarded massively
Case 2: Meme Stock Mania (2021)
Social media sentiment exploded
Greed indicators maxed out
Late buyers suffered significant losses
Case 3: Crypto Winter (2022)
Sentiment collapsed to extreme fear
"Crypto is dead" headlines dominated
Marked significant accumulation zone
Key Takeaways
Sentiment analysis quantifies market emotion using AI and NLP
Extreme sentiment readings often precede reversals
Multiple sentiment sources (news, social, options) provide fuller picture
Sentiment works best as confirmation or at extremes, not as standalone signal
Modern AI can understand context, sarcasm, and nuance in text
Your Turn
Do you currently track market sentiment in your trading?
What sources do you find most useful for gauging market mood?
Share your approach below 👇

Options Greeks + AI: The New Era of Derivatives Trading
Options Already Feel Like 4D Chess - AI Just Adds More Dimensions
For many traders, options feel intimidating because there isn't just "price" — there are Greeks, volatility, time decay, and complex payoffs.
AI doesn't magically simplify options. What it does is help you see and manage all those moving parts at once.
---
Quick Greek Refresher (The Calm Version)
Delta (Δ) – How much the option price moves when the underlying moves
Gamma (Γ) – How fast Delta itself changes
Theta (Θ) – How much you pay or collect per day in time decay
Vega (ν) – How much the option responds to changes in implied volatility
Think of it like this:
Delta: Direction
Gamma: Acceleration
Theta: Rent for time
Vega: Sensitivity to fear/volatility
---
Where AI Actually Helps With Options
Instead of guessing, AI‑driven tools can:
Monitor your total portfolio Greeks in real‑time (net Delta, net Vega, etc.)
Run what‑if scenarios : "What happens to my P&L if we gap 3% overnight? If IV drops 10 points?"
Search across chains to find structures that fit your risk profile
You still choose the playbook. AI just gives you a clearer picture of the board.
---
Example: Using AI for Volatility, Not Just Direction
Most traders focus on "Will price go up or down?".
Options traders (and their models) often focus on:
"Will price move more or less than the market expects?" (Realized vs implied volatility)
AI can:
Compare current implied volatility to realized volatility over multiple windows
Flag when options look historically expensive or cheap
Suggest whether you should be long or short volatility for your idea
Direction is still a bet - but at least now, your bet on volatility is informed.
---

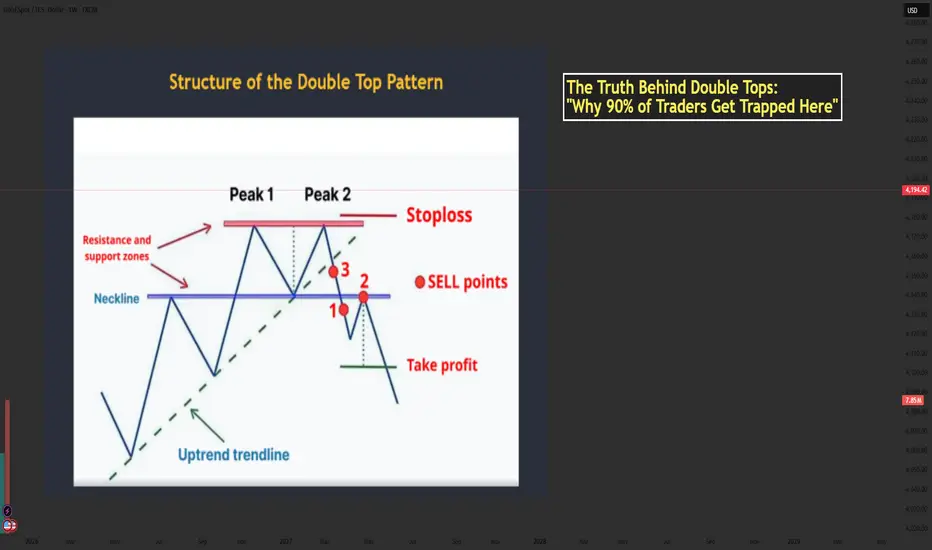
The Truth Behind Double Tops: Why 90% of Traders Get Trapped...📘 Mastering the Double Top Pattern — Structure, Psychology & How Smart Money Uses It
- The Double Top is one of the most powerful reversal patterns in technical analysis. When used correctly, it helps traders catch the transition from bullish momentum → bearish reversal with high accuracy.
- Let’s break down the structure using the chart you provided and enhance it with professional-level insights.
🔶 1. Structure of the Double Top
1️⃣ The First Top
- Price pushes upward strongly during an uptrend.
- Buyers are in full control and create the first peak.
- After reaching resistance, price pulls back → forming the neckline.
This pullback is normal and represents the market taking profits.
2️⃣ The Second Top
- Price rallies again but fails to break above Peak 1.
- This failure is extremely important — it shows bulls are losing strength.
- The second top traps late buyers who expect a breakout.
3️⃣ The Neckline Break
- Once price breaks below the neckline, the structure is officially confirmed.
- This represents sellers overwhelming buyers.
- A break of structure → shift in market control.
📌 Professional traders only consider the pattern valid AFTER the neckline break.
🔶 2. Market Psychology Behind the Double Top
Understanding the pattern’s psychology is what separates beginners from professional traders.
1️⃣ At Peak 1
Bulls believe the trend will continue.
Retail traders buy aggressively.
2️⃣ Pullback to Neckline
A healthy correction occurs; no one expects a reversal yet.
3️⃣ At Peak 2
This is where emotions start to shift:
- Retail buyers expect a breakout.
- Smart Money uses this area as a liquidity zone to trigger buy stops.
- Institutions often sell into this liquidity, creating the foundation for reversal.
4️⃣ Neckline Break
Panic begins:
Buyers trapped at Peak 2 start closing positions.
Sellers enter aggressively.
Momentum shifts — the trend has reversed.
5️⃣ Retest
The retest is a psychological trap:
- Trapped buyers hope for “one more push up.”
- Sellers add positions at better prices.
- When price rejects the neckline → the downtrend accelerates.
💡 This is why the retest is the safest sell entry.
🔶 3. Conditions for a High-Quality Double Top
To avoid fake patterns, check these criteria:
✔️ Must appear after a clear uptrend
✔️ Both tops should be similar in height
✔️ Volume should decrease on the second top
✔️ Neckline breakout must be decisive and clean
✔️ Better if second peak creates a stop-hunt wicking above Peak 1
✔️ Even more powerful when aligned with:
- HTF resistance
- Institutional zones
- Liquidity sweeps
- Overbought RSI
- Divergence
🔶 4. How to Trade the Double Top
1️⃣ Entry (Sell Zone)
Best Entry:
👉 SELL on the neckline retest after the breakout.
This gives:
- Best accuracy
- Best risk–reward
- Confirmation that the market has shifted bearish
2️⃣ Stop Loss Placement
Place SL:
- Above Peak 2
- Or above Peak 1 (more conservative)
🛑 SL must sit outside the structure to avoid fake moves.
3️⃣ Take Profit Target
The classic measurement:
- Distance from Peak → Neckline
- Projected downward
This gives the first TP.
TP2 can be placed at:
Next support zone
- Fib 1.618 extension
- HTF demand area
🔶 5. Real Market Example
Your image shows:
- Two clear peaks forming under a resistance zone
- Neckline support holding price
- A strong break below the neckline
- Sell entries at the ideal points:
+ Point 1 → aggressive breakout trader
+ Point 2 → safest retest entry
+ Point 3 → early anticipation entry (riskier)
The downward projection after the pattern aligns perfectly with the expected target zone.
🔶 6. Trader Psychology: Why People Lose with Double Tops
Most traders get trapped because they:
❌ Sell too early (before neckline break)
❌ Expect the second top to drop immediately
❌ Ignore volume or candle strength
❌ Enter without waiting for retest
❌ Fear missing out and chase price after the big drop
Smart Money uses these emotions:
- Greed → traps buyers at Peak 2
- Fear → forces panic selling at neckline break
- FOMO → attracts late sellers at the worst price
Your job is to stay patient and enter only at the retest, where probability is highest.
🔶 7. Professional Tips to Master the Double Top
✔️ Wait for structure confirmation → neckline break
✔️ Don’t sell inside the range between the two peaks
✔️ Use RSI divergence to strengthen accuracy
✔️ Look for stop-hunt wicks above Peak 2
✔️ Combine with trendline breaks for timing
✔️ Use a top-down approach (H4 + H1 → M15 entry)
✨ Final Message for Traders
The Double Top is not just a pattern it is a reflection of fear, greed, and trapped liquidity.
Master the psychology behind it, and it becomes one of your most reliable reversal tools.
If this helped your trading, drop a comment and share your thoughts!
Let’s grow together. ❤️📈
Release the Pressure: Why Relaxed Traders Win MoreOne of the most overlooked psychological factors in trading is pressure — the silent force that makes you enter trades too early, exit too late, and misread what’s actually happening on the chart.
The truth is simple:
When you relax, you trade better.
The Illusion of “Always Doing Something”
Many traders feel that if they’re not in a trade, they’re missing out.
The market becomes a constant test of patience — and silence between trades feels unbearable.
That’s when poor decisions appear: forced entries, revenge trades, and overtrading to “feel productive.”
But the market doesn’t reward effort; it rewards timing.
Trading well often looks like doing nothing most of the time.
You wait, you observe, and you strike when the setup aligns.
This is where the relaxed mindset beats the pressured mindset every single time.
Example: Gold (XAUUSD) Between 3960 and 4030
Let’s take gold as an example.
As explained in my recent analysis, we have two clear levels to watch — 3960 and 4030.
Price is currently trading in between.
Even though it may look like it’s pressing upward and could form an ascending triangle, clarity only comes with a real breakout, not with anticipation.
A pressured trader will often feel the urge to predict — to “get in early” before confirmation.
But the calm trader simply waits.
They know that between levels, price action is noise, not opportunity.
And when clarity comes — either through a clean breakout or a rejection — the decision is obvious and stress-free.
This is what “releasing the pressure” looks like in practice:
You don’t force a trade. You let the market reveal the next step.
Why Pressure Kills Performance
Pressure doesn’t just come from the charts — it comes from expectations.
The trader who needs to make x$ per day will subconsciously search for confirmation that a trade exists.
Charts suddenly look clearer than they actually are.
Bias replaces logic.
And objectivity, which is the foundation of good trading, fades away.
In reality, the more you need to make money from trading, the harder it becomes to do so.
That’s not because the market is cruel — it’s because the human brain under stress stops processing probabilities correctly.
The Paradox of Ease
Every trader eventually experiences this paradox:
The less you try to “make something happen,” the more naturally good trades appear.
This isn’t mystical — it’s psychological.
When the mind is calm, your ability to notice quality setups improves dramatically.
You stop trying to control the market and start aligning with it.
It’s the difference between chasing a wave and surfing one.
Creating Space to Breathe
The professional approach to trading is not about constant activity — it’s about creating the conditions where clarity thrives.
That means reducing pressure in three ways:
1. Detach from daily profit goals.
The market doesn’t care about your personal targets. Focus on setups, not outcomes.
2. Allow financial breathing room.
When your rent, bills, and daily life depend on your next trade, emotional clarity disappears.
Build a secondary income or savings buffer — not for luxury, but for mental freedom.
3 . Redefine success.
A good trading day is not one with profit — it’s one with discipline.
When you measure success by process, not by dollars, you take power back from the market.
Final Thought
Most traders lose not because they lack skill, but because they trade under pressure.
The weight of expectation distorts perception, and the market punishes impatience.
Release the pressure — mentally, financially, and emotionally.
When you do, trading starts to flow the way it was meant to:
Quietly, naturally, profitably.

The Monty Hall Paradox in TradingMost traders think the Monty Hall paradox has nothing to do with markets.
But every time you refuse to change your bias — it plays out right in your chart.
At the beginning of October, I started looking for signs of a drop in gold.
They came very late.
Instead, from October 1st, gold rallied more than 5000 pips before dropping.
I was aware of the Monty Hall paradox — and yet, I didn’t switch.
And this post is not about why I didn’t switch.
It’s about understanding the paradox itself, and how it quietly plays out in trading every single day.
Because yes — gold eventually dropped, and it dropped hard.
But before falling 5,000 pips, it first rose 5,000 pips — and before that rise even began, the market clearly opened a door just before breaking above 4,000 pips — a door I chose to ignore.
That’s exactly what this article is about: recognizing when the market opens new doors, and understanding why switching — just like in the Monty Hall paradox — often gives you the better odds.
🎭 The Original Paradox
The Monty Hall problem comes from an old game show called "Let’s Make a Deal ".
There are three doors: behind one is a car, and behind the others are goats.
You pick one door.
The host, who knows what’s behind them, opens another door — always showing a goat.
Then he asks:
“Do you want to stay with your first choice or switch?”
Most people stay
But mathematically, you should switch — because the probability of winning jumps from 1/3 to 2/3 after that reveal.
The host didn’t change the car’s position — he changed the information you have.
And that’s what makes all the difference.
If you’ve never heard of the original paradox, you might remember it from the film "21" with Kevin Spacey — the scene where he teaches probability through deception, using the Monty Hall setup to show how humans instinctively trust their first choice.
That’s exactly what markets do: they give you partial information, make you feel confident, and then quietly shift the odds while you’re still defending your initial pick.
📊 The Trading Version
In trading, there are no doors — only biases.
But the logic is identical.
When you open a trade, you’re making a probabilistic choice based on incomplete data.
You think it’s 50–50 — up or down — but it’s not.
You’re guessing direction, but also timing.
In reality, your initial bias might have a 1/3 chance of being fully correct.
Then the market — our version of Monty Hall — reveals new information:
a failed breakout, a strong reversal candle, a macro shift, a sudden volume surge.
That’s the door opening.
And now you face the same question:
“Do you stay with your first choice or switch?”
🧠 Why Most Traders Don’t Switch
Because switching feels like admitting you were wrong.
Ego and attachment to our analysis make us defend our initial position, even as evidence piles up against it.
But the market doesn’t reward stubbornness — it rewards adaptation.
Refusing to switch isn’t strength; it’s emotional inertia.
🔁 What “Switching” Really Means
It doesn’t always mean reversing your trade.
It can mean:
- Cutting your loss early instead of waiting for stop loss
- Closing a position that started “right” but begins behaving wrong.
- Flipping your bias when the structure proves you wrong.
- Or simply, pausing — accepting that the setup no longer fits the data.
In each case, you’re doing what the smart contestant in Monty Hall does:
You’re updating your probabilities as new information arrives.
💬 The Lesson
The paradox isn’t about doors — it’s about humility.
About understanding that the first choice you make in trading could end up not being the best one.
The best traders don’t need to be right.
They need to be flexible enough to become right later.
So the next time the market “opens a door” — don’t get defensive.
Recalculate. Reassess.
Sometimes, switching is the only way to stay in the game.
🚀 Closing Thought
The Monty Hall paradox isn’t about luck; it’s about using information wisely.
The same rule applies to trading:
If the market gives you new data, use it — even if it means admitting your first bias was wrong.
Because the moment you stop defending your first choice, you finally start trading with probability — not pride.
P.S.
Although I did manage to make some profit on short trades, that’s beside the point.
What truly matters is that the market clearly opened a door at the beginning of October — and even though I saw it, I ignored it.
Yes, the market eventually dropped as initially expected, but that too is beside the point.
This isn’t about being right in the end; it’s about recognizing when the market opens new doors and having the courage to walk through them.

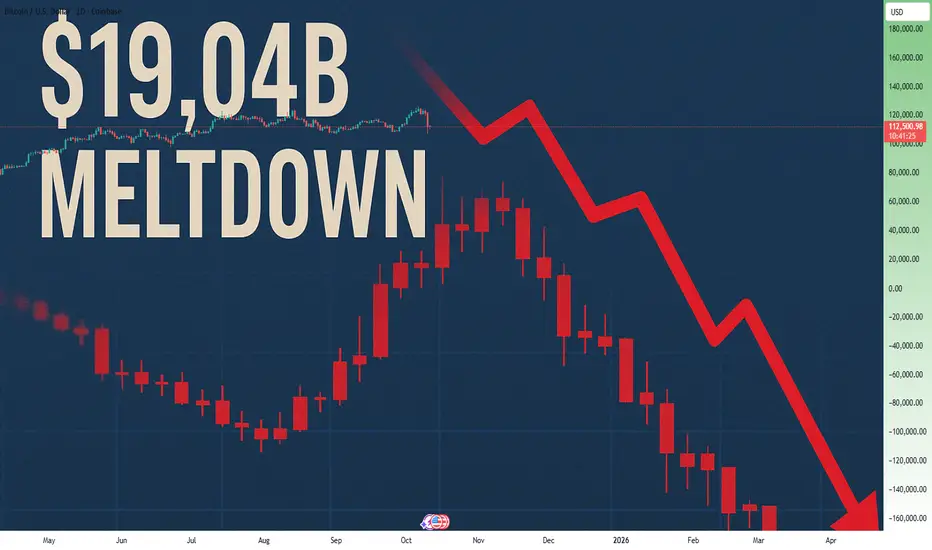
The Crypto Crash: A Brutal Reminder of What MattersLast night, the crypto market went through one of its ugliest moments in history — a true bloodbath.
What began as a reaction to Trump’s tariff announcement quickly turned into a historic liquidation cascade that wiped out over $19 billion in leveraged positions within few hours.
More than 1.6 million traders were liquidated. Bitcoin dropped over 10%, Ethereum and Solana fell even harder, and many small altcoins collapsed by 40–50%, some even more.
It wasn’t just volatility — it was destruction.
Was It Manipulation? Probably.
Everyone was long.
Everyone expected a rally.
Then, as often happens in overleveraged markets, someone pulled the plug. Prices were smashed down violently, liquidations fed liquidations, and what followed looked less like a correction and more like a coordinated sweep.
I’m not the one to shout “manipulation” at every dip — but let’s be honest: this one felt orchestrated.
Still, as they say, all’s fair in love and war . And markets are war . Which means you can’t complain — you have to adapt.
The Real Lesson: Survive First, Profit Later
If there’s one thing this crash reminds us of, how risky leverage is.
Used wisely, it amplifies returns.
Used recklessly, it destroys accounts — fast.
Most traders didn’t got liquidated because they were wrong about direction.
They got liquidated because they were overexposed.
When a 10% drop in Bitcoin wipes out your entire account, the problem isn’t the market — it’s your risk management.
How to Trade Like a Professional
1. Trade with controlled risk.
Never risk more than a small percentage per trade. If you don’t know your stop-loss level before you enter, you’re gambling, not trading.
2. Have a plan.
Every position must have an entry, a target, and an exit plan for when you’re wrong. A trader without a plan becomes prey when the market turns.
3. Avoid leverage on small altcoins.
Alts move fast, lack liquidity, and often get manipulated. Using leverage on them is financial suicide. Stick to spot.
4. Stay realistic.
The market doesn’t owe you a 10x move. Take profits, manage downside, and avoid getting caught in collective optimism.
5. Focus on survival.
Capital preservation is victory in itself. If you can stay in the game after a crash like this, you’ve already beaten 80% of the crowd.
Final Thoughts
Yes, my portfolio is down too. But I’m not panicking — because I wasn’t leveraged, and I had a plan.
Those who treat trading like war — disciplined, strategic, prepared — survive.
Those who treat it like a casino, don’t.
So let this $19B liquidation serve as a brutal reminder:
Don’t trade based on hope, hype, or herd behavior.
Trade with control, clarity, and courage.
Because in markets, like in war — survival always comes before victory.
Gold Ascending Triangle Breakout - Targets $3,800+This chart is not only for trading, it’s also for educational purposes and shows a long-term trade setup. You can see how the triangle pattern works here.
On the monthly time frame chart shows a clear bullish structure: a rising lower-trendline (series of higher lows), a flat horizontal resistance across the highs (an ascending-triangle shape) and a breakout candle that closes above that horizontal resistance. That is a bullish monthly breakout => the path of least resistance is upward while the breakout holds. (Market context: gold was hitting fresh lifetime highs around 22 Sep 2025 as Fed easing hopes and safe-haven flows supported the move.
Price structure & pattern (what the chart is telling you)
Pattern: the formation is an ascending triangle — horizontal (flat) highs vs. rising lows. This pattern is bullish because buyers progressively step in at higher prices against a persistent overhead supply line. The measured-move technique for triangles (height of the pattern added to the breakout) is a standard way to estimate a conservative target.
Trend: monthly trend is bullish — higher highs and higher lows inside a rising channel drawn above and below price. The breakout out of the triangle also cleared the upper channel midline, increasing odds of a run to the upper channel boundary.
Confirmation to watch: a monthly close back below the breakout level and the rising trendline would weaken the bullish case.
Practical Measured Target
Using the measured-move method gives a conservative first target:
Example estimate from the chart: take the triangle height ≈ (resistance ~3,450) − (swing low ~3,100) = 350. (3,450 − 3,100 = 350).
Add the height (350) to the breakout level (~3,450) → 3,450 + 350 = 3,800 as the first measured target; extension toward the top of the longer-term channel puts price into the ~3,900–4,000 neighborhood if momentum continues. (This is the standard target method — actual numbers depend on the exact points you measure on the chart).
Key levels
Immediate resistance / near-term targets: 3,700–3,900 (measured target and channel top).
Immediate support (first line): the breakout zone / prior flat resistance (now support) — roughly 3,350–3,450 on the chart.
Secondary support: rising lower-trendline / channel mid — roughly 3,100–3,250.
Strong structural support well below: 2,700–2,800 (major prior lows and horizontal red lines on the chart).
Use these as rules-of-thumb zones: if price reclaims and holds the breakout zone, bulls remain in control; if price closes monthly back below the rising trendline, the bullish pattern has failed.
Macro drivers & why the breakout matters now
Interest-rate expectations and real yields are the dominant macro drivers for gold: falling real yields (and expectations of Fed rate cuts) make gold more attractive, and the 2025 rally has been powered by that dynamic. Central-bank buying, geopolitical uncertainty and demand flows are additional tailwinds.
U.S. dollar: gold usually trades inverse to the DXY. Around the breakout date the dollar was not significantly stronger (DXY in the high-90s), which removes a major headwind for gold’s advance. If the dollar weakens further, that amplifies an upside path for gold; if the dollar rallies strongly, it increases the chance of a corrective pullback.
Scenarios (how to think about probabilities)
Bull case (highest probability while breakout holds): price follows measured-move to the ~3,800 region and then challenges the upper channel toward ~3,900–4,000 as momentum and lower real yields continue.
Base case (consolidation): a breakout retest — price dips back to the breakout zone (~3,350–3,450), finds buyers, then resumes uptrend (this is healthy and common).
Bear case (pattern failure): monthly close back under the rising trendline (and below ~3,100) — that would open a deeper correction toward 2,900–2,700 and reduce the bullish edge.
Trade plan and risk management (long-term investors vs traders)
Long-term investor (multi-year): if you believe in the macro thesis (lower real yields, central bank demand), holding through volatility is reasonable; consider layering in on pullbacks to the breakout zone (~3,350–3,450) with wider stops and position sizing for multi-year exposure.
Tactical trader (swing/position): the conservative trade is to wait for a breakout retest to the former resistance (buy on confirmed support hold). Entry zone: ~3,350–3,450 with a stop below the rising trendline (e.g., below ~3,100 in the chart) and targets at measured-move (~3,800) and then the channel top (~3,900–4,000). If you prefer momentum entries, a clean monthly close above the breakout with continued follow-through on the next monthly candle is a valid trigger, but tighten stops.
Always size positions so a failure (close below the rising trendline) does not blow you out — place stop levels outside normal monthly noise.
Extra checks (what to watch next)
Watch U.S. inflation prints, Fed commentary and the 10-year real yields — those will be the largest macro switches that could change the story.
Watch DXY moves: a durable dollar rally would increase the odds of a deeper retracement.
On the chart: volume/flow confirmation on the breakout (higher volume on breakout is healthier); monthly-MA alignment (longer MAs acting as support) — these help confirm sustainability.
One-line conclusion
Monthly chart shows a classically bullish ascending-triangle breakout with a conservative measured target near ~3,800 and upside extension possible toward ~3,900–4,000 if macro drivers (falling real yields, Fed easing expectations, weak dollar) remain supportive; a monthly close back below the rising trendline (~3,100 area on the chart) would invalidate the bullish scenario.
Note
Please risk management in trading is a Key so use your money accordingly. If you like the idea then please like and boost. Thank you and Good Luck!

EURGBP | POSSIBLE BEARISH INTENT Price never tagged me in on the buy but is reacting very well from the 3HR OB
so now we wait to confirm that change then we can look to join in sells
Watch your charts !!

“BTCUSD Road to 120K – But Watch the Trap Ahead!”“BTCUSD 🚀 Road to 120K – But Watch the Trap Ahead!”
Bitcoin has shown strong momentum after a liquidity sweep around 108,000, signaling that big players collected orders before pushing price higher. This is a common smart money concept (SMC) move where liquidity is grabbed before the next leg.
🔑 Key Points to Note:
Previous Support Flip: Market reclaimed the broken support, turning it into a base for continuation.
Upside Target: The next major resistance zone is 120,000 – 123,000, where sellers are likely to step in.
Market Behavior: Price often sweeps liquidity before testing strong resistance, so patience is key.
Potential Pullback: Once resistance is tapped, a correction may follow as profit-taking starts.
📌 Educational Takeaway: Always watch how price reacts at liquidity zones and key resistance points. These levels often decide whether the trend will continue or reverse.
📈 For now, short-term bias = bullish toward 120,000, but be cautious for a possible rejection at that zone.

“Layers of Liquidity: The Hidden Brushstrokes in XAUUSD”“Layers of Liquidity: The Hidden Brushstrokes in XAUUSD”
When I observe this chart, it feels much like studying a Renaissance painting—full of depth, contrast, and hidden meaning. Every candle tells a story, just like brushstrokes on a canvas.
The strong support zone at 3260–3300 acts like the foundation of the painting, the solid base on which the entire composition stands. Just as an artist relies on balance in structure, the market relies on this level for equilibrium.
The resistance zone near 3440–3460 resembles the sky in a painting—bright and tempting, yet out of reach for now. The fake breakout projected above this level can be compared to an illusion of light in art: it draws the eye upward, but the truth lies in the shadow beneath.
Every higher low crafted along the way mirrors the gradual layering technique used by master painters, building depth and strength in the image. It is not a random stroke—it’s deliberate, showing that buyers are stepping in consistently, giving the chart rhythm and structure.
The liquidity sweep resembles the hidden symbolism often placed in classical artworks. At first glance, it might look chaotic, but its purpose is intentional—to trap participants and prepare for the next phase of movement.
From an educational perspective, this chart demonstrates that markets, like art, are a mixture of illusion and reality. Breakouts may be false, supports may be tested, but the true skill lies in learning how to interpret these strokes. Just as art critics read the layers of paint, traders must read the layers of price action.

Leverage in Crypto: The Sexy Lie vs. The Boring TruthLet’s be honest: the vast majority of crypto traders don’t come with a trading background. Not in stocks, not in futures, and definitely not in leveraged Forex.
Most enter crypto because of hype, the dream of fast money, and stories of overnight millionaires.
That’s why leverage in crypto is so dangerous. It’s not just a tool — it’s a trap for the unprepared.
________________________________________
What leverage really means
To keep it simple: with 100× leverage, every 1% move in your favor doubles your account, but every 1% move against you wipes it out completely.
👉 No matter the asset — Forex, Gold, Bitcoin, or meme coins — at 100× leverage you only have 1% room to be wrong.
________________________________________
Yesterday’s market moves – a perfect example
Yesterday, markets exploded across all asset classes:
• EURUSD → +1%
• Gold (XAUUSD) → +1.5%
• Bitcoin (BTC) → +4%
• Ethereum (ETH) → +8%
• PEPE, other coins and meme coins → +10%+
Now imagine trading them with 100× leverage, catching the bottom and selling at the top:
• EURUSD → +100% (account doubled)
• Gold → +150%
• BTC → +400%
• ETH → +800%
• PEPE → +1000%
Sounds incredible, right?
But here’s the other side: with 100× leverage, a –1% move against you = instant liquidation.
________________________________________
Effective Leverage – The Hidden Concept
Effective leverage — you rarely see it explained. Why?
Because it’s not sexy, not marketable, and most of all… exchanges and brokers don’t want this to be very clear.
Nominal leverage (the 50×, 100×, 200× banners you see everywhere) sells dreams. Effective leverage, on the other hand, shows the brutal reality: how much exposure you actually control compared to your account size.
Formula:
Effective Leverage=Position Size/Account Equity
• Example 1 (Forex): $1,000 account, $5,000 EURUSD position = 5× effective leverage.
• Example 2 (Crypto): $100,000 account, BTC at $100k, controlling 5 BTC ($500,000 position) = 5× effective leverage.
👉 Nominal leverage is the ad. Effective leverage is the invoice.
And once you understand it, the marketing magic disappears.
________________________________________
A concrete example – Solana trade
Let’s take a real setup I shared recently on Solana:
• Entry: buy at $200
• Stop Loss: $185 → risk on the asset = -7.5%
Case 1 – 100× leverage
From 200 → 198 (–1%), you’re liquidated. You never reach your stop at 185.
Case 2 – 10× effective leverage
Every 1% move = 10% account swing. You could survive down to 180, but you’d be under constant stress.
Case 3 – 2× effective leverage (my choice)
Let’s say you control $2,000 worth of SOL, effectively $4,000 exposure.
• If Solana falls to 185 (–7.5%), that’s a –15% hit to your account. Painful, but survivable.
• If Solana rises to 250 (+25%), with 2× leverage you make +50% on allocated capital.
• Risk–reward ratio: ~1:3.3 — sustainable, worth taking.
________________________________________
The psychological factor
This is where leverage breaks most traders.
• With 100× leverage, every 0.2% fluctuation moves your account by 20% (≈ $400 on a $2,000 account). Every 1% move = liquidation. How do you stay calm? You don’t.
• With 2× effective leverage, a 1% fluctuation only moves your account 2% (≈ $40). Boring? Maybe. Survivable? Absolutely.
Now imagine: you enter SOL at 200 with 100× leverage.
• At 202, you’ve doubled your account.
• At 210, you’ve made 5×.
But will you hold? No. Because:
1. If you’re awake, the stress of watching wild swings (in money, not in price) forces you to close early.
2. If you do hold, it’s usually because you were asleep — or the move happened in a single violent candle.
Markets never move in a straight line. They go 200 → 202 → 201 → 203 → 201 → 205…
At 100× leverage, every retracement feels like life or death. At 2× leverage, it’s just noise.
________________________________________
Conclusion
Leverage isn’t evil. It’s just a tool. But in crypto, with insane volatility and inexperienced traders, it becomes a weapon of mass destruction.
• At 100×, you’re gambling on the next 1% very small move.
• At 10×, you’re constantly stressed and one bad move away from ruin.
• At 2×–5× effective leverage, you can actually follow your plan, respect your stop, and let your targets play out.
Trading isn’t about adrenaline. It’s about survival.
High leverage destroys accounts — and discipline. Small, controlled leverage gives you the one thing you need most in trading: time.
P.S.
Of course, the choice is yours — what leverage you decide to use, whether you take into consideration the concept of effective leverage, or how you handle the psychological impact of high leverage.
But at least now, you know. 🙂

"BTC Sweeps Liquidity – Eyeing 115K Reclaim?""BTC Sweeps Liquidity – Eyeing 115K Reclaim?"
🔍 Technical Analysis – BTC/USD
On the 1H chart, Bitcoin (BTC) is currently displaying a textbook smart money structure, with price action following key institutional footprints.
🔑 Key Observations:
Liquidity Grab at Weak Low
Price dipped below the local support (~112,500), sweeping sell-side liquidity and tapping into a possible reversal zone.
Rejection from Demand Zone (Support Area)
A strong reaction occurred right at the support level, suggesting buyer interest is still present.
Order Block & Fair Value Gap
A visible Fair Value Gap (FVG) sits above current price action, aligning with an Order Block near the 115,000 level — this is a key magnet for price to rebalance.
Target Zone
Immediate upside target is 115,000, where an order block lies. If price reaches that level, expect potential short-term resistance or reversal.
Break of Structure (BOS) Confirmations
Multiple BOS and CHoCHs indicate bearish-to-bullish attempts, but the current structure still needs confirmation above 113,500+ for bullish continuation.
🧠 Conclusion & Expectation:
BTC has swept liquidity to the downside and may now seek to fill the FVG and revisit the 115K order block. However, confirmation is required — watch for bullish engulfing candles, volume spikes, or a CHoCH above 113,500.
“Smart money doesn’t chase — it waits for liquidity, then repositions. BTC may be following the same script.”

Mechanical vs. Anticipation Trades: The Fine LineWhen traders talk about discipline, they often refer to following rules — sticking to a plan, being methodical, and avoiding emotional decisions. But there's a subtle and powerful difference between being rule-based and being blindly mechanical. And even more, there's a moment in every trader’s process where discipline demands adaptation.
Let’s look at a recent trade on Gold to understand this better.
On Thursday, I published an analysis on Gold stating that the recent breakdown of support had turned that zone into resistance. A short entry from that level made sense.
It was mechanical, clean, and aligned with what the chart was showing at the time.
And, at first, it worked. Price rose into the resistance area and dropped. Perfect reaction. Textbook setup. Confirmation. The kind of trade you want to see when following a rule-based system.
But then something changed.
Price came back. Quickly.(I'm talking about initial 3315-3293 drop and the quick recover)
So, the very next rally pushed straight back into the same resistance area, hmmm...too simple, is the market giving us a second chance to sell?
That was the first sign that the market might not respect the previous structure anymore.
It dipped again after, but the second drop was different: slower, weaker, choppier.
That told me one thing: the selling pressure was fading.
So I shifted. From mechanical execution to anticipatory mindset.
This is where many traders struggle — not because they don’t have a system, but because they don’t know when to let go of it. Or worse: they abandon it too quickly without cause.
In this case, the evidence was building. The failed follow-through. The loss of momentum. The compression in structure. All signs that a reversal was brewing.
Rather than continuing to blindly short, referring to a zone that no longer held the same weight, I started looking for the opposite: an upside breakout and momentum acceleration.
That transition wasn’t based on emotion. It was based on market behavior.
________________________________________
Mechanical vs. Anticipation: What’s the Real Difference?
A mechanical trade is rule-based:
• If X happens, and Y confirms, then enter.
• No need for interpretation, no second guessing.
• It can (in theory) be automated.
An anticipatory trade is different:
• It’s about reading intent in price action before confirmation.
• Higher risk usually, but higher reward if you’re right.
• Can’t be automated. It requires presence, experience, and context.
And the tricky part? Often, we lie to ourselves. We say we’re "mechanical" while actually guessing. Or we think we’re being smart and intuitive, when in fact, we’re being impulsive.
The key is awareness.
In my Gold ideas, the initial short was mechanical. But the invalidation came quickly — and I was alert enough to switch gears. That shift is not a betrayal of discipline. It’s an upgrade of it.
________________________________________
Final Thoughts:
Discipline is not doing the same thing no matter what. Discipline is doing what the market requires you to do, without emotional distortion.
And that, often, means walking the fine line between the setup you planned for, and the reality that just showed up.
Disclosure: I am part of TradeNation's Influencer program and receive a monthly fee for using their TradingView charts in my analyses and educational articles.

“BNBUSD Educational Breakdown – Support Rejection “BNBUSD Educational Breakdown – Support Rejection with $846 Target in Sight”
Market Structure Overview:
BNBUSD is exhibiting a bullish market structure after forming a textbook higher low at the major demand zone near $740–$750. This zone has been historically significant, offering strong rejections and triggering aggressive bullish rallies.
A new bullish wave appears to be forming after price respected the ascending trendline and reclaimed the supertrend level, now acting as dynamic support around $782.2.
⸻
🔧 Technical Confluences:
• Support Zone: Highlighted between $738–$750, serving as a demand base. Recent price rejection here confirms buyers’ dominance.
• Trendline Support: Price has respected an ascending trendline, signaling short-term trend continuation.
• Supertrend Confirmation: Trend flip has occurred—price is now trading above the Supertrend line, indicating a fresh bullish momentum phase.
• Break of Structure (BoS): Minor resistance around $784–$790 was breached, suggesting bullish continuation.
⸻
🎯 Target Projection:
Using recent swing highs and market symmetry, the next logical resistance lies at $846.9, aligning with the previous supply zone. This target also fits within the measured move from the support base to previous highs.
⸻
📈 Trade Plan (Educational Only):
• Long Bias Zone: Between $770–$780
• Invalidation Level: Below $738 (loss of support structure)
• Target: $846.9
• Risk-Reward: Roughly 1:2.5 – favorable for swing traders
⸻
📚 Educational Note:
This chart is an excellent example of:
• Structure trading (support/resistance)
• Trend confirmation using a dynamic indicator (Supertrend)
• Risk-managed entries with clearly defined stop-loss and take-profit zones.

Pending Orders Are Not Set in Stone – Context Still MattersIn a previous educational article, I explained why I almost never trade breakouts on Gold.
Too many fakeouts. Too many emotional traps.
Instead, I stick to what works:
• ✅ Buying dips
• ✅ Selling rallies
But even these entries — placed with pending orders — are not automatic.
Because in real trading, price is not just a number — it’s a narrative.
And if the story changes, so should the trade.
________________________________________
🎯 The Setup – Buy the Dip Around 3400
Let’s take a real example from yesterday.
In my analysis, I mentioned I would look to buy dips near 3400, a former resistance now acting as support.
Price dropped to 3405, just a few points above my pending buy at 3402.
We saw a clean initial bounce — confirming that short-term support was real.
But I missed the entry by 30 pips.
So far, so good.
But here’s the important part — what happened next changed everything.
________________________________________
🧠 The Rejection Shifted the Entire Story
The bounce from 3405 was immediately sold into at 3420, a newly formed short-term resistance (clearly visible on the 15-minute posted chart).
After that, price started falling again — heading back toward my pending order.
📌 At that point, I cancelled the order. Why?
Because the context had changed:
• Bulls had tried once — and failed at 3420
• Sellers were clearly active and waiting above
• A second drop into my level wouldn’t be a clean dip — it would be retest under pressure.
The market was no longer giving me a “buy the dip” setup.
It was showing me a failed recovery. That’s a very different trade.
________________________________________
💡 What If It Had Triggered?
Let’s imagine that price had hit 3402 first, triggering my order.
Then rebounded, failed at 3420, and started dropping again.
Even then, I wouldn’t hold blindly.
Once I saw the rejection at 3420, I would have understood:
The structure had shifted.
The bullish case is weakening.
Exit early — breakeven or small controlled loss.
________________________________________
🔁 Sequence > Level
This is the most important principle:
• ✅ First down, then up = healthy dip → shows buyers are still in control
• ❌ First up, then down = failed breakout → shows selling pressure is stronger
Two scenarios. Same price. Opposite meaning.
That’s why you should look for:
Not just where price goes — but how it gets there.
________________________________________
🔒 Pending Orders Are Conditional
Many traders treat pending orders like traps:
“Just let price come to my level, and I’m in.”, but you should refine a little
✅ Pending orders should be based on a conditional expectation
❌ Not a fixed belief that the zone must hold
If the market tells a different story, remove the order.
No ego. No drama. Just process.
________________________________________
📌 Final Thought
Trading isn’t just about catching a price.
It’s about understanding price behavior.
First down, then up = strength.
First up, then down = weakness.
Let the market show its hand — then decide if you want to play.
Disclosure: I am part of TradeNation's Influencer program and receive a monthly fee for using their TradingView charts in my analyses and educational articles.
Serios Traders Trade Scenarios, Not Certaintes...If you only post on TradingView, you're lucky — moderation keeps discussions professional.
But on other platforms, especially when you say the crypto market will fall, hate often knows no limits.
Why?
Because most people still confuse trading with cheering for their favorite coins.
The truth is simple:
👉 Serious traders don't operate based on certainties. They work with living, flexible scenarios.
In today's educational post, I'll show you exactly how that mindset works — using a real trade I opened on Solana (SOL).
________________________________________
The Trading Setup:
Here’s the basic setup I’m working with:
• First sell: Solana @ 150
SL (stop-loss): 175
TP (take-profit): 100
• Second sell: Solana @ 160
SL: 175
TP: 100
I won’t detail here why I believe the crypto market hasn’t reversed yet — that was already explained in a previous analysis.
Today, the focus is how I prepare my mind for different outcomes, not sticking to a fixed idea.
________________________________________
The Main Scenarios:
Scenario 1 – The Pessimistic One
The first thing I assume when opening any position is that it could fail.
In the worst case: Solana fills the second sell at 160 and goes straight to my stop-loss at 175.
✅ This is planned for. No drama, no surprise. ( Explained in detail in yesterday's educational post )
________________________________________
Scenario 2 – Pessimistic but Manageable
Solana fills the second sell at 160, then fluctuates between my entries and around 165.
If I judge that it’s accumulation, not distribution, I will close the trade early, taking a small loss or at breakeven.
________________________________________
Scenario 3 – Mini-Optimistic
Solana doesn’t even trigger the second sell.
It starts to drop, but stalls around 120-125, an important support zone as we all saw lately.
✅ In this case, I secure the profit without waiting stubbornly for the 100 target.
Important tactical adjustment:
If Solana drops below 145 (a support level I monitor), I plan to remove the second sell and adjust the stop-loss on the initial position.
________________________________________
Scenario 4 – Moderately Optimistic
Solana doesn’t fill the second order and drops cleanly to the 100 target.
✅ Full win, perfect scenario for the first trade
________________________________________
Scenario 5 – Optimistic but Flexible
Solana fills the second sell at 160, then drops but gets stuck at 120-125(support that we spoken about) instead of reaching 100.
✅ Again, the plan is to close manually at support, taking solid profit instead of being greedy.
________________________________________
Scenario 6 – The Best Scenario
Solana fills both sell orders and cleanly hits the 100 target.
✅ Maximum reward.
________________________________________
Why This Matters:
Scenarios Keep You Rational. Certainties Make You Fragile.
In trading, it's never about being "right" or "wrong."
It's about having a clear plan for multiple outcomes.
By thinking in terms of scenarios:
• You're not emotionally attached to a single result.
• You're prepared for losses and quick to secure wins.
• You're flexible enough to adapt when new information appears.
Meanwhile, traders who operate on certainties?
They get blindsided, frustrated, and emotional every time the market doesn’t do exactly what they expected.
👉 Trading scenarios = trading professionally.
👉 Trading certainties = gambling with emotions.
Plan your scenarios, manage your risk, and stay calm. That's the trader's way. 🚀

Possible vs. Probable in Trading — Most Traders Ignore ThisOne of the biggest mistakes traders make — especially beginners — is confusing what is possible with what is probable.
This confusion leads to poor decisions, unnecessary risks, and eventually, losses that could have been easily avoided.
Possible and Probable Are NOT the Same Thing
Let's make this very clear:
• Possible means it can happen.
• Probable means it is likely to happen, based on evidence and context.
In life, many things are possible — but that doesn’t mean we should live our lives preparing for each possible (and often extreme) event.
To give you a real-life example: it’s possible that something falls from the roof top of a builing and hits you while shopping and die. Sadly, this actually happened in Romania about a month ago.
But as rare and tragic as it is, it’s not probable. And it definitely doesn’t mean that we should stop going outside, right?
Trading Is a Game of Probabilities, Not Possibilities
When trading, we are not betting on what is possible.
If we did, we would enter trades every time we imagine a price could go higher or lower — and that would be a disaster.
Instead, we are betting on what is probable — based on:
• Technical analysis
• Price action
• Market context
• Volume
• Sentiment
⚠️ Yes, it is always possible for price to go in either direction.
But our edge comes from identifying what is more likely to happen based on the data we have.
Why This Difference Is Crucial for Your Trading Success
✅ Focusing on probabilities means:
• You enter only high-probability setups.
• You manage risk properly because you accept that nothing is 100% sure.
• You avoid chasing trades just because "it’s possible" something happens.
❌ Focusing on possibilities leads to:
• Overtrading
• Emotional decisions
• Hoping instead of following a plan
• Blowing up accounts
Conclusion: Trade Like a Professional — Trade Probabilities
Remember:
"Anything is possible, but not everything is probable."
If you want to survive and thrive in the markets, focus on probabilities — not on fantasies of what could happen.
You are not trading "maybe this happens", you are trading "this is likely to happen, and I’m managing my risk if it doesn’t".
Make this shift in mindset, and you’ll already be ahead of most traders out there.

The Right Questions to Ask Before Entering a TradeEvery day, traders—especially beginners—ask the same recurring question:
❓ What do you think Gold will do today? Will it go up or down?
While this seems like a logical question, it’s actually completely wrong and one that no professional trader would ever ask in this way.
Trading is not about predicting the market like a fortune teller. Instead, it's about analyzing price action, managing risk, and executing trades strategically.
So, instead of asking, "Will Gold go up or down?" , a professional trader asks three critical questions before taking any trade.
Let's break them down.
________________________________________
Step 1: Identifying the Right Entry Point
Let’s say you’ve done your analysis, and you believe Gold will drop. That’s great—but that’s just an opinion. What really matters is execution.
🔹 Where do I enter the trade?
Professional traders don’t jump into the market impulsively. They use pending orders instead of market orders to wait for the right price.
If you believe Gold will fall, you shouldn’t just sell at any price. You need to identify a key resistance level where a reversal is likely to happen.
For example:
• If Gold is trading at $2900, and strong resistance is at $2920, a professional trader will set a sell limit order at that resistance level rather than shorting randomly.
This approach ensures that you enter at a strategic point where the probability of success is higher.
________________________________________
Step 2: Setting the Stop Loss
🔹 Where do I place my stop loss?
A trade without a stop loss is just gambling. Managing risk is far more important than being right about market direction.
The key is to determine:
✅ How much risk am I willing to take?
✅ Where is the invalidation level for my trade idea?
For example:
• If you are shorting Gold at $2920, you might place your stop loss at $2935—above a recent high or key technical level.
• This way, if the price moves against you, you have a predefined maximum loss, avoiding emotional decision-making.
Professional traders never risk more than a small percentage of their account on a single trade. Risk management is everything.
________________________________________
Step 3: Setting the Take Profit Target
🔹 Where do I set my take profit, and does the trade make sense in terms of risk/reward?
Before taking any trade, you must ensure that your reward outweighs your risk.
For example:
• If you risk $15 per ounce (short at $2920, stop loss at $2935), your take profit should be at least $30 away (for a 1:2 risk/reward).
• A good target in this case could be $2890 or lower.
This means that for every dollar you risk, you aim to make two dollars—ensuring long-term profitability even if only 40-50% of your trades succeed.
If the trade doesn’t offer a good risk/reward, it’s simply not worth taking.
________________________________________
Conclusion: The “Set and Forget” Mentality
Once you’ve answered these three key questions and placed your trade, the best approach is to let the market do its thing.
✅ Set your entry, stop loss, and take profit.
✅ Follow your trading plan.
✅ Avoid emotional reactions.
Many traders lose money because they constantly interfere with their trades—moving stop losses, closing positions too early, or hesitating to take profits.
Instead, adopt a professional approach: set your trade and let it run.
📌 Final Thought:
The next time you find yourself asking, “Will Gold go up or down today?” , stop and ask yourself:
📊 Where is my entry?
📉 Where is my stop loss?
💰 Where is my take profit, and does the risk/reward make sense?
This is how professional traders think, plan, and execute—and it’s what separates them from amateurs.
👉 What’s your biggest struggle when it comes to executing trades? Let’s discuss in the comments! 🚀
Disclosure: I am part of Trade Nation's Influencer program and receive a monthly fee for using their TradingView charts in my analyses and educational articles.
