LLY | This Healthcare Co. Is a Great Pick | LONGEli Lilly & Co. engages in the discovery, development, manufacture, and sale of pharmaceutical products. The firm's products consist of diabetes, oncology, immunology, neuroscience, and other products and therapies. The company was founded by Eli Lilly in May 1876 and is headquartered in Indianapolis, IN.
Elililly

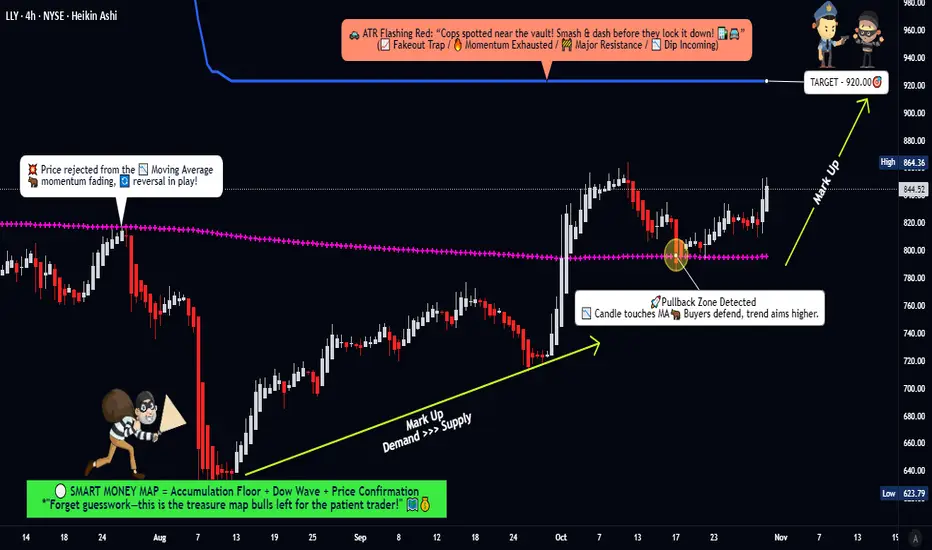
LLY Market Blueprint – From Pullback Base to Profit Zone🎯 LLY Stock Market Heist Plan 🏦💰 | Swing Trade Setup
📊 Asset Overview
Eli Lilly and Company (LLY) - NYSE
Pharmaceutical Giant | Market Cap Leader
🔍 The Setup: What We're Seeing
The chart is screaming opportunity! 🚨 LLY is showing classic bullish pullback behavior with strong accumulation zone activity. We've got:
✅ Accumulation Zone Pressure - Big money is quietly loading up
✅ Weighted Moving Average Breakout & Retest - Technical confirmation ✓
✅ Bullish Momentum Building - The spring is coiling for the next leg up
🎯 The Thief's Game Plan
Entry Strategy: The Layered Approach 🪜
You've got two options here, fellow thieves:
Option 1: Simple Entry
→ Any current price level works if you're confident in the setup
Option 2: The Thief's Layered Entry 🧠
This is where we get tactical. Use multiple limit orders to ladder into the position:
Layer 1: $780
Layer 2: $800
Layer 3: $820
Layer 4: $840
You can add more layers based on your capital and risk tolerance. This approach averages your entry and reduces timing risk.
🛑 Risk Management: The Escape Hatch
Stop Loss: $760
⚠️ Important Note: This is MY stop loss level based on my risk tolerance and analysis. You are the captain of your own ship! Set your SL based on YOUR risk appetite. Make money, take money - but do it at your own risk. 🎲
💰 Target: The Vault 🏦
Take Profit: $920
Here's the situation: The ATR line is sitting at $920 acting like a police barricade 🚔. This is a strong resistance zone where:
Overbought conditions likely
Potential trap zone for late entries
Natural profit-taking area
🎯 My Advice: When you reach the vault, grab the cash and RUN! Don't get greedy.
⚠️ Another Important Note: This is MY target. You make your own rules. Scale out, hold longer, take profits earlier - whatever fits YOUR trading plan. This is your heist, not mine! 💼
📈 Related Pairs to Watch
Keep these on your radar for correlation and broader market context:
Healthcare/Pharma Sector:
NYSE:JNJ (Johnson & Johnson) - Healthcare bellwether, moves often correlate
NYSE:UNH (UnitedHealth Group) - Health sector leader, shows sector strength
NYSE:PFE (Pfizer) - Direct pharma competitor, industry sentiment gauge
NYSE:ABBV (AbbVie) - Biopharmaceutical peer, similar market dynamics
Market Context:
AMEX:SPY (S&P 500 ETF) - Overall market direction matters
AMEX:XLV (Health Care Select Sector SPDR) - Sector health indicator
Key Correlation Points:
LLY often leads pharma sector during strong diabetes/obesity drug cycles
Watch NYSE:JNJ for defensive rotation signals
AMEX:SPY correlation increases during risk-on markets
AMEX:XLV breakouts often precede individual pharma stock runs
🎭 The Thief's Philosophy
This setup combines patience (layered entries), discipline (clear stop loss), and calculated risk-taking (defined target). We're not gambling - we're executing a well-planned heist with multiple contingencies.
The market is the vault. The chart is the blueprint. Your risk management is your getaway car. 🚗💨
Remember: The best thieves know when to strike AND when to walk away. Don't fall in love with a position. Take your profits and live to steal another day! 😎
✨ If you find value in my analysis, a 👍 and 🚀 boost is much appreciated — it helps me share more setups with the community!
#LLY #EliLilly #SwingTrading #StockMarket #TechnicalAnalysis #NYSE #PharmaStocks #BullishSetup #TradingStrategy #ThiefStyle #LayeredEntry #RiskManagement #PriceAction #MovingAverage #AccumulationZone #HealthcareStocks #TradingIdeas #StockTrading #ChartAnalysis #MarketHeist
Lilly (NYSE: $LLY) Jumps as FDA Expands Jaypirca UseEli Lilly and Company (NYSE: NYSE:LLY ) received a major regulatory boost after the U.S. Food and Drug Administration approved an expanded indication for its non-covalent BTK inhibitor, Jaypirca (pirtobrutinib). The drug is now approved for adults with relapsed or refractory chronic lymphocytic leukemia (CLL) or small lymphocytic lymphoma (SLL) who have previously been treated with a covalent BTK inhibitor, broadening its therapeutic reach and transitioning its earlier accelerated approval into full approval.
Jaypirca remains the first and only FDA-approved non-covalent BTK inhibitor, uniquely positioned for patients who no longer respond to ibrutinib, acalabrutinib, or zanubrutinib. The expanded indication is supported by the BRUIN CLL-321 trial, a Phase 3 head-to-head study showing Jaypirca’s superior clinical benefit compared to idelalisib plus rituximab or bendamustine plus rituximab in previously treated patients.
Lilly, now valued near $928 billion and trading just below its 52-week high of $1,111.99, continues to strengthen its biotech leadership with a rapidly expanding oncology pipeline. With a PEG ratio of only 0.42 and a 55-year dividend history, the company offers a rare blend of growth and income stability—attributes that have fueled consistently bullish analyst sentiment. Major firms including Guggenheim, BofA Securities, and BMO Capital have recently raised their price targets, citing strong performance across Lilly’s GLP-1 weight-loss and diabetes portfolio, as well as upcoming late-stage trial catalysts.
Technical Outlook
LLY remains in a strong long-term uptrend after printing an all-time high near $1,111. Price is currently retracing, with the $970 region emerging as a potential support zone aligned with prior structure and rising trend momentum. If this level holds, bulls may regain control and push the stock back toward the $1,080–$1,110 zone. A breakdown below $970 could trigger a deeper pullback, but overall sentiment remains firmly bullish.

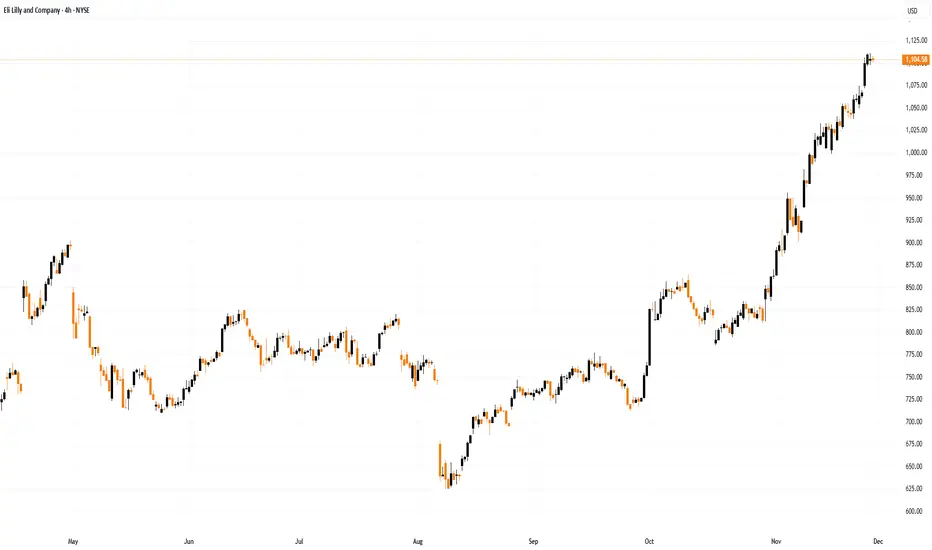
Eli Lilly (LLY) Shares Have Surged by Around 30% in NovemberEli Lilly (LLY) Shares Have Surged by Around 30% in November
The price action of Eli Lilly and Company (LLY), the world’s largest pharmaceutical firm, reflects exceptionally strong demand:
→ since the start of the month, LLY shares have risen by roughly 30%;
→ in late November, the company’s market capitalisation exceeded $1 trillion, making Eli Lilly the first pharmaceutical firm in history to reach this level.
Why are Eli Lilly (LLY) Shares Rising?
A key driver has been the strong earnings report published on 30 October.
→ Earnings per share came in far above expectations ($7.02 versus $5.69).
→ Sales of diabetes treatment Mounjaro and obesity drug Zepbound surpassed $10 billion for the quarter.
→ On the back of this success, management raised its revenue outlook, and market participants now expect an even stronger fourth quarter.
At the same time, the chart is signalling that the extraordinary rally may be running out of steam.
Technical Analysis of Eli Lilly (LLY) Shares
For more than a year, LLY’s price action followed a downward channel. If this channel is extended upward twofold after the bullish breakout (which occurred following the earnings release), we can see that the price has reached the upper boundary of the expanded channel — a level often viewed as a potential target for buyers.
Note that after breaking above the psychological $1,000 level, the rally initially slowed (1), but then accelerated sharply this week (2) — a possible sign of FOMO and the climax of the November uptrend.
Additionally → the RSI indicator is deep in overbought territory and is pointing lower.
Given these factors, it is reasonable to assume that LLY shares are vulnerable to a pullback, which could intensify if investors begin taking profits on long positions.
This article represents the opinion of the Companies operating under the FXOpen brand only. It is not to be construed as an offer, solicitation, or recommendation with respect to products and services provided by the Companies operating under the FXOpen brand, nor is it to be considered financial advice.
Eli Lilly: The Trillion-Dollar Cure for Market Volatility?Eli Lilly has officially shattered the Silicon Valley ceiling, becoming the first healthcare company to achieve a $1 trillion market capitalization. While tech giants like Nvidia grapple with bubble concerns and doubts about AI monetization, Lilly has delivered tangible, recurring revenue through its dominance of GLP-1. This milestone is not merely a pharmaceutical victory; it represents a fundamental shift in market leadership from speculative tech to essential biopharma.
Macroeconomics: The Flight to Quality
The Federal Reserve’s pivot is fueling this ascent. New York Fed President John Williams signaled imminent rate cuts, raising December cut expectations to 70%. Lower rates disproportionately benefit capital-intensive sectors like pharma, which require massive upfront R&D and manufacturing spend. Investors, wary of tech volatility, are treating Lilly as a "defensive growth" asset—a rare hybrid offering the stability of healthcare with the explosive growth of software.
Science & Innovation: The Dual-Agonist Revolution
Lilly’s valuation rests on **tirzepatide** (branded as Mounjaro and Zepbound). Unlike previous drugs that target a single hormone, tirzepatide mimics both GIP and GLP-1, delivering superior efficacy in weight loss and blood sugar control. This scientific leap has rendered competitors’ single-agonist drugs vulnerable. Furthermore, Lilly is already stress-testing its own dominance with **retatrutide**, a triple-agonist candidate showing even higher potency, effectively cannibalizing its own portfolio before rivals can catch up.
Business Models: Disrupting the Middlemen
Lilly is aggressively rewriting the pharmaceutical distribution playbook. The launch of **LillyDirect** bypasses traditional Pharmacy Benefit Managers (PBMs). By partnering directly with Walmart to offer cash-pay options for Zepbound vials, Lilly captures margin previously lost to intermediaries. This Direct-to-Consumer (DTC) model exerts immense pressure on insurers to cover these drugs, leveraging patient demand as a battering ram against restrictive formularies.
Geostrategy: Manufacturing Sovereignty
Management recognizes that demand is useless without supply. Lilly has committed over $27 billion to manufacturing expansion, predominantly in the US and Europe (Ireland and Germany). This strategy reduces reliance on fragile Asian supply chains, insulating the company from US-China geopolitical friction. By onshoring active pharmaceutical ingredient (API) production, Lilly positions itself as a national security asset, aligning corporate growth with Western industrial policy.
Technology & Cyber: AI-Driven Discovery
Lilly is moving beyond traditional wet labs. The company’s **TuneLab initiative** utilizes federated AI learning. This allows biotech partners to train models on Lilly’s proprietary data without exposing the underlying IP. Additionally, partnerships with Isomorphic Labs aim to accelerate small molecule discovery. This "tech-forward" approach reduces the years-long timeline of drug discovery, turning R&D into a computational problem rather than a biological guessing game.
Management & Leadership: The Ricks Doctrine
CEO David Ricks has executed a masterclass in capital allocation. While peers engaged in share buybacks, Ricks poured capital into manufacturing capacity ahead of approval. His leadership style is characterized by "preemptive scale"—building the factory before the drug is approved. This risk appetite allowed Lilly to meet the explosive demand for Zepbound faster than competitors, securing market share through sheer logistical brute force.
Patent Analysis: Building the Moat
Lilly is fiercely defending its IP territory. The company has launched legal offensives against compounding pharmacies attempting to sell unauthorized versions of tirzepatide. Simultaneously, they are layering patents on delivery mechanisms and combination therapies. The transition from auto-injectors to vials also serves a strategic patent function, complicating the regulatory pathway for future biosimilars.
Conclusion
Eli Lilly has successfully decoupled itself from the broader healthcare index. By combining Silicon Valley-style innovation with industrial-scale manufacturing, it has created a $1 trillion moat. As the Fed eases policy, Lilly stands ready to deploy cheap capital to further widen the gap against its rivals.

Eli Lilly Hits $1 Trillion Milestone on GLP-1 BoomEli Lilly & Co. (NYSE: NYSE:LLY ) briefly crossed the $1 trillion market-cap threshold, becoming the first health-care company in history to reach the valuation. Shares traded around $1,059 as demand for its GLP-1 weight-loss and diabetes drugs exploded, driving extraordinary revenue growth and solidifying its global leadership.
Historic Breakthrough for Health-Care
Eli Lilly’s rise into the trillion-dollar tier places it beside mega-caps typically dominated by technology firms. Its 36% year-to-date surge has been powered by transformative changes in global health trends, particularly the widespread adoption of GLP-1 therapies. Investors see Lilly as the clear frontrunner in a market undergoing rapid medical, cultural, and financial shifts.
Mounjaro and Zepbound Drive Massive Revenue
Third-quarter earnings highlighted unprecedented growth:
Mounjaro: $6.52B revenue (+109% YoY)
Zepbound: $3.59B revenue (+184% YoY)
These drugs are expanding faster than nearly any product in pharmaceutical history. Analysts expect continued momentum as insurance adoption widens, regulatory approvals expand, and Lilly prepares to launch oral GLP-1 versions—an innovation that could reshape accessibility.
Legacy of Innovation
Founded in 1876, Eli Lilly has delivered breakthroughs for a century—from insulin to Prozac to early polio vaccines. But its modern dominance began in 2022 when tirzepatide (Mounjaro) gained approval, offering dual-hormone therapy that reshaped diabetes and weight-loss treatment. Zepbound extended that dominance into obesity care, capturing global demand at scale.
Rivals such as Novo Nordisk and Pfizer are accelerating efforts, with the obesity-drug market expected to exceed $150 billion by the 2030s. Still, Lilly maintains the strongest growth trajectory.
Technical Outlook
LLY trades at all-time highs after breaking above the $969 resistance zone. Price action remains firmly bullish, targeting psychological levels at $1,100 and $1,200. Any retracement should find support at $969, keeping the broader uptrend intact.

"LLY's Bear Market Mode ON | Crash Incoming"“ LLY is gearing up for a sharp correction down to the $35–$17 zone — a critical reset that could flush out weak hands before the next explosive bull run. Stay sharp, this is where big opportunities form. ⚠️
🔥 Summary:
Eli Lilly (LLY) looks ready for a major market reset after completing a historic five-wave climb. This could be the start of a long-term corrective Wave 2 , potentially wiping out years of gains before the next explosive super-cycle takes off. The bull run isn’t over — but it’s taking a serious pause. ⚠️📉
🌊 Wave Theory Outlook
LLY’s multi-decade Elliott structure shows a completed Cycle Wave 1 peaking near the 2.618 extension zone around $1029. Historically, such extensions often mark exhaustion.
Next comes Wave 2 , which could retrace deep into the $35–$17 zone (the 0.618–0.786 Fibonacci region and prior structural base). Expect a complex W-X-Y pattern , shaking weak hands before a powerful Wave 3 bull expansion later this decade.
📉 Price Action & Smart Money Context
The chart shows exhaustion wicks, momentum divergence, and slowing volume — classic signs of distribution .
Smart money is likely off-loading near the highs , preparing to reload at discount levels once liquidity below 2020–2022 lows is taken.
Expect liquidity sweeps, imbalance fills, and a long-term accumulation base forming near the orange demand zone before the next breakout.
💰 Fundamental Alignment
Despite incredible fundamentals — obesity and diabetes drug leadership, global demand growth, and innovation — valuation gravity always returns .
A deep correction would align price with sustainable earnings and provide institutional re-entry opportunities at fair value.
🧠 Traders ,
"the charts are whispering — a major LLY correction is loading.
Our projections highlight the $35–$17 zone as the key accumulation region before the next super-cycle.
Stay alert, plan your levels, and don’t fight the wave. 🌊📉
Where do you think LLY bottoms out? Share your thoughts below 👇”
— Team FIBCOS
#LLY #EliLilly #BearMarket #Correction #WaveTheory #SmartMoney #ElliottWave #Fibcos #TechnicalAnalysis #PriceAction #Investing #PharmaStocks #StockMarket #MarketCycle #ChartAnalysis #Bearish #Wave2 #TradingView #StockAlert #MarketReset

Eli Lilly’s $1T Breakout at 1060 | End of the Supercycle?Eli Lilly (LLY) – Macro Elliott Wave, Fibonacci & Historic $1 Trillion Milestone
LLY has now reached a critical long-term inflection point, advancing directly into the 2.618 Fibonacci extension , completing the projection of a full five-wave Elliott Wave cycle. This precise alignment establishes the 1060 region as a high-confidence macro top zone.
At today’s high of 1060 , LLY also achieved a historic milestone - crossing the $1 Trillion market-cap threshold , becoming the first medical company in history to reach this valuation. This achievement underscores the extraordinary scale of the preceding multi-year impulse and reinforces the significance of the current structural level.
With price holding at these unprecedented highs, the market is operating deep within a premium zone , where long-cycle reversals typically begin. While the bullish structure remains intact for now, the confluence of Fibonacci exhaustion, wave completion, and valuation extremity creates a strong, affirmative expectation that LLY is entering its macro topping phase.
The broader corrective roadmap follows a classical A–B–C structure , with downside levels anchored to key long-term Fibonacci retracements:
• The 0.236 retracement at ~245 forms the primary target for the anticipated Wave A leg, aligning with prior institutional accumulation and structural demand.
• The 0.382 retracement at ~98 represents the major macro demand zone and the high-probability destination for full cycle re-pricing via Wave C.
Taken together - the completed Elliott Wave structure, extreme Fibonacci extension, and the unprecedented $1T milestone - LLY stands at one of the most significant macro levels in its history. The next major move is expected to guide the market from its expansionary phase into a multi-year structural correction, with clearly defined downside objectives.
What do YOU think happens next?
Breakout or fake-out? Drop your prediction below!
👇 We are replying to every comment - let’s talk charts .
Smash the 👍 if this helped, hit 🔔 to catch the next setup,
and FOLLOW for more high-probability wave + SMC plays.
⚠️ Disclaimer
This content is for educational and informational purposes only and does not constitute financial, investment, or trading advice. All analyses reflect personal opinions based on publicly available data and chart structures. Markets involve risk, and you should always perform your own research or consult a licensed financial professional before making any trading decisions. Past performance does not guarantee future results.

Eli Lilly and Company: Path to Sustained Market LeadershipEli Lilly and Company has achieved a market valuation approaching one trillion U.S. dollars by the close of 2025, underpinned by a comprehensive corporate strategy that integrates advanced scientific research, targeted technology acquisitions, and adaptive global partnerships. This performance, marked by a substantial year-over-year share appreciation, positions the firm as a preeminent participant in the international pharmaceutical sector and underscores structural advantages in innovation-driven capital markets.
Core Therapeutic Franchises and Pipeline Expansion
The company's cardiometabolic portfolio, centered on dual GIP/GLP-1 receptor agonists, continues to serve as the principal engine of revenue growth. Products indicated for type 2 diabetes and chronic weight management recorded quarterly sales exceeding ten billion dollars in 2025, reflecting robust demand in large-scale metabolic disease populations. Ongoing clinical investigation into the neurobiological effects of these molecules has yielded preliminary evidence of modulation within central reward pathways, suggesting potential future applications in neuropsychiatric conditions characterized by dysregulated appetite control. Such findings reinforce the intellectual property protections surrounding the franchise and broaden its therapeutic scope.
In parallel, Eli Lilly is advancing capabilities in central nervous system disorders through specialized drug-delivery technologies. A recent multibillion-dollar licensing agreement with a South Korean biotechnology enterprise grants exclusive access to an engineered bispecific antibody platform designed to enhance macromolecular transport across the blood-brain barrier. This acquisition complements prior collaborations in the same domain and materially strengthens the company's competitive positioning in Alzheimer’s disease, Parkinson’s disease, and related neurodegenerative indications.
Global Research Collaborations and Supply-Chain Resilience
Strategic alliances with leading Asian biotechnology organizations form a key component of Eli Lilly’s innovation sourcing model. These partnerships provide access to proprietary platform technologies, expand the firm's intellectual property base beyond North American origination, and foster diversified scientific talent networks. By establishing collaborative development nodes within geopolitically aligned jurisdictions, the company enhances resilience in high-value biopharmaceutical supply chains while accelerating the maturation of next-generation therapeutic modalities.
Capital Market Dynamics and Transatlantic Divergence
Eli Lilly operates within a U.S. financial ecosystem that currently represents approximately three-quarters of global developed-market equity indices, an environment particularly conducive to large-capitalization growth enterprises. This structural weighting, combined with concentrated domestic healthcare spending and investor preference for scalable innovation platforms, has facilitated accelerated valuation expansion. In contrast, European peers contend with more fragmented national markets and differing risk appetite conventions among institutional investors, resulting in divergent capital allocation outcomes across the Atlantic.
Executive Leadership and Technology Adoption
Under the direction of Chief Executive Officer David Ricks, Eli Lilly has institutionalized the integration of advanced computational tools throughout the research and decision-making processes. Specialized large-language models and frontier artificial intelligence systems are routinely employed to augment hypothesis generation and data interpretation, supported by investments in high-throughput robotic experimentation infrastructure. This disciplined yet exploratory approach to emerging technologies reflects a broader organizational commitment to maintaining leadership in computationally assisted drug discovery.
Evolution Toward Platform-Centric Development
The company has transitioned from asset-specific transactions to the systematic acquisition of foundational technology platforms capable of yielding multiple product candidates. Recent investments in blood-brain barrier transport modalities and downstream applications in oncology illustrate this paradigm. By prioritizing versatile, proprietary enabling technologies, Eli Lilly establishes durable competitive barriers and aligns its research and development expenditure with long-term industry trends favoring multi-indication pipelines.
Intellectual Property Strategy and Risk Mitigation
Comprehensive patent estates surrounding the incretin mimetic class, coupled with proactive manufacturing capacity expansion, preserve pricing autonomy and market exclusivity in high-volume cardiometabolic indications. Concurrent investment in novel mechanisms—of which blood-brain barrier penetration is a prime example—serves to replenish the development pipeline and offset eventual patent expirations on current revenue-generating products. This forward-looking intellectual property management underpins investor confidence in the sustainability of the company’s growth trajectory.
In summary, Eli Lilly’s ascent to near-trillion-dollar valuation reflects the successful execution of an integrated strategy encompassing scientific excellence, strategic technology acquisition, international collaboration, and rigorous capital allocation—positioning the enterprise for continued leadership in global biopharmaceutical innovation.

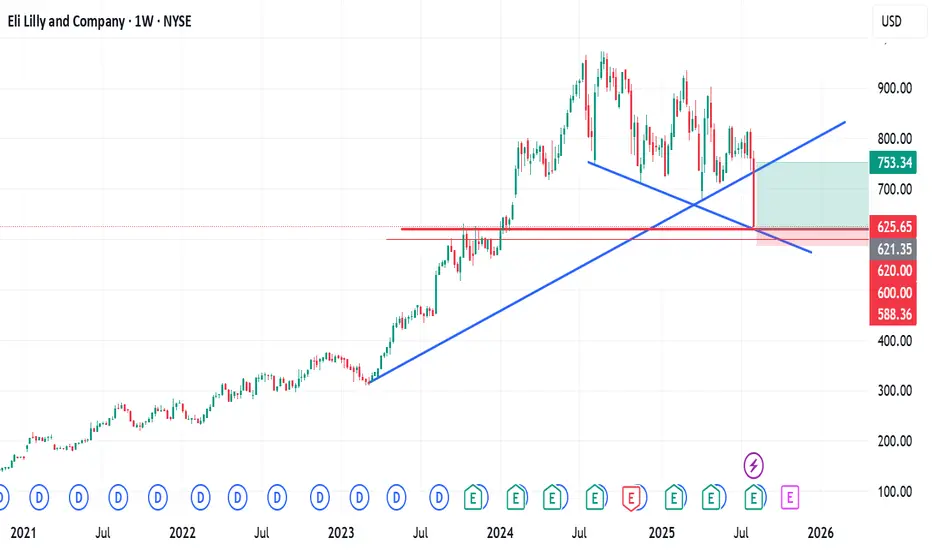
ELI LILLY to soon start a correction towards $700.Eli Lilly (LLY) has made new All Time Highs (ATH) this month, extending the impressive rally since the August Low near the 1W MA200 (orange trend-line).
The multi-year trend remains bullish within a Fibonacci Channel Up but practically the stock hasn't gotten out of its range since the July 2024 High, breaking in August below even its 1W MA100 (green trend-line).
This prolonged sideways trading resembles the July 2015 - July 2018 3-year consolidation phase, which broke upwards only after a 2nd test of the 1W MA200. Even the 1M RSI patterns between the two sequences are similar. Based on this (1M RSI), which is about to break above its MA for the first time since July 2024, we are in similar levels as February 2017.
As a result, we expect LLY to start a rather smooth correction towards its 1W MA200 again, targeting $700, where the next long-term buy opportunity may potentially emerge.
---
** Please LIKE 👍, FOLLOW ✅, SHARE 🙌 and COMMENT ✍ if you enjoy this idea! Also share your ideas and charts in the comments section below! This is best way to keep it relevant, support us, keep the content here free and allow the idea to reach as many people as possible. **
---
💸💸💸💸💸💸
👇 👇 👇 👇 👇 👇

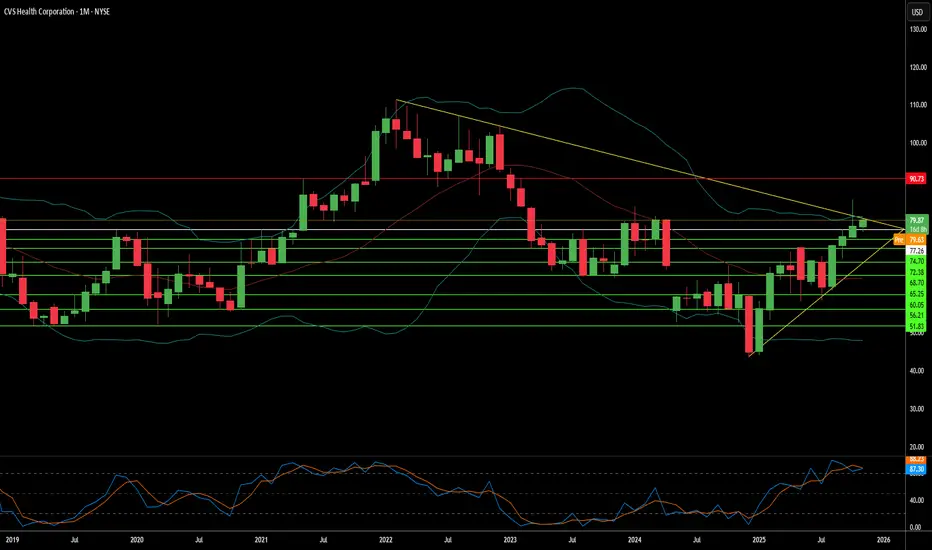
Can Integration Save CVS or Sink It?CVS Health confronts a dangerous convergence of risks that threatens its vertically integrated business model. The company's Pharmacy Benefit Manager (PBM) subsidiary, Caremark, faces intensifying regulatory scrutiny as lawmakers target the opaque rebate structures and spread pricing mechanisms that underpin PBM profitability. Simultaneously, the explosive growth of high-cost GLP-1 weight-loss drugs has created unprecedented formulary pressure. CVS's decision to exclude Eli Lilly's Zepbound in favor of Novo Nordisk's Wegovy, based purely on price, backfired spectacularly. Lilly publicly pulled its employees from CVS's PBM plan and shifted to competitor Rightway Healthcare, signaling deep market skepticism about CVS's ability to balance cost control with clinical outcomes. This defection validates concerns that major employers are increasingly willing to abandon the "Big Three" PBMs for transparent alternatives.
The company's acquisition strategy has proven economically disastrous, with CVS recording a staggering $5.7 billion goodwill impairment charge on Oak Street Health in Q3 2025, effectively admitting the primary care assets were dramatically overvalued. This massive write-down undermines the core thesis that vertical integration of insurance (Aetna), PBM (Caremark), and care delivery creates synergistic value. Meanwhile, operational margins erode from multiple directions: $833 million in litigation charges from past business practices, declining generic dispensing rates as expensive branded GLP-1 drugs displace generics, and the structural reality that robust patent protection on GLP-1 drugs extending into the 2040s eliminates the PBM's traditional leverage of threatening generic competition.
CVS faces additional systemic vulnerabilities across geopolitical, technological, and scientific domains. The company's reliance on Active Pharmaceutical Ingredients sourced from China and India exposes it to supply chain disruptions, tariffs, and mandatory but expensive domestic manufacturing mandates. Its vast integrated infrastructure creates an attractive single point of failure for cyberattacks, heightened by the $20 billion technology investment to further interconnect all segments. Most critically, pharmaceutical manufacturers hold unprecedented leverage due to the extended patent exclusivity of breakthrough GLP-1 therapies, with no meaningful generic relief for 15-20 years, forcing CVS into a perpetual choice between excluding superior drugs and losing clients, or accepting coverage that severely erodes margins.
Until CVS demonstrates sustainable PBM client retention among major employers, successful integration of its healthcare delivery assets without further impairments, and a viable strategy to navigate the regulatory assault on traditional PBM economics, the investment profile remains fundamentally challenged. The Lilly defection represents more than a single client loss; it exposes structural fragility in a business model increasingly misaligned with market demands for transparency, clinical appropriateness, and technological innovation.
Eli Lilly: Weight-Loss Giant Amid AI Drug Discovery Eli Lilly: Undervalued Weight-Loss Giant Amid AI Drug Discovery and Virginia Jobs Boom Trends? $1050 Target in Sight?
Eli Lilly (LLY) shares are trading at $755.39 today, up 0.45% amid analyst upgrades and fresh headlines on its $2.3 billion Virginia manufacturing plant expansion, creating 650 high-paying jobs in Goochland County.
This comes as Q2 2025 earnings showcased 36% revenue growth to $11.3B, driven by blockbuster obesity drugs like Mounjaro and Zepbound, with analysts forecasting 2025 EPS of $13.14—up 20% YoY.
Just as #AI and #technology explode on X with 17K+ mentions today (fueled by AI video generators and drug discovery hype), and #business trends spotlight corporate expansions like Eli Lilly's Virginia move, LLY's AI-powered R&D pipeline positions it for viral growth in the $100B+ weight-loss market.
But with a forward P/E of 28x, is LLY the undervalued pharma powerhouse ready for a rally to $1050, or will patent cliffs and competition temper the upside? Let's break down the fundamentals, SWOT, charts, and setups for September 17, 2025.
Fundamental Analysis
Eli Lilly's momentum is anchored in its GLP-1 dominance and innovative pipeline, with the Virginia plant bolstering U.S. production amid supply constraints for weight-loss drugs. Analysts expect 2025 revenue of $47.3B (up 18% YoY), powered by approvals for oral obesity pills and oncology breakthroughs like Verzenio.
With #AI trends surging on X, LLY's use of machine learning in drug design (e.g., accelerating lung cancer therapies) undervalues its tech edge, trading 18% below fair value per DCF models. However, regulatory hurdles for new GLP-1s could delay peaks if biosimilar competition ramps up.
- **Positive:**
- Virginia plant announcement drives job creation buzz, aligning with #business trends and signaling supply chain resilience for 20%+ EPS growth.
- Q2 beat with $2.9B in Mounjaro sales; AI integrations in R&D tie into today's #AI hype, projecting $100B+ peak sales for obesity franchise.
- Broader trends in personalized medicine and #technology (19K mentions) position LLY for 15% annual revenue CAGR amid global demand.
- **Negative:**
- Patent expirations on key drugs like Humalog loom by 2026, clashing with #AI optimism if innovation lags.
- High R&D spend ($10B+ annually) pressures margins if trial delays hit, especially in a sticky inflation environment.
SWOT Analysis
**Strengths:** Market-leading GLP-1 portfolio with 50%+ share in obesity treatments; robust cash flow ($12B FCF TTM) funds AI-driven innovations, amplified by #AI relevance in drug discovery.
**Weaknesses:** Premium valuation at 28x forward P/E amid growth dependency; supply bottlenecks exposed by demand surges, vulnerable in #technology-shifting markets.
**Opportunities:** Virginia expansion for 650 jobs taps #business trends; AI for faster trials unlocks $50B+ in new therapies, undervalued at 18% below fair value amid #AI boom.
**Threats:** Biosimilar erosion from Novo Nordisk rivals; regulatory scrutiny on weight-loss ads during viral #technology discussions on social media.
Technical Analysis
On the daily chart, LLY is in a bullish uptrend, coiling in an ascending channel after bouncing from $740 support, with volume rising on plant news and mirroring #AI volatility spikes. The weekly confirms a multi-year bull flag from 2023 lows, now extending higher. Current price: $755.39, with VWAP at $752 as intraday pivot.
Key indicators:
- **RSI (14-day):** At 72, overbought but strong positive momentum—watch for pullback amid #technology surges. 📈
- **MACD:** Bullish crossover with expanding histogram, signaling acceleration; no divergence yet. ⚠️
- **Moving Averages:** Price above 21-day EMA ($745) and 50-day SMA ($730), golden cross intact for medium-term bull.
Support/Resistance: Key support at $740 (recent low and 50-day SMA), resistance at $770 (September high) and $800 (analyst target). Patterns/Momentum: Channel breakout targets $850; strong buy signals. 🟢 Bullish signals: Volume on #business news. 🔴 Bearish risks: RSI overbought could retrace 5% on profit-taking.
Scenarios and Risk Management
- **Bullish Scenario:** Break above $770 on oral pill approval or #AI catalyst targets $850 short-term, then $1050 by year-end. Buy dips to $740 for entries tied to Virginia jobs hype.
- **Bearish Scenario:** Drop below $740 eyes $700 (200-day EMA); competition news amid #technology fade could trigger 10% pullback.
- **Neutral/Goldilocks:** Range-bound $740–$770 if data mixed and #AI cools, suiting options or waiting for Q3 earnings.
Risk Tips: Use stops 2% below support ($725) to manage volatility. Risk 1-2% per trade. Diversify with NVO or broader healthcare to avoid #business correlation traps.
Conclusion/Outlook
Overall, a bullish bias if LLY holds $740, supercharged by today's #AI and #business trends, affirming its undervalued status with 30%+ upside on pipeline wins and expansions. But watch FDA updates and Q3 guidance for confirmation—this fits September's healthcare rotation amid viral tech hype. What’s your take? Bullish on LLY amid #AI drug trends or waiting for a dip? Share in the comments!

Eli Lilly (LLY) – Pharma Giant at a Key Price LevelHi,
Eli Lilly & Co. is one of the world’s largest pharmaceutical companies, founded in 1876 and headquartered in Indianapolis. It operates in over 125 countries and is best known for blockbuster treatments in diabetes, obesity, oncology, and immunology. Recent growth has been driven largely by its GLP-1 class drugs Mounjaro and Zepbound, which have quickly become industry leaders in the weight-loss and diabetes markets.
Recent Fundamentals (Q2 2025)
Revenue: $15.56 B (+38% YoY)
- EPS: $6.31 (beat expectations)
- Mounjaro sales: $5.2 B
- Zepbound sales: $3.38 B
- Full-year guidance: Revenue $60–62 B, EPS $21.75–$23.00
- Margins: Gross margin ~82.6%, net margin ~25.9%
- Profitability: ROE ~75.5%, ROIC ~29.6%
While fundamentals remain strong, the recent Phase III data for the oral weight-loss pill orforglipron came in below expectations, sparking a ~14% drop, the stock’s steepest one-day decline in decades. Analysts have since trimmed long-term sales forecasts for this product.
From a valuation perspective, the stock trades at a premium (~41× P/E, ~10.7× P/S), leaving little room for major disappointments.
Technicals
Technically speaking, the price has arrived in the zone where I’ve been patiently waiting to share it as an idea. This is a good area from where to start building positions if you’re interested.
There are quite a few technical confluence factors aligning here, but be ready to grab it also around $500 if the market offers it. Let that be your guide:
- If you’re not willing to hold long-term, don’t touch it.
- If you’re not willing to buy more at lower prices, don’t touch it.
Good luck,
Vaido

LLY what next after the free fallLLY, what's next after the free fall?
This stock has lost about 24% of its value in the past 2 weeks alone.
$600 - $620 may be a buying zone as shown on my chart. With more than 100 drugs in its pipeline, there is like room for a positive push long term
NovoNordisk, possible rotation,safe green buy Zone after confirmNovo Nordisk got slammed after Patrick appeared in the Technical analysis and slammed the Price all the way down to goblintown. After some profit cuts and FUD in the market a possibly rotation is possible. The GLP-1 market is misunderstood. if a rotation is confirmed and some more facts will be shared after lilly earnings today a possible rotation and green buy zone will be confirmed. after new facts and confirmation a High risk/reward oppertunity is possible.
Let's all hope patrick will appear back again (maybe after lilly earnings) in the charts and will take everyting upside down.
Good luck.

ELI LILLY Is starting its next big rally.Eli Lilly (LLY) is about to test its 1W MA50 (blue trend-line) following a rebound just below the 1W MA100 (green trend-line). The latter, has been the ultimate market Support since May 2018 (last time it broke below it).
The overall correction since the July 15 2024 High seems like a Bull Flag pattern, no different than all the others after 2018 which only served as healthy rebalancing of an overbought price action.
Based on he 1W RSI in particular and the Bullish Divergence it displayed, the current Bull Flag resembles more the March - October 2019 pattern. Both that and the next one reached their 2.0 Fibonacci extensions.
As a result, our long-term Target on LLY is just below the 2.0 Fib at $1300.
-------------------------------------------------------------------------------
** Please LIKE 👍, FOLLOW ✅, SHARE 🙌 and COMMENT ✍ if you enjoy this idea! Also share your ideas and charts in the comments section below! This is best way to keep it relevant, support us, keep the content here free and allow the idea to reach as many people as possible. **
-------------------------------------------------------------------------------
💸💸💸💸💸💸
👇 👇 👇 👇 👇 👇

Eli Lilly Stock Down 10.9% Over Past YearTop or Consolidation? Here's My Take...
It's not crystal clear — I can see the case for both. But after years of chart-watching, this doesn't quite look like a top to me:
• Lacks symmetry
• Had chances to break down, but no real follow-through
🧭 Where are we headed?
I think pressure remains, and we could dip toward the 50% retracement of the 2023 move — that’s around 646.
🔁 If we bounce from there, I’ll shift my bias to a recovery and resumption of the long-term uptrend.
Disclaimer:
The information posted on Trading View is for informative purposes and is not intended to constitute advice in any form, including but not limited to investment, accounting, tax, legal or regulatory advice. The information therefore has no regard to the specific investment objectives, financial situation or particular needs of any specific recipient. Opinions expressed are our current opinions as of the date appearing on Trading View only. All illustrations, forecasts or hypothetical data are for illustrative purposes only. The Society of Technical Analysts Ltd does not make representation that the information provided is appropriate for use in all jurisdictions or by all Investors or other potential Investors. Parties are therefore responsible for compliance with applicable local laws and regulations. The Society of Technical Analysts will not be held liable for any loss or damage resulting directly or indirectly from the use of any information on this site.

Can Lilly Redefine Weight Loss Market Leadership?Eli Lilly is rapidly emerging as a dominant force in the burgeoning weight loss drug market, presenting a significant challenge to incumbent leader Novo Nordisk. Lilly has demonstrated remarkable commercial success despite its key therapy, Zepbound (tirzepatide), entering the market well after Novo Nordisk's Wegovy (semaglutide). Zepbound's substantial revenue in 2024 underscores its rapid adoption and strong competitive standing, leading market analysts to project Eli Lilly's obesity drug sales will surpass Novo Nordisk's within the next few years. This swift ascent highlights the impact of a highly effective product in a market with immense unmet demand.
The success of Eli Lilly's tirzepatide, the active ingredient in both Zepbound and the diabetes treatment Mounjaro, stems from its dual mechanism targeting GLP-1 and GIP receptors, offering potentially enhanced clinical benefits. The company's market position was further solidified by a recent U.S. federal court ruling that upheld the FDA's decision to remove tirzepatide from the drug shortage list. This legal victory effectively halts compounding pharmacies from producing unauthorized, cheaper versions of Zepbound and Mounjaro, thereby protecting Lilly's market exclusivity and ensuring the integrity of the supply chain for the approved product.
Looking ahead, Eli Lilly's pipeline includes the promising oral GLP-1 receptor agonist, orforglipron. Positive Phase 3 trial results indicate its potential as a convenient, non-injectable alternative with comparable efficacy to existing therapies. As a small molecule, orforglipron offers potential advantages in manufacturing scalability and cost, which could significantly expand access globally if approved. Eli Lilly is actively increasing its manufacturing capacity to meet anticipated demand for its incretin therapies, positioning itself to capitalize on the vast and growing global market for weight management solutions.

Eli Lilly (LLY) Shares Fall Over 15% in MayEli Lilly (LLY) Shares Fall Over 15% in May
The share price of Eli Lilly and Company (LLY), the world’s largest pharmaceutical company, has seen a sharp shift in market sentiment:
→ From its April low to high, LLY shares rose by over 30%;
→ However, since the start of May, the LLY stock price has dropped more than
15% — the closing price on the last trading day of April was around $895, while today the share is trading near $775.
Why Are Eli Lilly (LLY) Shares Falling?
The decline can be attributed to three key factors:
1→ Q1 Earnings Report: Although the company reported earnings per share above expectations ($3.34 vs $3.25), investors may have been concerned by significantly higher spending on research and development.
2→ Competitor Partnership: CVS Health’s announcement that it will offer Novo Nordisk’s Wegovy instead of Lilly’s Zepbound added further pressure to LLY shares.
3→ Sector Sentiment: Broader biotech sentiment turned negative following reports that the Trump administration is considering a pricing model that would cap drug prices based on lower rates in other countries.
The media is also discussing upcoming decisions from Vinay Prasad, the new head of the FDA division overseeing vaccines and gene therapy.
Technical Analysis: Eli Lilly (LLY) Share Chart
Key price movements (marked on the chart) justify the formation of a downward channel.
On the one hand, bearish sentiment may intensify in light of recent developments. The median line of the channel could act as resistance to any upward movement.
On the other hand, bulls may find support around the $765 level — a former resistance point and the boundary between two price gaps.
This article represents the opinion of the Companies operating under the FXOpen brand only. It is not to be construed as an offer, solicitation, or recommendation with respect to products and services provided by the Companies operating under the FXOpen brand, nor is it to be considered financial advice.

ELI LILLY: The time to buy and target 1,300 is now.Eli Lilly is neutral on its 1D technical outlook (RSI = 48.409, MACD = -5.160, ADX = 28.927) and this is technically the most efficient level to buy for the long term towards the end of the year, as the price is sitting around its 1W MA50. The macro pattern is a Channel Up starting back in March 2019 and every time this broke under the 1W MA50 (but remained supported above the 1W MA100) and consolidated, it was the most efficient long term buy signal. In 6 years this has only happened 4 times and all those times the 1W RSI hit the 38.750 S1 level. The immediate target of all bullish waves that started after such bottoms, has been the 2.0 Fibonacci extension. Go long, TP = 1,300.
## If you like our free content follow our profile to get more daily ideas. ##
## Comments and likes are greatly appreciated. ##

ELI LILLY ahead of a 1D Golden Cross targeting $1225Last time we looked at Eli Lilly (LLY) 3 months ago (November 21 2024, see chart below), we've identified the bottom of its 5-year Channel Up and issued a strong long-term buy signal:
Now we are upgrading our Target as the price action turned out to be very similar to the 2nd half of 2020, at the end of which the company witnessed strong growth.
As you can see both 2020 and 2024 patterns have been correction phases in the form of Channel Downs. Even their 1D RSI sequences are similar. A 1D Death Cross paved the way for the bottom soon after and a 1D Golden Cross (Jan 11 2021) confirmed the start of a new phase of growth.
The price is now above the 1D MA200 (orange trend-line) and if it continues to replicate 2021, then we expect this to be a Bullish Leg that will target the 1.786 Fibonacci extension. Our long-term Target now goes from $1135 to $1225.
-------------------------------------------------------------------------------
** Please LIKE 👍, FOLLOW ✅, SHARE 🙌 and COMMENT ✍ if you enjoy this idea! Also share your ideas and charts in the comments section below! This is best way to keep it relevant, support us, keep the content here free and allow the idea to reach as many people as possible. **
-------------------------------------------------------------------------------
💸💸💸💸💸💸
👇 👇 👇 👇 👇 👇

Finally a stock I like...this one is a real dealFinally, an investment idea! (after how much doom and gloom?) — Novo Nordisk.
You will all be familiar with Ozempic, the Danish company’s flagship product and the reason so many celebrities, influencers, b listers and regular schmegular Americans are suddenly skinny. I ignored the stock for most of ‘23/24, because it was so expensive. I am still a value investor (for my sins) and I just didn’t see a lot of value there — it was priced in.
Imagine my surprise as I was thinking about “megatrends” (vom) for the year ahead — AI, data, 'zempy. Novo stock has fallen 37.80% in the last six months. And you know what that means…that’s a real deal!
Why is it a real deal? (Don’t you like booze stocks Eden?)
Ozempic is not going away. At this point it is synonymous with weight loss as “Uber” is to ridesharing or Google is to search.
Note this data per Barclays, from recently issued rx data in the US — Ozempic script issuance has grown +8.4%, while WeGovy slightly trails it at 7.4% — both owned by Novo. While Eli Lilly also makes a GLP, Novo is still the leader.
Strong guidance from management on sales — +16% - 24% — roughly implies revenue of $48bn for ‘25 and $57bn for ‘26…that’s a compounder.
America and much of the western world has an obesity problem. There is a clear incentive for governments to underwrite the drug because obesity has a clear social + fiscal cost on society — per UoA, the fiscal cost of obesity in NZ is at least $2bn¹.
People have an incentive to use Ozempic, because they are vain.
This is a nice hedge against the booze stocks I like so much. Benefit from both sides of the trade — buy booze at low teens multiples; buy Novo and benefit from lower drinking rates as there’s several studies that imply ‘Zempy reduces drinking.
I don’t want Ozempic, because I like to live the good life.
This does not mean the vast majority of people won’t use Ozempic. At the moment, one in eight Americans have used a GLP. That’s +334mn people. 40% of Americans are obsese.
There’s a Lollapalooza effect happening here — a bunch of incentives — vain people, governments wanting less obese people, the various side health benefits of GLPs, etc. I like when a lot of incentives are aligned because you’re relying on psychology rather than projecting numbers on an excel spreadsheet.
Novo has sold off recently due to a trial of its CagriSema drug missing expectations. Eyes on the prize, though — current GLPs, which still have plenty of market to saturate.
Eli Lilly has traded up in recent times, while Novo has traded down. The two tend to trade in lockstep so the disconnect is an opportunity to buy the world’s leading GLP maker at a good price.
Eli Lilly is the closest comp, but it trades at a 38x fwd multiple, while Novo trades at 20x — i.e. an almost 50% multiple discount (see chart). I like that too…
Note analyst recs on chart also…
This analysis is provided by Eden Bradfeld at BlackBull Research—sign up for their Substack to receive the latest market insights straight to your inbox.

Loss in weight loss Drugs GLP1 Drug producers started 2024 with very strong momentum with Lilly touching nearly a market cap of 1T USD. But since then, the GLP1 manufactures have lost a lot of momentum. Novo Nordisk is at 52 weeks low as shown by the red line. Eli Lilly stock chart also showing bearish engulfing candle. The 20-Day, 50-Day and 100-Day are almost below the 200 Day SMA showing bearish divergence. IN the short to medium term the Price trend looks bearish unless there is a positive catalyst for the stock.
