Is it better to buy Binance than Bitcoin (or Ethereum)!?!We wrote about Binance going bullish vs USD nearly 2 weeks ago (check Related Ideas). Is it going bullish vs BTC also?
Binance is well known as being one of the largest if not the largest crypto exchange in the World.
Binance coin is one of the coins with clear utility use. You can even use it to pay your trading fees on Binance.
Probably now it makes sense to us why Binance Coin made astronomical growth after being introduced.
However, it had to go thru some bad times also. As the whole crypto market did.
On the other hand, it recovered with more than 600% growth at the start of this year (more in % than BTC) after we came out of the bear market (which I'm 90% we already did some time ago!).
At that time it was more profitable to hold Binance Coin than Bitcoin.
Is it the same today after both coins reached local hype peak!?
Let's check the pros and cons!
PROS:
- we just reached 0.5 Fibbonaci level (50% is bullish support and worked as a great resistance at two points before - check iv and 2)
- we have a similar pattern when we broke below the previous level but stopped at the peak that was made just before the top (check !)
- MA500 is usually really strong support and served as a great resistance from where we had a bounce
CONS:
- we had MA100 crossing down MA200 and it took us first to consolidation and then local dip
- we had the opposite of "golden cross" where MA50 crossed down MA200 and it wasn't nice
Seems like price wise it's not that bad to start buying BNB today for ROI.
However, for a trader, it might be smarter to wait for either higher low so you have confirmation that trend has changed or to play bounces from key levels and turn them into midterm holding if they prove to be just fine.
RIT is much better in that case! Either we will have wave 4 bottom and start of the run similar to wave 2 finishing or we would have consolidation, this is still strong coin to hodl. Crypto market is in a bull trend and Binance is the leading exchange - a solution that already works in practice. What else needs to be said!?
This is just an idea. It's not investment advice.
Eliotwave

Elliott Wave Chart Patterens Hi Traders,
These patterns can be seen in long term as well as short term charts. Ideally, smaller patterns can be identified within bigger patterns.

Triple Combo WXYXZ.The market quickly penetrated the support line overnight and then reversed.
It may be too early to say, but it is a concrete sign of reversal.
The daily candle will probably close in "Evening Star"... to follow!
We can also notice a head and shoulder pattern on a 15-minute chart
Le marché à rapidement pénétré la ligne de support cette nuit pour ensuite se renverser.
Il est peut être trop tôt pour se prononcer mais c'est un signe concret de changement de tendance.
La bougie daily va surement fermer en "Etoile du soir" .. à suivre !
Nous pouvons aussi remarquer une figure tête épaule sur une chart de 15 min

USDCAD Long Hi Traders....
If you didn't find a buy setup in a previous wave to the upside you have to wait that the price will fall back to that trendline then look for your setups again.
"May the forex be with you"


USDCAD W1 1MUSDCAD near very strong suport made buy trand line from 2011 year. At the same time we have the and of correction Wave 2 of the Wave II. At the same time, we have small volume on thith level, it means, that big player is waiting for the next move up, whith position which was gathered during previous wave.
Chaykovskyy. Forex Education & Mentoring
www.facebook.com


Gold up We just finished the primary w.4 with triangle correction, as we all know that triangle usually the move before the last move so now is the time for the last move w.5, we can see that gold just broke the triangle in which confirm the start of w.5 of primary degree. We can see that w.1 of the lesser degree is finish and we are now in the correction w.2 of a lesser degree. The ideal retracement would be around 61.8% of w.1 in which we are very close to that already. We also might also see w.2 retrace back to around 78.6% but the count is still valid as Long as w.2 is not exceeding the beginning of w.1. This is the perfect trade with really good ratio with tight stop loss and high profit!.

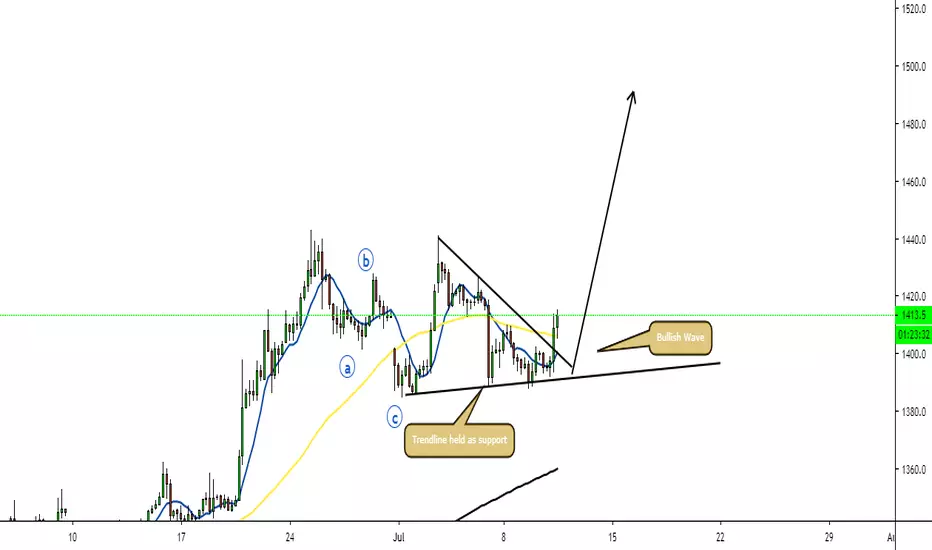
Gold Big Buy Set Up Wave AnalysisI am looking for Gold to push higher to 1500.00 price point for target 1 and eventually retest the highs around 1900.00 I believe the corrective structure is coming to an end and a big Bullish wave is in front of us.
UPDATE: Btc dump before the real bull market starts!UPDATE: Big dump incoming for Btc before the real bull market starts!

Big dump incoming for Btc before the real bull market starts!Big dump incoming for Btc before the real bull market starts!

USDCAD Long Term BUYHi.. We will keep an eye on it and watch lower time frame for price action to trigger our buys and close our sells.

USDCHF (Ascending Triangle) '1D'as you can see the entire pattern had finished its route, and now its in the retesting area after that we have a 3 Support Zones we can also name them 3 TakeProfit Zones.


Back to 2017! It doesn't mean that this must be true. But I think it's the most likely scenario.
I'm not an expert on the theory of elliott waves . But this all makes sense ... look at the NVT indicator. We will be able to buy at very low prices.
I see the current situation so that the price is rising from the last strength, it is exhausted. The price has grown too fast. We need a great historical correction.

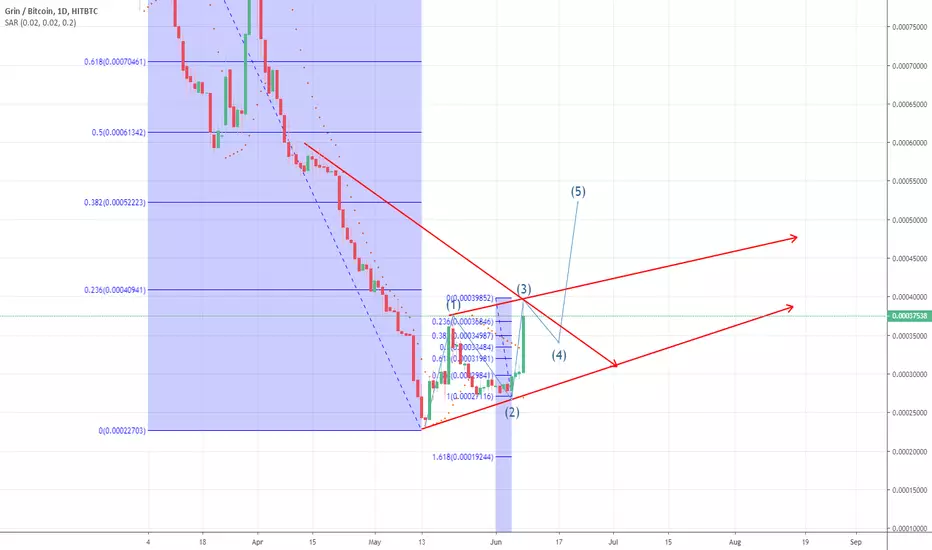
ETH Wave analysis All waves meet basic rules of Elliot analysis. As price chart display there is double stretching of third wave of the biggest order (green). In this green third wave there is yellow third wave which is also stretch. So on balance at the moment we are in fifth wave of stretch yellow wave.

Sberbank's shares Eliot Analysis According to Eliot Analysis Sberbank ordinary shares are completing the third wave included in last fifth wave of higher order.

Daily FB forecast timing analysis by Supply-Demand strengthStock investing strategies
View a Chart with Supply-Demand(S&D) strength forecast: www.pretiming.com
Investing position about Supply-Demand(S&D) strength: In Rising section of high profit & low risk
S&D strength Trend Analysis: About to begin an adjustment trend as a upward trend gradually gives way to a slowdown in rises and falling fluctuations
Today's S&D strength Flow: Supply-Demand strength has changed from a strong buying flow to a suddenly strengthening selling flow.
D+1 Candlestick Color forecast: RED Candlestick
%D+1 Range forecast: 0.3% (HIGH) ~ -1.3% (LOW), -0.5% (CLOSE)
%AVG in case of rising: 2.3% (HIGH) ~ -0.2% (LOW), 1.8% (CLOSE)
%AVG in case of falling: 0.8% (HIGH) ~ -1.4% (LOW), -0.6% (CLOSE)
Stock Price Forecast Timing Criteria: Stock price forecast timing is analyzed based on pretiming algorithm of Supply-Demand(S&D) strength.