S&P 500 Elliott Wave Analysis: Approaching the End of Wave 5I believe the S&P 500 is nearing the end of wave 5, possibly complete already or very soon, based on ES future and SPX charts. The wave 4 low from April 2025 (~5000) should be retested in a 3-wave ABC pullback, targeting late 2026 to early 2027, aligning with Fibonacci time frames. RSI divergence and ending patterns support this. Thoughts?
Elliott-waves

Understanding Elliott Wave Theory with BTC/USD If you’ve ever stared at a Bitcoin chart and thought, “ This looks like chaos ”, Ralph Nelson Elliott might disagree with you. Back in the 1930s, Elliott proposed that markets aren’t just random squiggles — they actually move in recognizable rhythms. This became known as Elliott Wave Theory .
So, what is Elliott Wave Theory? In the simplest terms, it’s the idea that market psychology unfolds in waves: five steps forward, three steps back, repeat. Not every chart follows it perfectly, but when you see it play out, it feels like spotting order in the middle of crypto madness.
⚠️ Before we dive in: remember, no single tool or pattern works alone. Elliott wave trading is most useful when combined with other methods.
The Elliott Wave Principle
At the heart of the Elliott Wave principle are two phases:
Impulse Waves (5 waves) : Markets advance in five moves — three with the trend, two counter-trend. This is when optimism snowballs.
Corrective Waves (3 waves) : The market cools off in three moves. Usually messy, choppy, and fueled by doubt.
Put them together, and you get a “5-3“ structure that repeats at different scales. That’s what gives Elliott Wave its fractal character. Again, don’t treat this as a crystal ball. Elliott Wave Theory rules are guidelines, not guarantees. Real-world Bitcoin charts bend, stretch, and sometimes ignore them altogether.
Elliott Wave Theory Explained with BTC
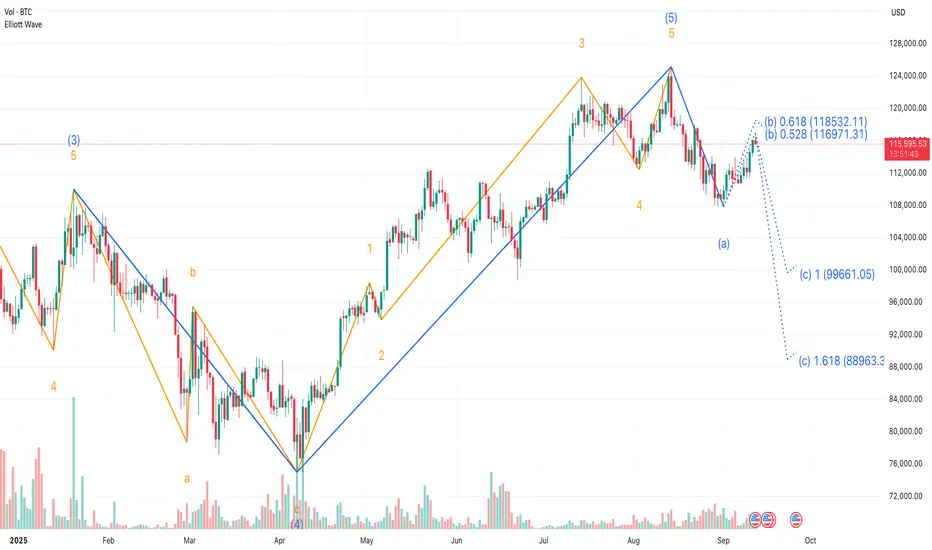
Let’s use an example: Bitcoin’s rally from early 2025 till now .
This downturn marked the first step in a broader consolidation, signaling that momentum was beginning to fade.
The corrective sequence unfolded in a classic A-B-C structure.
❗This three-part move effectively reset the market, washing out excess leverage and preparing the ground for the next impulsive cycle.
From that low, Bitcoin launched into a textbook five-wave impulsive rally.
This initial leg down, labeled wave (a), suggested that a larger corrective phase was now underway, replacing the bullish momentum with profit-taking and distribution.
That’s a textbook case of Bitcoin Elliott wave analysis . But notice: it wasn’t clean. Some traders counted the waves differently. Some saw extensions or truncations. That’s the thing with Elliott — interpretation matters as much as the rules.
Elliott Wave Theory Rules and Flexibility
The classic Elliott wave rules say things like: Wave 2 can’t retrace more than 100% of Wave 1. Wave 3 is never the shortest impulse wave. Wave 4 can’t overlap with Wave 1 in most cases.
But in practice, Bitcoin often blurs these lines. Extreme volatility, liquidation cascades, and macro shocks can distort wave counts. That’s why even seasoned analysts will say, “This is my Elliott count,” not the Elliott count.
The takeaway? Think of Elliott as a lens, not a lawbook.
Tools That Pair with Elliott
Many traders use the MT5 Elliott Wave Indicator or TradingView drawing tools to sketch their wave counts. Despite the waves becoming far more meaningful when tied to other signals:
Fibonacci Retracements: For example, watching how corrections line up with golden pocket levels. Momentum Oscillators: That confirm or contradict the wave structure. Macro Sentiment: Shifts that often align with corrective or impulsive phases.
Elliott Wave Theory trading doesn’t exist in a vacuum. Used alone, it’s like trying to predict the weather with just cloud shapes.
Why Beginners Should Care
If you’re new, you might be asking: “ Okay, but why bother with this at all? ” The answer: Elliott Wave Theory explained the psychology behind price swings long before the existence of cryptocurrency. It captures the human emotions behind markets — fear, greed, doubt, euphoria. And Bitcoin, perhaps more than any other asset, runs on psychology.
So whether you’re sketching waves, testing them on the Bitcoin Elliott wave chart , or just trying to understand why BTC always seems to surge then collapse, this framework helps put the chaos into context.
Final Thoughts 🌊
What is Elliott Wave Theory in trading? It’s not a magic formula. It’s a structured way of looking at markets through recurring patterns of optimism and pessimism.
And just like with every other tool we’ve discussed, it’s not about using it alone. The best insights come when you combine the Elliott Wave principle with other indicators: Fibonacci, moving averages, and even plain old support and resistance.
So the next time someone posts a “ wave count ” on a Bitcoin Elliott Wave analysis, don’t take it as gospel. Treat it as one possible map of where we are in the cycle. Because in trading, it’s never about certainty. It’s about perspective.
This analysis is performed on historical data, does not relate to current market conditions, is for educational purposes only, and is not a trading recommendation.

HSBC (HSBC) – $54 Risk Zone if ABC Correction Is Triggered HSBCHSBC is currently trading within a rising wedge, but a potential short-term drop of approximately 5% could trigger a full ABC correction pattern. This scenario is not confirmed yet, as the chart remains structurally bullish.
However, should the price reverse and break below the rising channel, it would likely mark the start of wave C, completing an A-B-C corrective sequence. This development could lead the price toward the $54 support zone, which aligns with a previous demand area.
While there is no immediate breakdown or weakness, traders should remain alert. A simple -5% drop might be all it takes to activate the next phase of correction.
Pattern: Potential ABC correction
Trigger: 5% decline from current levels
Target: $54
Bias: Neutral – watch for reaction if price softens

Bitcoin Dominance: Elliott Wave and Harmonics Combo (Part 2)MARKETSCOM:BITCOIN Dominance ( #BTC.D / CRYPTOCAP:BTC.D ) indeed started the rise I predicted back in late '22. CRYPTOCAP:BTC rose to the limits, exceeding the 100K Mark.
In #ElliottWave, this is Cycle Wave C (turquoise).
Primary Wave ① (white) completed, with the Corrective Primary Wave ②now in play.
The Correction will pave the way for Alt Season to commence, so the focus will shift to Alt Coins.
#Harmonics are showing #Cypher Patterns, a combo actually, on different degrees.
Bitcoin Dominance ( BTC.D ) Technical Analysis:
* Elliott Wave Impulse: Cycle C (turquoise)
* Harmonic Patterns: Bullish Cyphers
* 88.6% Fibonacci Retracement
* Break-Out with Divergence
* Leading Diagonal in Primary Wave ① (white)
Conclusion:
After a last rise, expecting MARKETSCOM:BITCOIN to top-out and start a Larger Correction.
Alt Season to start and deliver, based on #BTC losing ground.
After this, CRYPTOCAP:BTC to continue ruling, as the one and only #Cryptocurrency.

XRP last chances to sell at $3.33 before going to $2.50?As per note in chart. Expecting deep wave 4 correction might last till March 25

TOTAL3 - ALT SEASON - Bull Swing CRYPTOCAP:TOTAL3 is ready for the Alt Season.
#Altcoins will be rockin' the boat in '25.
CRYPTOCAP:BTC.D is running out of steam, thus opening the door for #AltSeason to start.
The correction on MARKETSCOM:BITCOIN Dominance is the key to #Alts to shine.
1.13T MC has been touched, previous #ATH.
Now CRYPTOCAP:TOTAL3 is in a Wave 4 (#ElliottWave Triangle), with Wave 5 of the Larger Degree C Wave about to shoot.
Targets between the #Fibonacci Extensions 200-261.8%.
That's the 1.5T to 1.8T range.

GOLD TREND FOR 2025Dear all my trader friends.
As I wish disciplined life for you then you can figure out how I care about you.
HAPPY NEW YEAR
.
.
We are still in a down trend till a shot under 2600.00 Dollar.
Thats a psychological trick to make fear in market.
.
.
So many other news are here that seems nothing is normal like Donald Trump wants to replace BTC with Gold.
Its even crazy to talk about and seems to be a over 5 years plan.
So i dont care about it I want trade this Lovly XAU daily.

Expecting an upside breakRecently, I published an analysis on this currency pair in which I mistakenly drew the target price for wave B. Generally, corrective wave B is equal to wave A in terms of time and price, and wave B is often shorter than wave A. Currently, wave B is equal to wave A in terms of time. Additionally, the price has recently formed a triangle pattern, and it’s expected that once wave B is completed, it will break upwards from this triangle, complete wave C up to the end of the channel, and then resume its downward trend. So, we are waiting to see if the price will break this triangle upwards or downwards.


LINKUSDT - Elliott Wave Analysis - BullishBINANCE:LINKUSDT LINKUSDT - Elliott Wave Analysis - Bullish
Article: The price chart analysis of ChainLink (LINK) using the Elliott Wave Theory, with lines drawn by this indicator, highlights it as one of the cryptocurrencies to watch.
The long-term (1-week) price chart of ChainLink (LINK) has shown a bullish movement since 2020, breaking through several key resistance levels and continuing to climb steadily.
The structure created by the indicator's automatic line drawing clearly shows that we are potentially in wave 3 of a bullish trend while concurrently in wave C of a bearish correction. Therefore, we expect prices to reach levels at $86, $105, and $137 respectively.
However, other factors should be considered when forecasting future price directions such as fundamental asset factors, technical factors, and economic conditions. The fundamentals for LINK are strong due to its popularity as a DeFi project with increasing real-world usage. Technical indicators support an upward trend.
Factors supporting the upward trend for ChainLink include:
Growth in real-world usage of ChainLink.
Partnerships with new allies.
Launching new products and services.
Risks against the upward trend for ChainLink include:
Global economic recession.
Volatility in cryptocurrency markets.
Competition from emerging technologies.
Conclusion
In summary, the long-term (1-week) ChainLink price chart indicates a robust upward trend, with expectations of breaking through key resistance levels, specifically at $53. Currently, the price is in an accumulation phase, poised for a soon-to-come upward adjustment. Additionally, it is noteworthy that the price has been consistently adjusting upward on a weekly basis.

Anticipating a Significant Drop After One WeekDear Traders,
I regret to inform you that the last wave of #CHFJPY still needs to be completed. Based on my analysis, I expect this completion to occur around the range of 163.9 to 164.4.
To mitigate potential risks, I highly recommend taking some hedge positions for your sell positions. It is advisable to allocate at least half of your lot size for these hedge positions. Additionally, please ensure that you set your take profit level at 163.9 and place a stop loss at your entry point.
I have provided a rough map indicating possible future movements. While it may not be entirely accurate, it can give you an idea of suitable points to consider initiating hedge positions and setting take profit levels.
For the upcoming week, it is crucial to prioritize account safety and remain cautious. A significant downward bearish trend is anticipated to commence soon.
To assess the future profit potential, I suggest monitoring # OANDA:XAUJPY and # $OANDA:XAUCHF. #XAUJPY has already reached the end of wave 5 in the bullish market, while #XAUCHF is poised to experience wave 5 in the uptrend. Consequently, these indications strongly suggest that JPY will likely gain strength in the near future. By employing hedge positions, you can safeguard your account during this period.
Wishing you a safe week ahead, with the anticipation of substantial profits to come.
Best regards,

BTC wave B is starting again after wave A has completed.BINANCE:BTCUSDT Finally, wave B is starting again after wave A has completed. Let's watch together to see if wave B will be destroyed so that wave 5 can expand or not.

Uh oh, the first target of the Elliott wave might be coming soonUh oh, the first target is about to be destroyed soon. The next targets are 36k and 45k, which will be tracked using our real-time wave counting tool, allowing us to quickly assess market conditions.

GBPCAD | Elliott Wave Hello Traders, here is the full analysis for this pair, let me know in the comment section below if you have any questions, the entry will be taken only if all rules of the strategies will be satisfied. I suggest you keep this pair on your watchlist and see if the rules of your strategy are satisfied.
The way I told you, you have to trade like this and you will have more profit always and you will not be a loss.

BTC 2 MOVE?
📍 Bitcoin can run in two possible ways.
» First: From 24700 the price can go down to 17000 and later we can see a big wave bull from here.
» Secondly, from around 26000 or 27860, the price may go up to 15890 and then from here the price may move above 46000 in April or July this year.
If you like us idea💡, so pls support us ☺️

Wipro at 5th wave.. bulish....in short term.Stop loss at break 2-4 trend line....
Target 🎯 will be ...1: 2 ratio.....

Short AMBUJA CEMENT with 1:17 RRAmbuja cement is going to fall near about 17% and the stop loss is near to 1% only.
Best time to get the maximum reward.
These types of moves generally come to notice with the ELLIOTT WAVE THEORY, as in this case:
Ambuja cement from its high made wave A sharp and wave B triangle. Wave C is about to come, and if we see wave C near about equal to wave A, the reward is maximum.
Also, wave 5 is extended towards a time high and should be retracted. Half of wave 5 is already retraced and half is left which should be retraced by wave C.
The stop loss is 524 and the target is 426.
Happy trading, guys.

Possible move of TSLAPossible move of TSLA using Elliot wave. Q3 deliveries missed, AI day is over, nothing impressive, it’s time to go down as the market goes deeper seeking for a bottom.
Disclaimer: I’m not a financial adviser.

Elliott wave 1 Elliott wave 1 Flat graph by Nantich The traingle
Turtle and rabbit
One day a rabbit was boasting about how fast he could run. He was laughing at the turtle for being so slow. Much to the rabbit’s surprise, the turtle challenged him to a race. The rabbit thought this was a good joke and accepted the challenge. The fox was to be the umpire of the race. As the race began, the rabbit raced way ahead of the turtle, just like everyone thought.
The rabbit got to the halfway point and could not see the turtle anywhere. He was hot and tired and decided to stop and take a short nap. Even if the turtle passed him, he would be able to race to the finish line ahead of him. All this time the turtle kept walking step by step by step. He never quit no matter how hot or tired he got. He just kept going.
However, the rabbit slept longer than he had thought and woke up. He could not see the turtle anywhere! He went at full speed to the finish line but found the turtle there waiting for him.

Audjpy 3h wave countingWe are in wave for which is made of abc and we are in wave c which is down ward

NFLX Elliott countLooking for a B wave bounce soon, would like to see this 4th wave end around 50% retracement. I would recommend calls....but not yet..... chart shows no sign of bottoming yet.

The growth of altcoinsThe Others index is completing the fifth wave of the Elliott five-wave uptrend, and it looks like Altcoins are set to see significant growth soon.
