GBP/JPY | Potential for Medium-Term CorrectionGBP/JPY experienced selling pressure for the second consecutive day, trading around 210.50. Despite the correction, the price remains near the 17-year high (211.00) reached last Monday. The market is currently caught in a tug-of-war between the yen, supported by the Bank of Japan's policy stance, and the pound, supported by the Bank of England's cautious stance.
✅ Factors Supporting the Japanese Yen (JPY)
- October BoJ Minutes: The newly released document showed broad agreement among officials to continue raising interest rates if economic forecasts are met.
- 30-Year High: Given that the BoJ just raised interest rates to 0.75% in December and is open to further tightening, the JPY has improved yield appeal.
- Geopolitics: Global uncertainty (Venezuela, Ukraine, the Middle East) continues to fuel safe-haven flows into the yen.
✅ Factors Supporting the British Pound (GBP)
- Hawkish Interest Rate Cut: Although the Bank of England (BoE) cut interest rates to 3.75%, the very tight vote (5-4) suggests the committee is in no rush to ease further.
- Expectation Revision: Investors are now scaling back speculation of aggressive interest rate cuts next year, providing a strong foundation for the GBP.
✅ Technical & Strategy Guide
- Consolidated Sentiment: The current decline is still considered a healthy correction. Strong follow-through selling is needed to confirm that the price has truly peaked in the 211.00 area.
- Thin Volume: Light year-end trading could lead to unexpected volatility or subdued (choppy) price movements.
Elliottwavecorrection

USDCAD - Breakout Will Flip the Trend BullishUSDCAD has been sliding inside a well-defined descending channel, completing a full five-wave drop toward the support zone. The structure from the top looks corrective rather than impulsive. That means the downtrend is weakening as it reaches its final leg.
Your count shows Wave 3 finishing at the dashed red line zone, followed by a small Wave 4 bounce, and now the market is pushing into the last Wave 5. This final drop is expected to target the Fibonacci levels near 1.3915 and 1.3895 . Nothing suggests strength until those levels are tested.
The price is still trapped inside the downward channel, and every bounce has been getting sold. That confirms sellers are still in control for now. Wave (C) is close to completion, but buyers haven’t proven anything yet.
The bullish outlook only becomes valid after a clean breakout above the channel. Without that break, any upside move is just noise inside a bearish structure. The breakout must hold with a higher low to confirm a trend reversal.
If the channel breaks decisively, a strong bullish reversal toward 1.40+ becomes possible. The entire structure suggests the downtrend is aging, so a major upside swing is likely once sellers exhaust. Until then, downside targets remain open and caution is necessary.
Stay Tuned!
@Money_Dictators

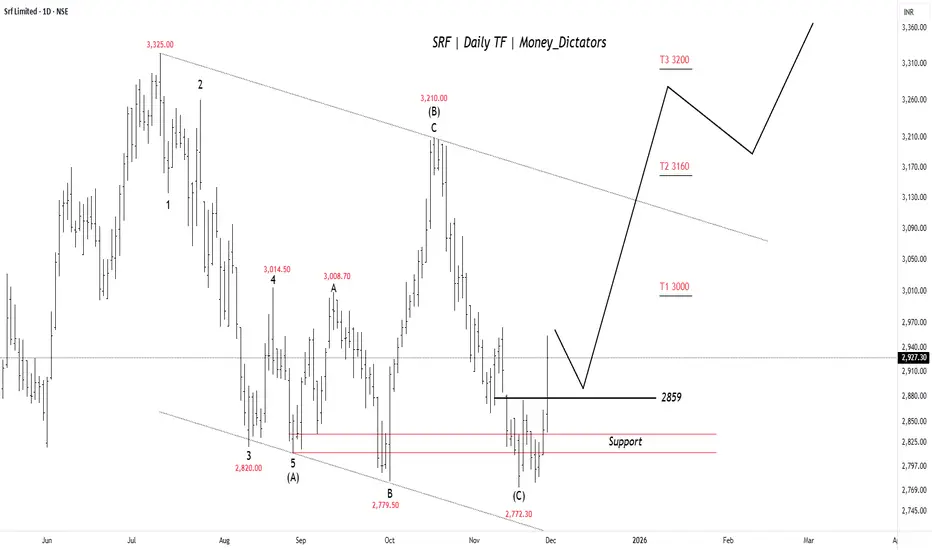
SRF on the Edge of a Sharp BreakoutSRF seems to have finished its ABC correction near the 2770–2800 support zone, and the price has bounced back above 2859 , which now acts as a short-term trigger. If the stock stays above this level, it can move toward 3000 first, then 3160 , and possibly 3200 . The chart shows buyers gradually taking control again after the correction, but the outlook stays positive only as long as price holds above the support region.
Stay Tuned!
@Money_Dictators
BTCUSD Monthly – Elliott Wave Count
Possible we will get a Wave ((IV)) triangle, if structure holds above $65,000 support.
Higher timeframe bias remains bullish.
Key zones: $122,154 (1.618 ext.), $188,111 (2.618 ext.)
Invalidation: Monthly close below $65,000
Roadmap:
Triangle consolidation likely through 2026
Breakout targets $120K-$190K
Impulse confirmation triggers next advance

Natural Gas - Wave iii Top Forming, Wave iv Pullback expected?Natural Gas appears to be completing Wave iii near major resistance, with a brief Wave iv pullback expected before a final Wave v push to the upside.

USDJPY Still Awaits the Next CatalystThe Japanese Yen (JPY) struggled to attract buyers and languished near a nine-month low against the US Dollar (USD). Despite some downside risks (from Japanese intervention), the JPY remained weak due to dovish signals from the Japanese government.
--------------------------------------------------------------------------------
## JPY Weakening (Driving USD/JPY Up)
- PM Takaichi's Signal: Prime Minister Sanae Takaichi expressed the government's preference for keeping interest rates low and called for close coordination with the Bank of Japan (BoJ).
- Impact: These comments cooled market expectations for an upcoming BoJ interest rate hike, a key factor behind the JPY's underperformance.
## Limits to USD/JPY Upside
- BoJ Hike Expectations: Despite the weakening, traders still see a 24% chance of a BoJ rate hike in December and a 46% chance in January.
- Intervention Warning: The recent decline in the JPY prompted Japan's Finance Minister and Economy Minister to issue warnings about currency movements, fueling concerns about intervention.
- USD Weakens: The US dollar (USD) is languishing near a two-week low amid economic concerns (post-shutdown), which could help limit USD/JPY gains.
- Risk-off sentiment: A surge in risk-off sentiment could support the JPY as a safe-haven currency.
--------------------------------------------------------------------------------
## Bullish Scenario
- Upside Trigger: This week's breakout through the 154.45-154.50 horizontal resistance is seen as a key trigger.
- Next Target: Spot prices may rise to the 155.60-155.65 intermediate resistance and eventually aim to reclaim the 156.00 round number.
- Warning: Repeated failures above the psychological 155.00 level warrant caution before taking aggressive bullish positions.
## Bearish Scenario
- Buying Opportunity: Any further weakness should be viewed as a buying opportunity and is expected to find support near 154.00.
- Pivot Point: A convincing break below $154.00 could drag USD/JPY to the 153.60-153.50 region and the 153.00 round number. The 153.00 level should act as a key pivot point.
- Bias Reversal: A break below 153.00 could shift the bias to bearish and open the way to the 152.15-152.10 area.

USDJPY | Prices Starting to Exhaust and Potential to DeclineMarket Structure Overview
The current price is around 154.58 – 154.60. Overall, USDJPY has remained in a major uptrend (bullish) since early October 2025.
However, the current price pattern is showing signs of trend exhaustion in the upper area of the channel—approaching the supply zone of 155.00 – 155.50.
The RSI is starting to decline from the overbought area, while the momentum histogram also shows weak divergence (weakening upward momentum).
✅ Elliott Wave Structure (H4)
From the swing structure visible on the chart, the Elliott Wave pattern can be identified as follows:
✅ Elliott Wave Count:
- Wave (1): Initial rise from 149.00 → 151.50
- Wave (2): Correction to 150.40
- Wave (3): Strong impulse up to 154.00
- Wave (4): Mild correction to 152.00 – 152.20
- Wave (5): Final rally towards the 155.00 area (currently forming)
This means the price is at the end of the impulse phase (Wave 5) — which is usually followed by a major correction (ABC Correction).
✅ Technical Patterns and Confirmation
Technical Patterns Formed:
- A rising wedge pattern (a tapering upward pattern) is clearly visible at the end of the trend.
- A wedge like this often signals a distribution or reversal pattern at the end of an impulse wave (wave 5).
- The upper area of the wedge and the supply zone of 155.00 – 155.50 have the potential to become a strong reversal zone.
📊 Confirmation Indicators:
- RSI: forming a bearish divergence — higher price high, lower RSI high.
- Momentum Histogram: starting to shrink, indicating weakening bullish momentum.
- This supports the possibility that Wave 5 is nearing completion.
✅ Projected Movement Direction
📉 Main Scenario (Reversal / Downward Correction)
After Wave 5 completes around 155.00 – 155.50, the price has the potential to reverse downwards, forming a large ABC correction (the beginning of Wave A).
Initial correction targets:
- Target 1: 154.00 (minor support & lower wedge)
- Target 2: 153.00
- Target 3 (extension): 151.50 – 152.00
If the price breaks through wedge support (BOS downwards), it confirms the Wave A correction has begun.
📈 Alternative Scenario (Continued Breakout)
If the price breaks strongly above 155.50 with high volume, it indicates the Wave 5 extension is continuing.
Continued targets: 156.00 – 156.50, before a major correction begins.
However, this opportunity is smaller, due to numerous signs of exhaustion in the upper area.
--------------------------------------------------------------------------------------------------------
✅Short-Term Position (Potential Reversal)
- Sell Entry: 155.00 – 155.40 (supply zone & upper wedge area)
- Stop Loss: 155.80 (above wedge + structure invalidation)
- Take Profit 1: 154.00
- Take Profit 2: 153.00
🎯 RR ratio around 1:3
Entry confirmation: emergence of a bearish engulfing/minor downward BOS on H1–H4.
-------------------------------------------------------------------------------------------------------
✅Long-Term Position (Buy the Dip)
If the Wave A–B–C correction completes below (around 151.50 – 152.00), then a new potential Wave (1) of the major uptrend (the next cycle) could begin.
- Buy Entry: 151.50 – 152.00 (strong demand zone)
- Stop Loss: 150.40
- Take Profit: 155.00 – 156.00
🎯 RR around 1:4 – long-term accumulation position

Silver (XAGUSD) 4H – Potential Ending Diagonal in C of (B)Price action in the 4H chart for Silver suggests we’re nearing the completion of a possible zigzag, with wave C possibly building out a clear ending diagonal (wedge) in the final leg of (B). This aligns with classic Elliott Wave behaviour, where a wedge pattern often signals the conclusion of a strong corrective rally before a significant reversal or new trend begins.
The current rally is testing both the upper parallel and key Fibonacci zones (0.618/0.764).
Watch for breakdown triggers below wedge support, which would confirm the reversal and set up a new bearish sequence.
If price keeps grinding higher within the wedge, further subdivisions may occur before wave C/B finally tops.
What’s your view on this structure? Do you expect a deeper reversal or more upside first? Share your ideas below!

Educational BTC Analysis: Decoding BTC's Wave (C) DownHello Friends, Welcome to RK_Chaarts.
Today we are going to understand Elliott Wave Teaching Points from the BTCUSD Daily Chart,
This chart sequence perfectly illustrates the difference between motive (impulse) and corrective waves, as well as the important structures and rules of a larger correction.
1. The Structure of a Corrective Pattern (A-B-C)The Big Picture: The overall movement, labeled Intermediate Wave (A), (B), and (C) (Blue), is a three-wave corrective pattern. This type of pattern moves against the trend of one larger degree (which have been an uptrend). The three-wave (A-B-C) structure is the classic way markets move in a counter-trend. Wave (A): The initial counter-trend move.Wave (B): A bounce or retracement that moves back in the direction of the previous trend, but fails to reach the start of Wave (A).Wave (C): The final, and often most powerful, leg of the correction, which is designed to complete the retracement. This wave is always structured as a five-wave impulse.
2. The Rule of Subdivisions: Corrective Waves are Internally Motive, Wave (C) is an Impulse: The report states that Intermediate Wave (C) is expected to unfold as a five-wave impulse sequence of a Minor Degree (Red) (Minor Wave 1, 2, 3, 4, 5).
Learning Point: This highlights a fundamental Elliott Wave rule: the C-wave of an A-B-C correction is a motive wave (it has a five-wave internal structure) because its purpose is to create strong directional progress and complete the larger correction. This is commonly known as a Zigzag correction (which has a 5-3-5 internal count for A-B-C).
3. Identifying the Strongest Move (Wave 3)
The Current Phase: The market is currently in Minor Wave 3 (Red) downwards.
Learning Point: In Elliott Wave theory, Wave 3 is typically the longest and never the shortest of the three motive waves (Waves 1, 3, and 5). This means the analysis anticipates the current move to be the most directional, high-momentum, and volatile part of the entire Intermediate Wave (C) correction. This is the "sweet spot" for trend traders.
4. The Principle of Alternation (Predicting Wave 4)
Upcoming Wave: The analysis projects a shallow Minor Wave 4 (Red) rebound.
Learning Point: While the chart doesn't show Wave 4 yet, this prediction is often guided by the Principle of Alternation. If the preceding corrective wave (Minor Wave 2) was a sharp, deep correction, the next corrective wave of the same degree (Minor Wave 4) is expected to be a sideways, shallow, or complex correction (like a flat or triangle). The prediction of a "shallow" wave 4 suggests Minor Wave 2 was likely a deeper, sharper retracement.
5. The Critical Invalidation Rule
The Invalidation Level: The report sets the critical invalidation price at 74,223, which represents the low or starting point of wave ((1)).
Learning Point: Wave ((2)) can never retrace more than 100% of Wave ((1)). By identifying a specific price level, we can assume that our study says price should not broke below that particular level, it provides traders with clear risk management parameters.
I. Current Wave Count Status
The analysis indicates that the previous upward corrective structure, designated as Intermediate Degree Wave (A) and Wave (B) (Blue), is complete. The market is now engaged in a significant downward movement within the larger Intermediate Degree Wave (C) (Blue).
This Intermediate Wave (C) is expected to unfold as a five-wave impulse sequence of a Minor Degree (Red) to the downside, fulfilling the final leg of the overall corrective cycle.
II. Detailed Downward Projection
The Minor Degree five-wave structure within Intermediate Wave (C) is currently positioned as follows:
Minor Wave 1 and Minor Wave 2 (Red): These waves are identified as complete.
Current Phase: The market is now unfolding Minor Wave 3 (Red) downwards, indicating the strongest portion of the bearish move is in progress.
Anticipated Completion: Following the completion of Minor Wave 3, the analysis projects a shallow Minor Wave 4 (Red) rebound, followed by the final impulse move, Minor Wave 5 (Red), to complete the entire Intermediate Wave (C) correction.
The ultimate completion of Intermediate Wave (C) will signal the end of the larger-degree correction (labeled as a corrective wave (2)).
III. Critical Invalidation Level
The integrity of this bearish wave count is contingent upon the price action respecting a critical support level.
Invalidation Price: 74,223
Significance: This price point represents the extreme low or starting point of wave ((1)), so Wave ((2)) correction Should not breach this level as per wave principles, if it makes lower low below 74,223 on the lower side, the current Elliott Wave analysis would be invalidated, requiring a revision of the entire wave structure and market outlook.
I am not Sebi registered analyst.
My studies are for educational purpose only.
Please Consult your financial advisor before trading or investing.
I am not responsible for any kinds of your profits and your losses.
Most investors treat trading as a hobby because they have a full-time job doing something else.
However, If you treat trading like a business, it will pay you like a business.
If you treat like a hobby, hobbies don't pay, they cost you...!
Hope this post is helpful to community
Thanks
RK💕
Disclaimer and Risk Warning.
The analysis and discussion provided on in.tradingview.com is intended for educational purposes only and should not be relied upon for trading decisions. RK_Chaarts is not an investment adviser and the information provided here should not be taken as professional investment advice. Before buying or selling any investments, securities, or precious metals, it is recommended that you conduct your own due diligence. RK_Chaarts does not share in your profits and will not take responsibility for any losses you may incur. So Please Consult your financial advisor before trading or investing.

triangle wave correctionin H1, already making double abc , the ao divergence indicates it might go further up, possibly making triangle wave ABCDE correction with 3 waves structure as per chart.

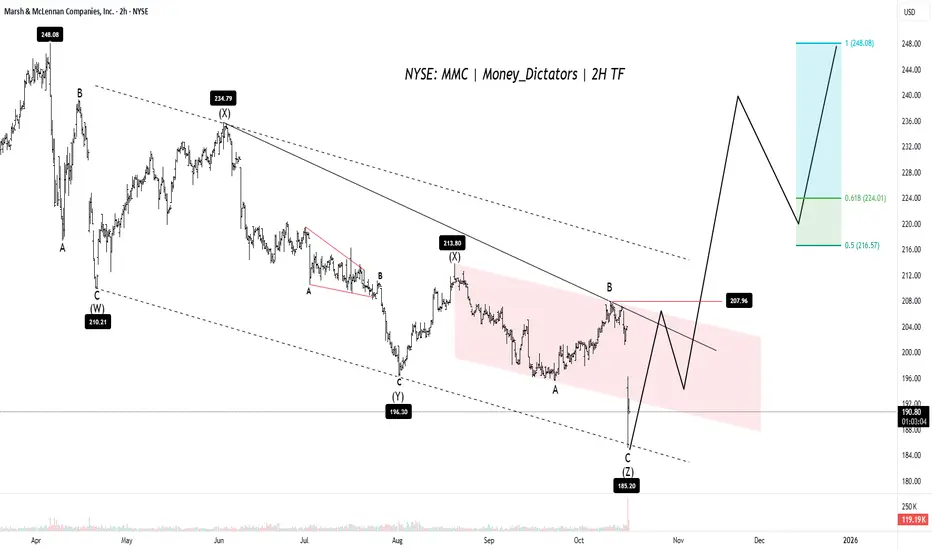
What Should You Expect From MMC?MMC is nearing the end of a recent price drop. The price is currently in its final downward phase, expected to bottom out around $184 to $186. Targets are 219, 234 & 245. Bulls can take control at wave B point(Resistance - $207).
If the price successfully holds above this $184–$186 support, the analysis predicts it will trigger a new, major upward trend. To officially confirm that the correction is over and a strong bullish trend has begun, the stock needs to break out above the $207 to $210 level. Once that breakout happens, the price is expected to rise sharply, potentially hitting the previous high of $248.
However, if the price drops below $184, this positive outlook will be invalidated, and the stock is expected to continue its downward correction.
Stay Tuned! Thank you:)
@Money_Dictators
GBP JPY - Wave D forming?Daily chart image shows my thought pattern and an opportunity I am waiting for price to revert to.
I'm referring to the Daily price chart and key counts are in line with Wave counting and supply and demand curve trading levels based on fair value gap intervals of weekly trading sessions plotted to a daily chart at intervals of 60.
Current wave -
Wave A: The first correction test (200+) - where a rejection into the impulse high - to form a weekly supply.
- Wave B: Deep testing of the lows into 184 territory, but keeps the rising channel weekly in tact.
- Wave C: Technical rebound exactly to the higher wick on the max top of the supply and settled in the marked zone - of a large volume of sell orders.
- Now to Wave D formation: 190? or below 189*? showing the weekly trend down to where the wav could end?
Master Key for zones
Red = Three Month
Blue = Monthly
Purple = weekly
Pink = Consolidative box example (Daily)
Orange = Daily
Risk Warning
Trading leveraged products such as Forex, commodities and CFDs, carries with it a high level of risk and so may not be suitable for every investor. Prior to trading the foreign exchange, commodity or CFD market, consider your investment objectives, level of experience and risk appetite. You should never risk more than you can afford to lose. If you fail to understand or are uncertain of the risks involved, please seek independent advice and remember to conduct due diligence as criteria varies to suit the individual.
Below are some of the take aways from the video - please listen again incase any detail is missed.
Do you enjoy the setups?
Professional analyst with 8+ years experience in the capital markets
Focus on technical output not fundamentals
Focus on investing for long term positional moves
Provide updates where necessary - with new updated ideas tracking the progress.
If you like the idea, please leave a like or comment.
To all the followers, thank you for your continued support.
Thanks,
LVPA MMXXIV

ETHUSD: Reversal Expected Near 4100The bullish outlook remains unchanged. We are expecting the price to reverse near 4100 . The sharp move on wave a, a small correction for wave b, indicates a sharp decline and rapid rise in the upcoming days.
Previous research:
Stay Tuned!
@money_dictators
Thanks :)

ETHUSD: Where Price Could Go?4h tf
ETHUSD has bounced back strongly from around $3,826 after completing an A-B-C wave pattern. Right now, the price is testing resistance near $4,756. It could drop a little to around $4,440 before moving higher again. If the uptrend continues, the next target levels are $4,955, $5,300, and $5,500.
Stay tuned!
Thank you,
@Money_Dictators

SOL is messy but is going through a correction.SOLs last move up in white primary ((1)) was not as large compared to the move up prior to that, which we can't see on the picture. So I guess we still have a large 3rd of a 3rd to come in a move up.
But first we still need to finish this correction SOL is in right now.
I believe SOL is doing a flat correction in a primary degree, so it takes some time to get through.
It looks like the green (B) wave is finally done, and now we just need the green intermediate (C) to finish. The 1st wave of that c-wave is almost over if not already, so anticipate a correction up in purple 2nd wave.
When that 2nd wave is done, SOL will move into a strong move down in wave purple 3 following the yellow path.
double (()) indicates circle on chart.
Gold Daily Short Term Outlook - Running Flat CorrectionI will more than happy for TVC:GOLD to blow past this typical running flat correction zone between 3600-3643 and head higher. However if it stalls at this zone and reverses then this is one possibility of how the wave (4) correction could to play out, one that ill be watching closely.
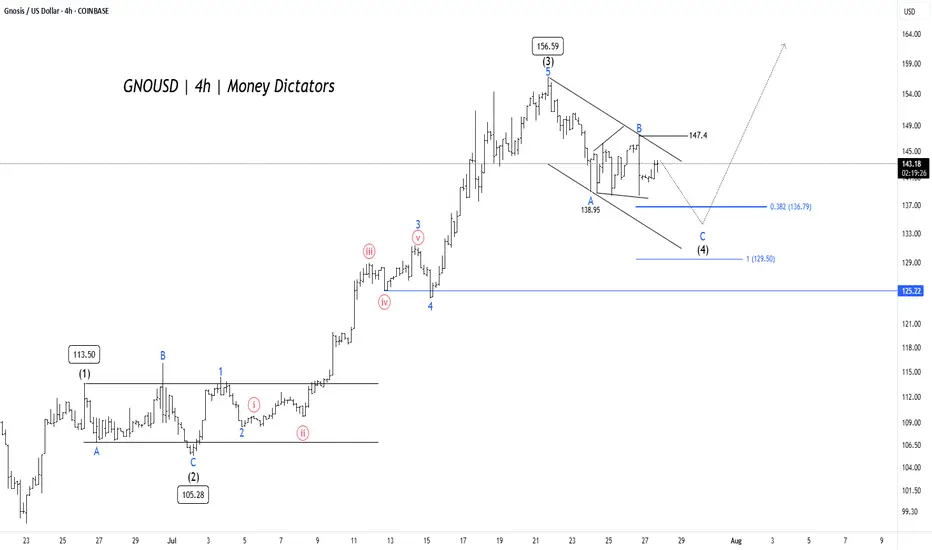
GNO/USD Price Action Aligns for Final Wave 5 PushGNO/USD pair is unfolding a clean Elliott Wave impulse pattern on the 4-hour chart. The rally began with Wave (1) reaching 113.50, followed by a corrective Wave (2) that bottomed near 105.28. This set the stage for a powerful Wave (3) that surged to 156.59, aligning well with Elliott Wave theory where Wave 3 is typically the strongest and steepest leg in the sequence.
Wave (4) is now in progress, taking the form of an A-B-C correction inside a descending channel. Interim support was found at 138.95 during Wave A, and Wave C could extend toward the 0.382 Fibonacci retracement level at 136.79 or the deeper support zone near 129.5. These levels are crucial, as they often mark the end of a corrective phase and the beginning of the next impulse. A confirmed breakout above 147.4 would signal the start of Wave (5) and the return of bullish momentum.
Short-term targets have the potential to reach 135 – 128 , while 125.22 remains the invalidation level for this bullish setup. After the completion of Wave (4), traders can look for long opportunities targeting 147 – 154 – 172 . As long as the structure holds and price respects key supports, the outlook remains favorable for a fresh push higher in Wave (5).
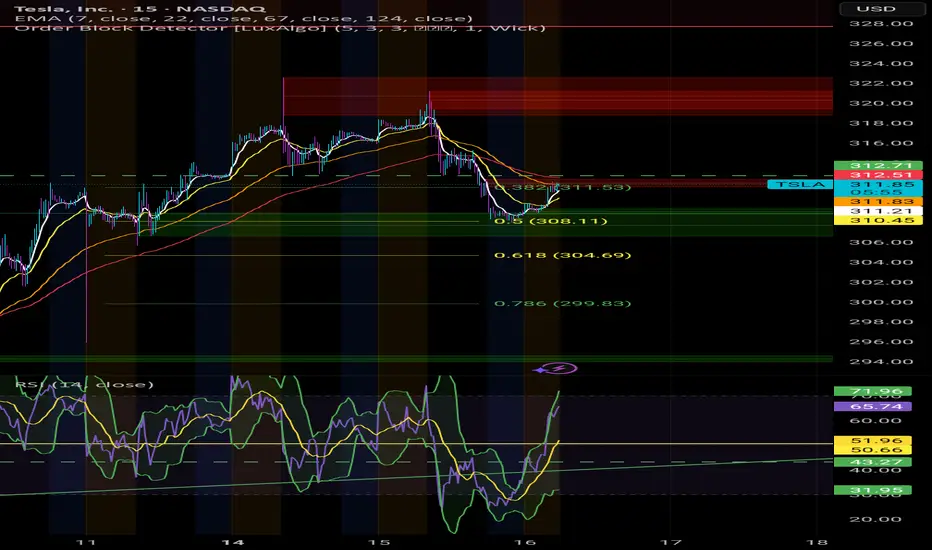
Is the BullRun over? I don't think so. $TSLAYesterday we saw a somewhat heavy fall in Indexes, and it probably scared alot of retail Bulls outs.
However, it seems we've fallen straight into potential medium term supports across multiple stocks in the markets.
I'm convinced we will get a good economic data print today.
This would open the door to new ATHs, again, in the Indexes.
For this to play out, the local bottoms established over night need to hold.
GOLD (XAUUSD) – Wave b Complete? Preparing for Wave c RallyGold tapped into the key demand zone and swept sell-side liquidity (SSL) beneath wave (iii) lows.
A five-wave decline appears complete, with wave (v) of b terminating just below the o.618 fib extension at 3344.86.
🟢 Wave c projection now in focus — looking for a 5-wave impulsive rally to develop.
Targeting the Sell Zone between the 0.5–0.764 retracement (3395.87–3425.07).
🧠 Structure Notes:
✅ Imbalance Zone (IMB) formed during the breakdown has now been tapped
🔻 SSL swept + bullish reaction = potential change of state
🟢 Wave (i) and (ii) projection underway – price needs to maintain structure above 3357.43 for bullish continuation
Targets: 3408.81 (0.618 Fib)
Invalidation below: 3340.31
Momentum and RSI divergence support reversal

EUR/USD Elliott Wave Outlook – Expanded Flat Playing Out?EUR/USD appears to be unfolding a classic expanded flat correction for wave (4):
Wave A formed as a 3-wave zigzag
Wave B retraced beyond the start of A — a key trait of expanded flats
Now looking for a 5-wave C-leg decline toward the 1.1122 – 1.1002 area
Aligned with 1.0–1.618 extensions of A
RSI + MACD divergence adds bearish confirmation at the B top
Potential bullish reversal zone into late June / early July
As long as price holds below the B high (~1.1650), the bearish path in wave C remains in play.
📍 Target zone: 1.1122–1.1002
📈 Bias: Bearish short-term, bullish long-term (wave 5 up next)

WTI Crude Oil – Bearish Elliott Wave SetupOn the 15-minute chart, I’m tracking a corrective rally in wave (ii) heading toward the 0.618 Fib zone (around 62.2–62.3) before the next major leg lower.
🔻 Bearish target: 52.00
📈 Looking for the final push up before confirming downside continuation.
💬 What are your thoughts on this Elliott Wave count?
For more updates and ideas, check my profile bio!
#WTI #CrudeOil #elliottwave #priceaction #technicalanalysis

DXY Has More To The UpsideDXY is right now in what I believe to be a 4th wave correction, which has turned into a wxy, and probably also will turn into a WXYXZ.
It has plenty of room to develop.
Since 4th wave corrections has a tendency to enter the area of the 4th wave of previous impulse, it will most likely go up to the area of the green rectangle above.
This will be between 103.2 - 104,7.
If it will go further up before heading down is to early to say.
But my previous forecast about it will go down below 96 is still in play and intact.

Gold Is Doing What Ever Gold Wants To DoPreviously I posted a reading where I said gold was to go a bit down before is went up. But Gold didn't go down, and went straight up.
But it did go up right :D
Right now I strongly believe gold is in a wxy correction.
And I think will finish the y-wave i the green box area somewhere between 3,147 and 3,077, which is the 100-123% fib-level of the w-wave.
The reason I believe this, is at that timewise the y-wave will here have taken as long as the w-wave, and I the price is heading for that cyan median line. And normally price will also go to the bottom and a bit below of the Kennedy line.
Multiple factors are pointing to that level.
When price hits that level, I believe we will see a 5th level to the upside where 4,000 definitely is in play.
I will include a link to a higher degree reading, where you can see I believe gold has finished a third wave, so we still need a 5th wave to the upside.
