Bist 100 in a Flat correctionMinor degree wave 4 seems like it's forming a Flat which we seem like to be in Wave B of the flat.When it's completed than wave C of the flat will crash heavily.
Elliottwaveideas

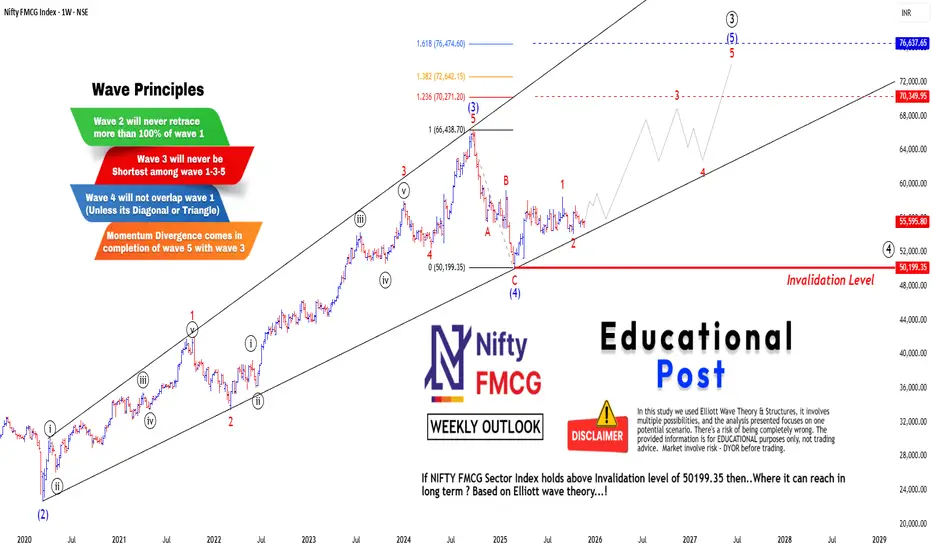
Nifty FMCG: A Deep Dive into the Elliott Wave AnalysisHello Friends,
Welcome to RK_Chaarts.
Today, we have brought this post to illustrate how we apply Elliott Wave Theory using the FMCG sector chart as an example for educational purposes.
In this post, we will analyze the Nifty FMCG Sector Index chart and see how Elliott Wave Theory can help us anticipate the potential direction of the market. We have previously discussed Elliott Wave Theory several times, and today we will apply it to the FMCG sector.
During this analysis, we will observe how the FMCG sector chart can be divided into various waves according to Elliott Wave Theory & its Principles, and how we can use these waves to forecast the future market direction. This post is purely for educational purposes and is not intended to provide any investment recommendations.
Elliott Wave Theory Principles
1) Wave 2 will never retrace more than 100% of wave 1.
2) Wave 3 will Never be shortest among all three Impulses (1-3-5)
3) Wave 4 will Never enter into the Territory of wave 1.
(Except Diagonals and Triangles)
4) Momentum RSI Divergence in Wave 3 & Wave 5.
Let's start,
We can clearly see that the sector index chart completed Wave (2) of intermediate degree (Blue) during the March 2020 fall (COVID period). After that, it moved continuously bullish and completed Wave (3) of intermediate degree (Blue) at the top of September 2024. From there, it continuously showed a fall downwards, completing Wave (4) of intermediate degree (Blue) at 50199.35 which is bottom in March 2025.
After that, the index has been moving slightly sideways to bullish, but there is still no strength or momentum visible in it. So, friends, if we assume the projection where Wave (5) can reach using Fibonacci trend-based Fib extension based on Elliott Wave Theory, Considering move in Waves (3) to (4), it can potentially reach around somewhere between fib level 1.236 to 1.618 levels in the long term in the future because this is a weekly time frame chart.
It has an invalidation level which is the low of Wave (4) pegged at 50199.35 on the chart. If the price falls even one point below this level, we will definitely have to reanalyze our wave counts and all these assumptions will get invalidated. Then we have assume that Wave (4) is still ongoing or something else is possible. So currently, assuming Wave (4) is finished, we have started the journey of Wave (5). These are assumptions as long as the price stays above the invalidation level; we can assume it will reach somewhere between fib level 1.236 to 1.618 levels in the next 1.5 to 2 years.
This analysis is based on Elliott Wave Theory and is shared purely for educational purposes to show how Elliott Wave Theory can be used to forecast a market roadmap.
I am not Sebi registered analyst.
My studies are for educational purpose only.
Please Consult your financial advisor before trading or investing.
I am not responsible for any kinds of your profits and your losses.
Most investors treat trading as a hobby because they have a full-time job doing something else.
However, If you treat trading like a business, it will pay you like a business.
If you treat like a hobby, hobbies don't pay, they cost you...!
Hope this post is helpful to community
Thanks
RK💕
Disclaimer and Risk Warning.
The analysis and discussion provided on in.tradingview.com is intended for educational purposes only and should not be relied upon for trading decisions. RK_Chaarts is not an investment adviser and the information provided here should not be taken as professional investment advice. Before buying or selling any investments, securities, or precious metals, it is recommended that you conduct your own due diligence. RK_Chaarts does not share in your profits and will not take responsibility for any losses you may incur. So Please Consult your financial advisor before trading or investing.
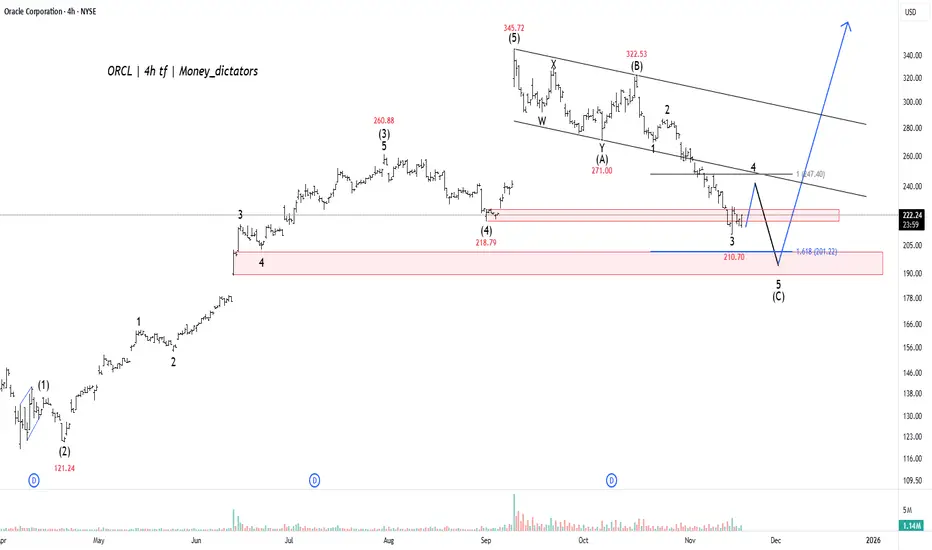
ORCL - Launchpad to New HighsWave Projection of Oracle (ORCL) suggests the stock is currently in the final stages of a major correction, specifically concluding the last downward leg, wave (C), of a larger pullback. The chart indicates that after a temporary bounce, the price is expected to make one final, sharp drop to complete this corrective phase. This action is essential for the market to "reset" before the next significant rally.
The critical support area for the end of this correction is identified in a tight range between $207.72 (the $1.618$ Fibonacci extension) and the immediate low of $210.70 . This zone offers strong confluence with previous structural support, making it the highest probability area for the market to find a decisive bottom. The analysis projects that the current selling pressure will exhaust itself within this $207-$211 range.
Once the price successfully reaches and holds this projected support zone, the analysis anticipates the launch of a major, long-term bullish impulse wave, likely the start of the final wave (5) of a large-scale uptrend. This new wave is expected to drive the stock significantly higher, with a target to surpass the previous all-time high of $345.77 . This pattern suggests that the current decline should be viewed as a final buying opportunity before a powerful upward trend begins.
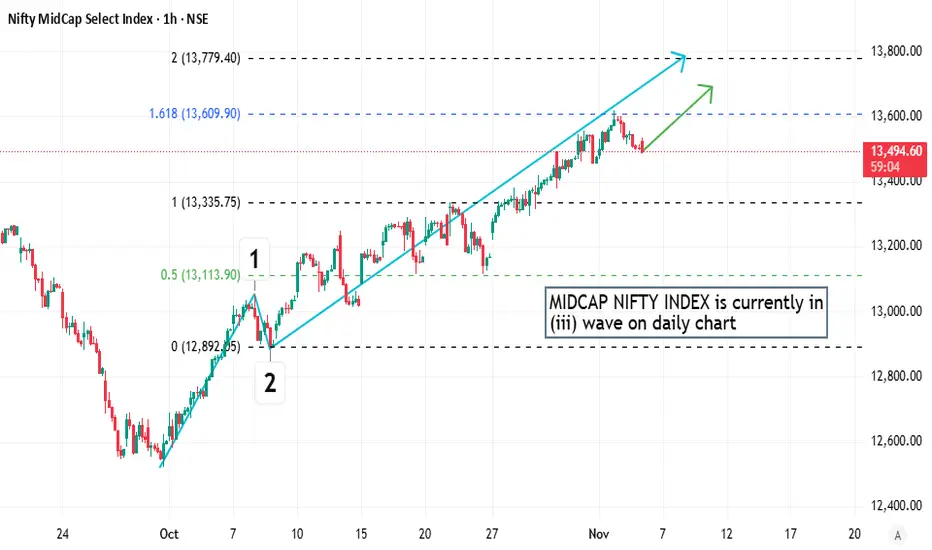
Elliot Wave Analysis of MIDCAP NIFTYThe chart is currently doing (iii) up sub-wave on daily chart and this up wave is underway and more to go. After that, a retracement down should follow in sub-wave (iv).
NAS100 Forecast: A Fresh Bullish Impulse Toward New HighsThe NAS100 index is currently moving within a classic Elliott Wave structure. After completing wave (3), the market entered a correction phase that formed wave (4). This correction appears to have ended in the highlighted support zone, where buyers stepped in strongly. The five-wave pattern before wave (4) confirms a solid bullish trend. Now, the index seems to be preparing for the final upward move wave (5). This wave often represents the last push of a rally before a larger correction starts. As long as the price stays above the recent support near 24,400 , the next targets could be seen around 25,200–25,600 . In simple terms, the market is expected to continue its uptrend after a short pullback, following the typical Elliott Wave sequence of five upward waves and three corrective ones.

Elliott Wave Analysis of AEGISLOGIn line with previous analysis,
(ii) subwave retracement is done
(iii) wave up should follow next
Elliott Wave Analysis of CNXFMXGFMCG index is well underway its 3rd wave
Currently in (ii) of 3rd
(iii) up swiftly should follow next

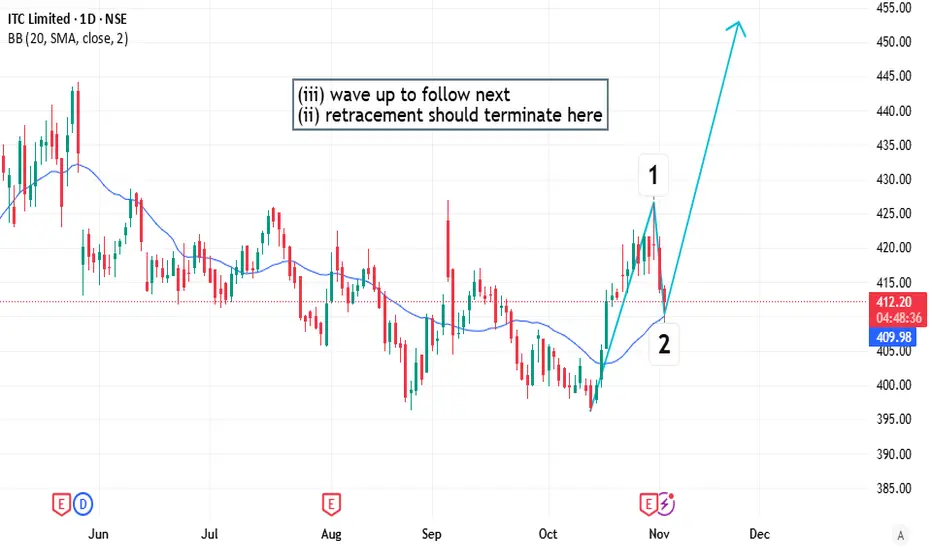
Elliott Wave Analysis of ITCITC and FMCG index will start their (iii) - 3rd wave next and (ii) wave should terminate here.
(ii) wave in ITC had a flat corrective structure, that means (iii) wave might be extended.
USOIL Near Final Leg USOIL is forming a clear corrective pattern inside a falling channel. Price is currently in the final leg of wave (5) of (C), suggesting one more dip is likely before reversal.
The downside target lies near 5,000–5,200 , where support from the channel base aligns. Once this level holds, a strong bullish reversal is expected, marking the end of the correction and the start of a new upward trend.
Stay Tuned!
@Money_Dictators :)

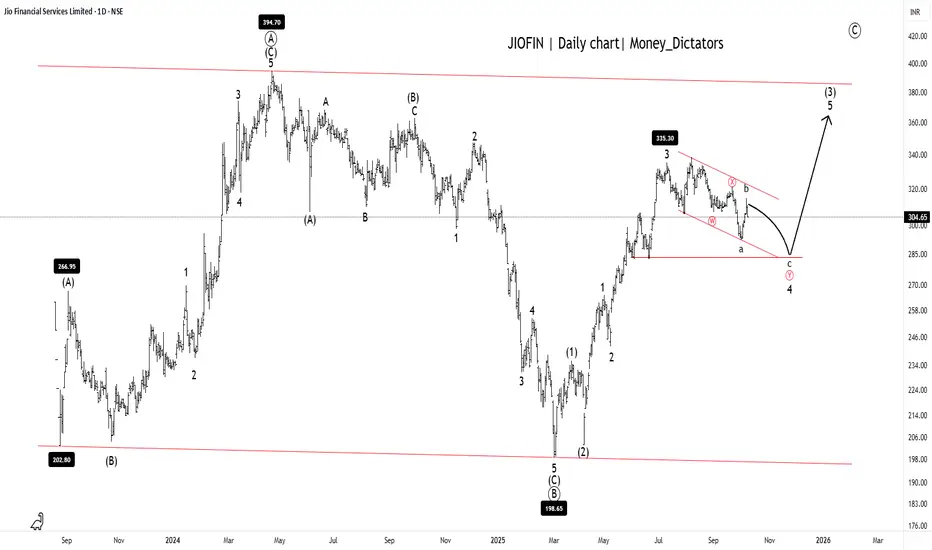
JIOFIN Setting Up for the Next Big Breakout!JIOFIN Daily chart
Possible short-term dip toward 285 - 290.
Long-term Levels: 335, 368, and 342.
Overall Trend: Bullish
Short-term trend: Bearish
JIOFIN is ready for the final upsurge as the correction ends at wave (C). A major A-B-C correction of the primary degree is clearly visible on the daily timeframe chart. Upon closer examination, it appears that the JIOFIN is currently in wave (Y) of wave 4. After completion of the wave 4 structure, Stock will set for the wave 4 for the given long-term levels.
Stay tuned!
@Money_Dictators
Thanks :)
NQ TradesB wave is in. Currently within 1st minutte wave of the intermediate C wave down, of the current 4th wave. Entry of the 382 retracement of the most recent 3rd wave, SL coveres upto 618. Looking for just 161.8% trend based fib of the 1-2 waves. Effectively predicting the terminus of the 3rd wave, we then allow a 4th to occur, then 5 to complete the first wave down of the C wave. Bosch.

Anticipation of GC / Gold over the next couple of weeks.For those who might have interest in a Elliott reading on gold:
In this post, everytime I write gold, I mean GC. This is just for info, since GC and gold doesn't have same prices, but the movement is very much the same.
If you follow along on a gold spot or similar, just translate the levels to there.
The picture is very messy for those who doesn't know what the lines and numbers are for, but please follow along.
I have a strong believe that with current PA the 3rd (white iii) wave is over, and now we will look for price to search for the bottom of the blue channel.
The blue channel is an acceleration channel, which is used to see if 4th (white iv) wave is under way. When the 4th (white iv) has developed some more, we are able to put another channel on, called the deceleration channel. This we will use to spot the end of the 4th (white iv).
Until now, it seems gold is respect the white 161 fib level, which is a very typical 3rd wave level to end.
The reason I started this post, was to tell you about my thoughts on when the 4th (white iv) is going to end, or at least how long it's going to be.
A typical scenario is that wave 4 is longer in duration than wave 2. For ease of spotting, I have put up these purple boxes, so now we do not anticipate gold to end the correction, before it has exited the purple box to the right.
The depth of wave 4 (white iv): I believe we are going to see prices in the level between 3600 and 3550 (the green box).
Reasons for the levels of the green box: when prices wave 2 (white ii) goes beyound the 61.8 fib level (in this case below), we tend to see a retracement between 38% and 50% in the 4th (white iv). And this is the area the green box indicates.
Timewise it is places outside of the previously mentioned purple box.
4th wave also tends to respect the base channel . Either the upper line or the middle line.
The lower line of the blue channel and the middle of the grey channel ( base channel ), the green box, outside of the purple box is all seeming to fall in the same place. So I like all the confluences falling together here, so that's why I feel pretty certain that, that is where the white iv wave is likely to end.
Timewise it'll be about 1st of october.
The white v wave i have also done a forecast on that fits if wave white iv retrace to the green box.
Normally the 5th wave is going to end in the area between 38% and 61% of the wave 1 and 3. This level is indicated with the blue fib.
Usually wave 5 is equal to wave 3. But can be extended if wave three isn't. Have indicated the 100% fib of white i wave with the cyan fib.
This 100% level falls between the blue fib, right around the yellow line I have talked a lot about before in previous post. So I also have a lot of confluences for price to go here in the white v wave.
If the white v is extended it could go to the blue 100% level, which also is confluenced with that cyan upgoing line. This is a pitchfork drawn from previous waves.
let's see where gold will take us.

AUD/NZD Waiting for Reversal SignalAUDNZD has formed 5 Elliott waves and waiting for reversal sign.
Good luck
MarketsTitan

Elliott Wave Analysis of Optiemus Infracom OPTIEMUSOn hourly chart, Optiemus has completed diagonal 1st. 3rd will go up after 2nd completed. 2nd might be forming a flat correction or a combination pattern.

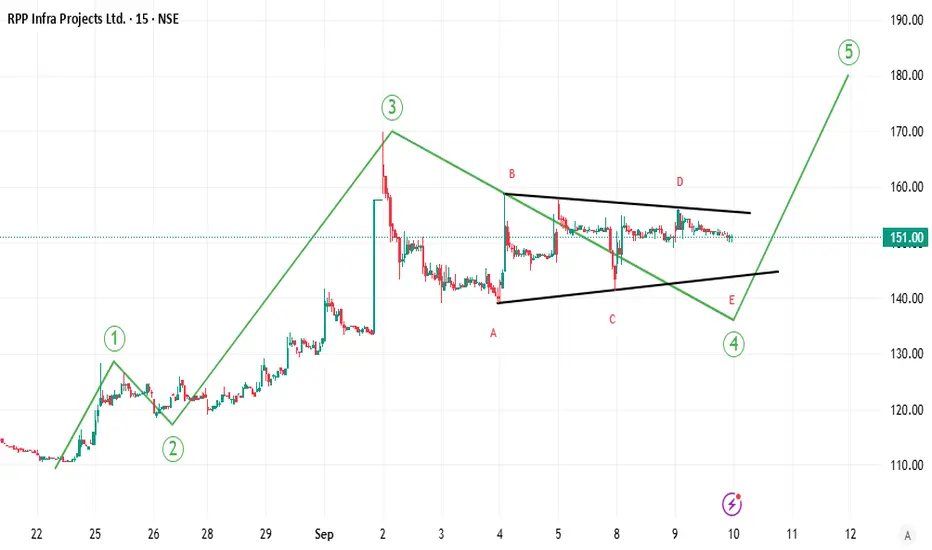
Elliott Wave Analysis of RPP Infra Projects RPPINFRAThe script is in (iv) wave on hourly chart of 1st wave on daily chart. The (iv) has formed a triangle and in last E sub-wave.
Elliott Wave Analysis: Balkrishna Industries LimitedHello friends,
Welcome to RK_Chaarts,
We're analyzing the chart of Balkrishna Industries Limited from the perspective of Elliott Waves.
Here's what we've observed: we've completed Primary Degree Wave ((3)) in Black at the peak of August 2024. Following that, we've witnessed a complete bearish and sideways movement, culminating in the low of April 7, 2025, which marks the end of Primary Degree Wave ((4)) in Black.
We've now initiated Wave ((5)) in Black, which should unfold as five Intermediate Degree subdivisions (1) to (5) in Blue. Furthermore, within Wave (1), we should see 1,2,3,4,& 5 Minor Degree subdivisions in Red. As we can see, we've marked Red Wave 1 as complete, and Red Wave 2 is almost complete.
According to Elliott Wave Theory, Wave 2 has retraced less than 100% of Wave 1, which is a valid point. Our invalidation level will be the low of Wave ((4)) in Black at 2150.
Since April 7, the price has made an impulsive move upwards, forming a high on May 9, 2025. We've labeled this as Minor Degree Wave 1 (in red). Within Wave 1, we've identified a lower degree, Minute Degree (in black), with subdivisions ((i))-((ii))-((iii))-((iv)) & ((v)).
Following Wave 1, a corrective move has unfolded in a 3-3-5 structure, specifically a flat correction. We've labeled this as Wave 2. If the price doesn't break below the low of Wave ((4)) (2150), and instead forms a higher high, it will increase the likelihood that our wave count is correct. However, if the price makes a lower low, it will introduce a doubtful scenario.
We've observed that Primary Degree Wave ((3)) in Black, which we identified at the top, has led to a corrective fall in Wave ((4)) in Black. Within Wave ((4)), we've labeled an Intermediate Degree (W)(X)(Y) correction (in blue) with subdivisions. This can be classified as a Double Three pattern.
Furthermore, within the (W) correction, we've identified another Minor Degree WXY pattern, and within the (X) wave, another WXY pattern. The (Y) wave has an ABC minor pattern. Additionally, we've noticed a slanting resistance trend line, which has been broken with the arrival of Wave 1.
Given the significant decline in price, market sentiments have likely contributed to the unfolding corrective structure. If the price forms a higher high, it will increase the likelihood that our potential Elliott Wave count is correct.
Elliott Wave analysis is always like solving a puzzle, requiring us to unfold the structure and make educated guesses about the emerging pattern. If the price breaks below the Wave ((4)) low 2150, our wave count will likely change. Until the price remains above this invalidation level, we'll continue to follow this wave count. If the price crosses the Wave 1 high, we'll have full confidence in this wave count.
In this study, we've applied Elliott wave theoretical structures to identify a potential scenario. However, markets can be unpredictable and may surprise us at any time, leading to new scenarios emerging.
The information, chart, and study shared in this post are solely for educational purposes. Our goal is to demonstrate how we plot market movements and make informed forecasting about future trends using Elliott Wave theory. If our predictions prove accurate, we can refine our wave counts accordingly. Conversely, if our predictions are incorrect, we will need to adjust our wave counts.
Please note that this analysis is not investment advice, and you should always consult with a financial expert before making any investment decisions.
I am not Sebi registered analyst. My studies are for educational purpose only.
Please Consult your financial advisor before trading or investing.
I am not responsible for any kinds of your profits and your losses.
Most investors treat trading as a hobby because they have a full-time job doing something else.
However, If you treat trading like a business, it will pay you like a business.
If you treat like a hobby, hobbies don't pay, they cost you...!
Hope this post is helpful to community
Thanks
RK💕
Disclaimer and Risk Warning.
The analysis and discussion provided on in.tradingview.com is intended for educational purposes only and should not be relied upon for trading decisions. RK_Chaarts is not an investment adviser and the information provided here should not be taken as professional investment advice. Before buying or selling any investments, securities, or precious metals, it is recommended that you conduct your own due diligence. RK_Chaarts does not share in your profits and will not take responsibility for any losses you may incur. So Please Consult your financial advisor before trading or investing.

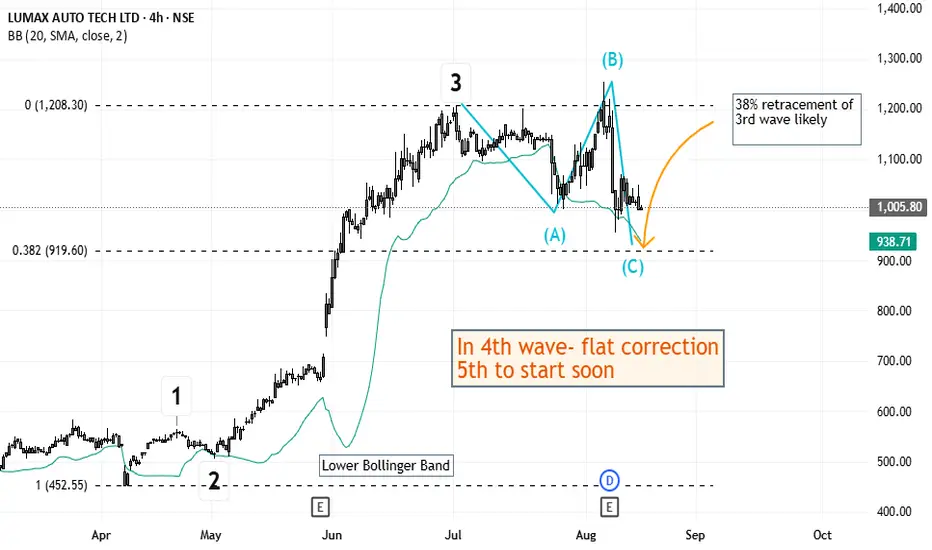
Elliott Wave Analysis of Lumax Auto Technologies LUMAXTECHLumax appears to be in 4th wave currently. The 4th wave turned out to be a flat corrective wave with (3-3-5) internal waves. One lower low is probably remaining before 4th is completed.
Elliott Wave Analysis of Ashapura Minechem ASHAPURMINThe script is currently in retracement wave 4 and at a crucial support. When completed, next 5 waves impulse should follow in 5th wave.

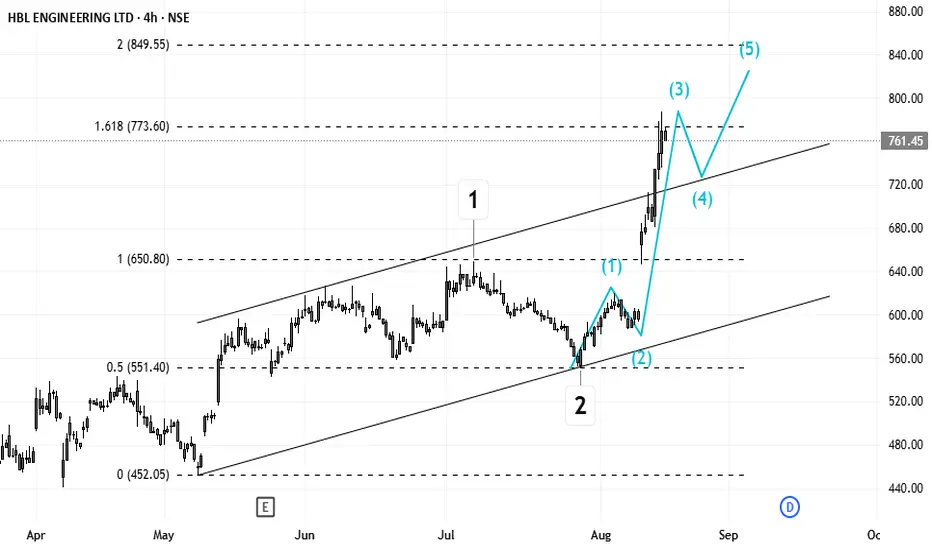
Elliott Wave Analysis of HBL Power Systems HBLENGINEThe script seems to be doing 3rd wave on daily time-frame. The first wave was diagonal. After 3rd is done, a retracement should follow and then again an impulse wave 5th to complete the larger impulse move.
Elliott Wave Analysis of Apollo Tyres APOLLOTYREApollo Tyres has completed a complex correction which seems to be a combination of a flat wave and a zigzag wave. Also, the B wave in zigzag was a triangle retracement. A 5 wave impulse should follow after this.

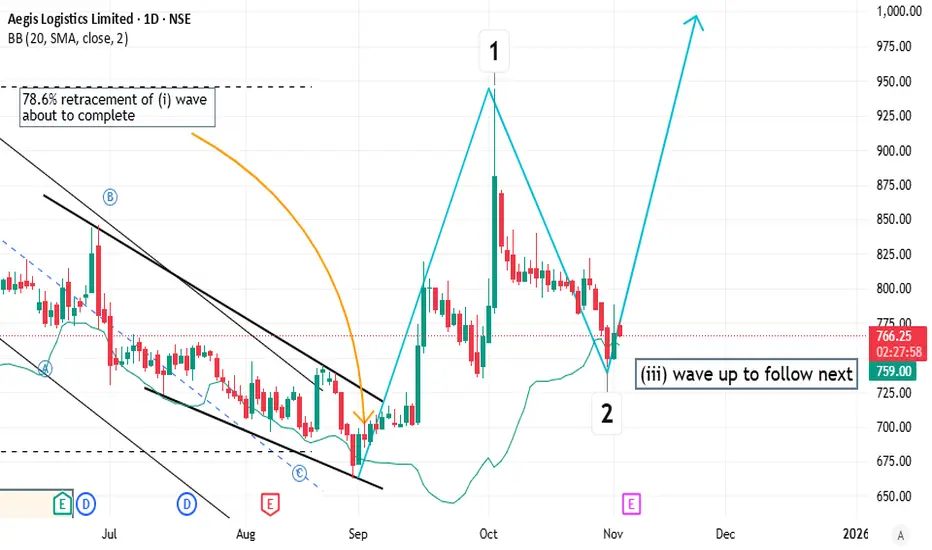
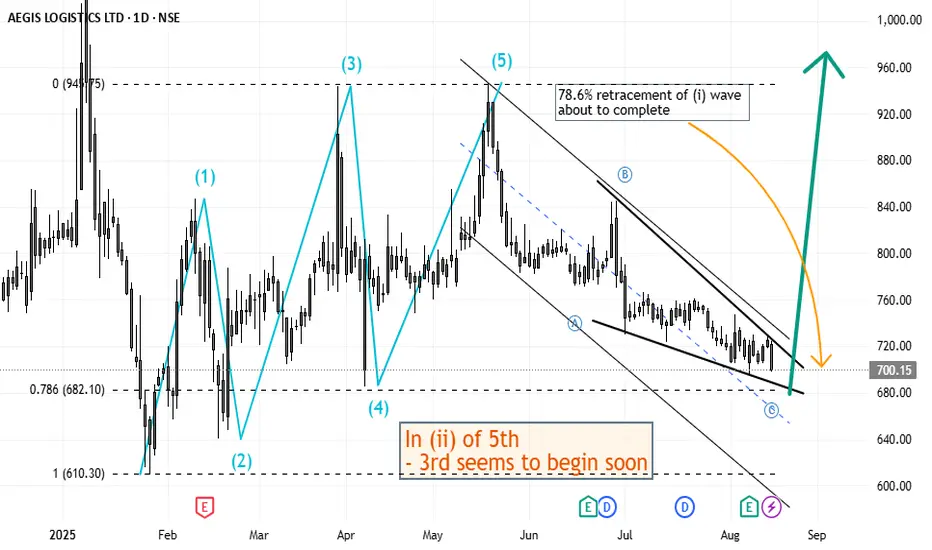
Elliott Wave Analysis of Aegis Logistics AEGISLOGThe script is doing 5th of weekly time-frame and seems to about to complete (i) of 5th with 78.6% retracement. The (i) was a diagonal impulse wave. And now in retracement, the C wave also appears to be forming an ending diagonal. After this is completed, (iii) wave should start.
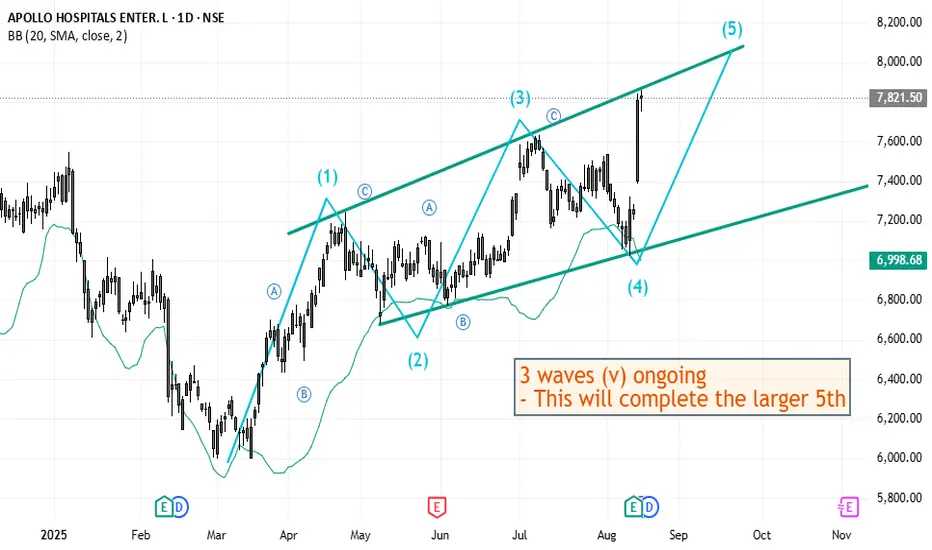
Elliott Wave Analysis of Apollo Hospitals APOLLOHOSPApollo Hospitals has been doing a diagonal and is currently in the (v) wave of the diagonal 5th. After this short term long, it appears to be followed by a bigger retracement.
CRYPTO: SOLANA (1D)Looking at Solana, I am still seeing a massive upside potential. According to my analysis, Solana is looking to complete wave (3) of wave 3 (circled). Once a clear wave 1 and 2 structure is formed within wave (3), then I can safely say that Solana will still push upwards.
Potential target for end of wave (3) of wave 3 (circled) = $379
Cycle target = $406 to $612
Invalidation = $125
