$BTC $DXY #USD #Elliottwave Buy Setup 15mtf.This count is based on my assumptions so anything can happen not a trading or financial advice just for educational purposes only kindly do your own ta thanks trade with care good luck.
Elliottwaveprojection

US DOLLAR INDEX - UpdateMy forecast on DXY is now complete.
Please see link below for original idea
If you like my ideas, please leave a like or comment below for more updates.

Wave5? $Btc #Btc $DxyThis count is based on my assumptions so anything can happen not a trading or financial advice just for educational purposes only kindly do your own ta thanks trade with care good luck.

Weekly W5 #Elliottwave Buy Setup $Btc $Dxy #Usd #Btc.This count is based on my assumptions so anything can happen not a trading or financial advice just for educational purposes only kindly do your own ta thanks trade with care good luck.

INDUSIND BANK ELLIOTT WAVE ANALYSISThis bank stock analysis is on weekly timeframe for long term value investment , the stock is showing great movement after the 2020 crash has recovered well.As shown in the chart the stock is in wave 3 of cycle degree on weekly timeframe and the wave 3 target is around 3500 in coming years.

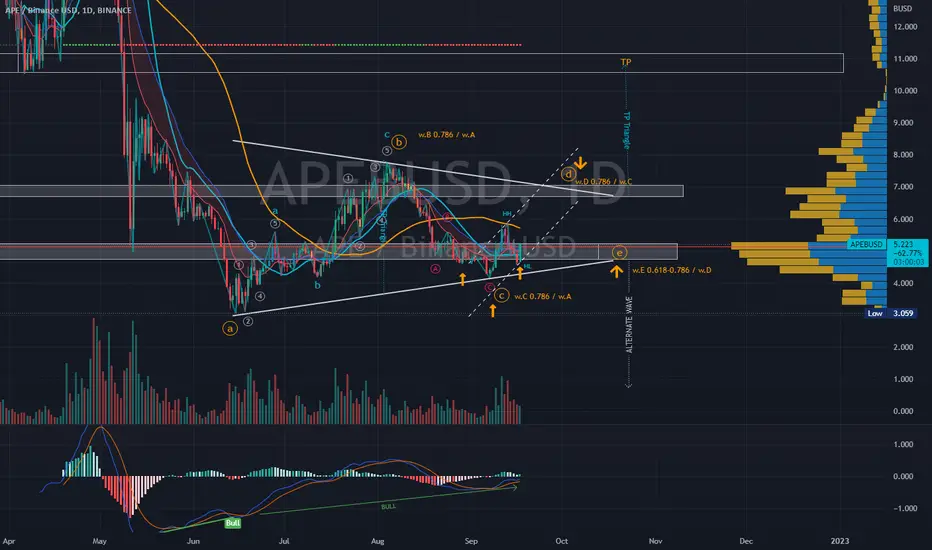
APEUSD | Wave Analysis | Bullish Triangle ABCDE ProjectionPrice action and chart pattern trading setup
> A possible upcoming bullish triangle ABCDE wave within 1-2 months
> B-wave retraced 0.786 of A-wave and recent C-wave retraced exactly 0.786 of B-wave.
> Expecting uptrend D-wave at 0.786 of C-wave with an inverted head n shoulders reversal pattern.
> Entry: head n shoulders breakout
> Target: D-wave position +30%+
> Stoploss: right shoulder -10%
> RRR: 3:1
Indicator:
> MACD above signal line just below 0.
> RSI bullish momentum rebounded from MA line
Nothing is 100%, always trade with affordable risk and respect your stoploss
$BTC #BTC $DXY #USD #Elliottwave W5 MTF.This count is based on my assumptions so anything can happen not a trading or financial advice just for educational purposes only kindly do your own ta thanks trade with care good luck.

TKN | Wave Analysis | Possible Upcoming Impulse 3-Wave ForecastPrice action and chart pattern trading setup
> Wave pattern: 2-Wave Triangle ABCDE - possible upcoming wave E before rising impulse 3 wave.
> Entry: Support level SMMA50 and SMMA20 @ 0.618 and 0.786 retracement zone
> Target: 3 -wave triangle breakout plus distance of the triangle channel 1.272 extension zone of main 1-wave +15-20%
> Stoploss: Lower triangle support zone -7-8%
> Risk reward ratio: 3:1
Always trade with affordable risk and respect your stoploss

$BTC #BTC #USD $DXY #Elliottwave Update MTF.This count is based on my assumptions so anything can happen not a trading or financial advice just for educational purposes only kindly do your own ta thanks trade with care good luck.

ATOM Elliott wave price cast attempt on ATOM elliott wave price cast considering moderate bullish sentiment, not financial advise

Next Top Is...Minor wave 1 may have finished today, slight chance of it finishing if a new low occurs shortly after the open tomorrow. For now, Minor wave 1 was 3 days. Wave 2 will likely be similar in length. Historical relationships point to a possible top around 4000.
There is not much news until the Fed so we could meander upward for a few days while we wait. I do expect Minor wave 3 to be a very sharp drop in the order of 300+ points over 3-6 days which would be fueled by a larger than expected Fed hike and/or hawkish comments afterward.
Minor wave 1 has been eventful so far, we shall see what happens next.

TATA STEEL ELLIOTT WAVE ANALYSISThe best Metal stock in Nifty 50 to invest your valuable money is Tata Steel.I t will give you the best returns in coming time more than 100 % as you can see the projected target for next third wave is 288 rupees.

USDJPY ELLIOTT WAVE ANALYSISThe pair price is traing in wave 4 of impulse shown in the chart that wave 4 pattern is double three which will end at the drawn support and pair will start wave 5 move as shown in the chart.

XAUUSD GOLD Elliott Wave AnlysisThe Gold Commodity has been moving in the Impulse pattern in the weekly timeframe.Now he gold is in the Wave 4 Double three pattern W-X-Y which will complete around 1670 and 1575 usd levels.After the end of his wave 4 correction the gold will move into a big wave 5 impulse target above 2200 usd as shown in the chart levels.

US DOLLAR Index Elliott Wave AnalysisThe USD Index on monthly chart is trading in the Impulse pattern in which the wave 5 will get completed at 113 usd level and the years long rally of usd in impulsive fashion will end and the index will enter into the big correction pattern as shown in the chart.

WTI CRUDE OIL ELLIOTT WAVE ANALYSISThe crude oil commodity has been trading in big A-B-C Flat correction for last couple of months which is going to complete very soon.Around the level of 80 usd the oil will start big Impulsive Rally.Previously oil has completed the big impulse as shown in the chart .
