Adobe: Entering the Fourth Wave — Smart Money Distribution PhaseAdobe’s stock is entering a critical structural phase — the completion of its third global impulse and the start of the fourth corrective wave.
While the long-term uptrend remains intact, the price structure and fundamentals suggest that the most explosive growth period may already be behind us.
🧭 Long-Term Technical Context
Looking back to the early 2000s, Adobe has moved through a textbook Elliott Wave structure.
The first and second waves built the base, while the third wave delivered the explosive rally — from roughly $30 to $600, marking a 20x increase.
Now, the fourth subwave of the third major wave appears to be forming — a phase typically characterized by sideways consolidation and distribution by institutional players.
🔺 Wave 4 Triangle Formation
In many long-term wave structures, the fourth wave forms a triangle (ABCDE pattern) — a contracting structure where price oscillates between defined boundaries.
We can already observe the emerging shape:
Wave A and B are complete
Wave C is in progress
Wave D and E will likely complete the pattern before the final breakout
Once the triangle ends, a final Wave 5 push could occur — potentially extending toward $700, or in an extended scenario, even $2000.
📊 Trading Range and Short-Term Strategy
At this stage, smart money tends to distribute positions gradually.
The price is oscillating within a broad corridor, providing opportunities for range-based trading:
Buy zones: near the triangle lows (Wave A area around $350)
Profit zones: near the triangle highs (Wave B area around $600)
For swing traders, this range offers multiple short-term opportunities before the next major move begins.
💵 Fundamental Context
Despite being in a late-wave structure, Adobe’s fundamentals remain strong.
Share buybacks: The company continues to repurchase its own shares, supporting EPS growth.
EPS trend: Rising steadily year over year.
Revenue growth: Stable, around +10% YoY, with quarterly metrics showing +40% growth since Q1 2024.
Forward P/E: Approximately 28, which, by Peter Lynch’s growth-to-PE logic, still appears reasonably valued.
These metrics suggest that even in a market downturn, Adobe’s downside risk may be more limited compared to weaker tech peers.
🧮 Fundamental Summary
✅ Consistent buybacks supporting EPS
✅ Double-digit annual revenue growth
✅ Attractive valuation relative to growth metrics
✅ Strong defensive profile versus the broader tech sector
There are no visible signs of fundamental weakness — only technical consolidation after years of exponential expansion.
⚠️ Alternative Scenario
If the stock breaks below $270, the current wave structure may need adjustment.
Such a move could imply a larger triangle or a flat correction, but the broader interpretation — that we’re inside a long-term Wave 4 — would remain valid.
📈 Market Outlook
Adobe is transitioning from a high-momentum growth phase into a strategic accumulation and distribution phase.
The stock is unlikely to replicate its earlier explosive rally, but it continues to offer structured trading opportunities inside a stable technical range.
For long-term investors, the risk-reward remains balanced, supported by solid fundamentals.
For traders, the triangle provides a clear framework: buy near lows, take profits near highs, and wait for the fifth wave breakout.
🧩 Summary
Price structure suggests Wave 4 triangle formation
Trading range between $350–$600
Fundamentals remain strong and defensive
Forward P/E at 28 — reasonable given EPS growth
Next major target: Wave 5 breakout toward $700–$2000
Adobe is no longer in its most explosive phase — but it’s far from weak.
This is a mature consolidation period, not a decline story.
For disciplined traders, the triangle may offer some of the cleanest swing setups in the tech sector.
Elliotwaveanalysis

SUI: SlippedSUI recently faced renewed pressure but is expected to recover soon. The magenta wave is likely to extend slightly further toward resistance at $4.57, where we anticipate this wave will peak. Afterward, a short-term correction in wave is likely before wave should drive price sustainably above the $4.57 level. A lower bottom would only become likely if support at $0.55 is breached. In that scenario, an alternative wave alt.B in turquoise would come into play, which we currently estimate has a 37% probability.

LINK: Shows Upward Momentum LINK has recently shown modest upward momentum. Under our primary scenario, we anticipate that turquoise wave 1 will push price above the resistance level at $30.95, followed by a corrective wave 2. However, if price continues to decline and falls below support at $8.25, we will expect a new wave alt.(B) low in magenta to form within our similarly colored alternative Target Zone ranging from $7.04 to $2.12 (probability: 37%).

FinVolution Group (FINV) - A Quiet Giant on the Edge of Breakout⚡ FinVolution Group (FINV) — A Quiet Giant on the Edge of Breakout
While everyone is chasing the inflated Big Tech bubble, a much quieter — and potentially far more explosive — opportunity is forming right now in the fintech and online lending space.
That opportunity is FinVolution Group (FINV) — a Chinese and Southeast Asian fintech player that looks ready to break through its 2021 highs. Once that breakout happens, the move could be massive.
🔸 Fundamentals
FinVolution has quietly turned a corner.
Recent quarters have been consistently profitable — both revenue and EPS are growing.
The most striking part?
The forward P/E ratio is just 0.7 — yes, less than one.
That’s an extraordinary valuation for a profitable fintech with expanding operations across multiple Asian markets.
It’s a risky play, no doubt, but these are exactly the kind of setups that tend to drive portfolio growth over time: low valuation, improving financials, and clear technical breakout potential.
🔸 Technical Picture
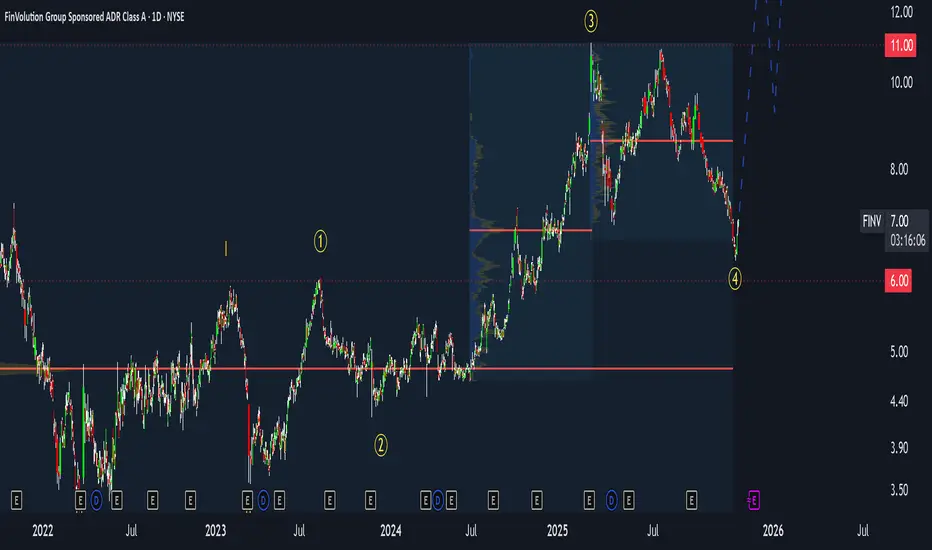
From a technical perspective, FINV is at the start of what looks like the third major wave of its long-term structure.
Since 2021, the price has been consolidating sideways — but that phase seems to be ending now.
Key resistance: $11
Current price: around $7
Breakout level: above $11 (with volume confirmation)
First targets: $20 → $30 → $40
If the price breaks below $6, the bullish scenario pauses — it doesn’t collapse, but likely extends the sideways phase.
That sets up a risk of roughly 10–15%, while the potential upside remains multiple times higher.
The risk/reward profile here is exceptionally strong.
🔸 My Strategy
I’m already positioned - entered near $7, with a stop-loss around $6.
Once we approach $11, I plan to take partial profits and watch for a breakout confirmation.
If we get a strong breakout above $11 with solid volume, that’s my next entry trigger.
Then I’ll look to add on pullbacks, applying my call stacking strategy - building exposure gradually as the trend confirms and accelerates.
🚀 Summary
FinVolution (FINV) shows a rare combination:
✅ Profitable growth
✅ Deep undervaluation
✅ Strong breakout setup
It’s one of those asymmetric opportunities — where the downside is limited, but the upside could multiply several times over.
If the $11 breakout confirms, this could easily become one of the most powerful fintech moves of the next few quarters.
⚡ Call to Action
If you like this type of setup - low-risk, high-upside plays - tap 🚀 to support the idea,
and drop a comment with tickers you’d like me to review next.
(Full technical breakdown and strategy details are discussed in my latest videos — available via my profile.)
XAUUSD 1H – EW Long SetupHi fellow traders,
On the 1H XAUUSD chart, I am applying Elliott Wave principles to outline a potential long setup. Price seems to have completed wave 4 and is reacting from the golden box area, suggesting that wave 5 may now start unfolding to the upside.
The invalidation level at 4004.72 represents my expected end of the correction, although the setup remains valid even if price moves slightly lower. My Stop Loss is set at 3940.00, which would confirm structural failure if reached. The Take Profit is positioned at 4437.36, targeting the projected completion of wave 5.
Good luck and trade safe!

Gold Elliott Wave Analysis – Potential Wave (4) Completion ZoneGold (XAU/USD) on the daily chart appears to be completing a classic Elliott Wave 5-wave impulse structure. After a strong rally into the wave (3) high, price is currently retracing toward the projected wave (4) correction zone.
The highlighted support area aligns with key Fibonacci retracement levels:
0.5 retracement: around $3,845
0.618 retracement: around $3,718
This region also coincides with the lower boundary of the ascending channel, adding confluence for potential bullish reversal.
If wave (4) finds support within this zone and maintains structure, a new impulsive rally toward wave (5) could begin — targeting the upper trendline resistance near $4,500–$4,600.

XRP: Holds Firm Ripple (XRP) managed a modest rebound following last week’s moderate sell-off. However, under our primary scenario, blue wave (iii) is expected to push prices lower once again, targeting a bottom above the turquoise long Target Zone between $1.03 and $0.38. After that, wave (iv) should prompt a corrective move to the upside before wave (v) completes the entire blue five-wave sequence within the turquoise zone, thereby concluding the larger turquoise wave B correction. Prices in this zone could present attractive long entry opportunities, as the ensuing wave C is likely to propel the altcoin above resistance at $4.09. At that level, the higher-degree magenta wave (Y) should also reach completion. If XRP breaks out directly above the $3.19 resistance, it will suggest that wave alt.B has already finished (with a 30% probability).

RELIANCE — The MONSTER WAVE 3 Isn’t Over Yet!📈 Summary:
Reliance isn’t done yet — the structure shows a powerful Wave 3 still unfolding with institutional strength behind it.
Expect a controlled Wave 4 retracement (₹800–₹500) before the next super rally — Wave 5 toward ₹10,000 (3.618%) .
📈 Elliott Wave count + SMC + Fundamentals all scream continuation!
Smart money is accumulating , not distributing — this is the calm before the storm.
🔥 Wave 3 builds wealth. Wave 5 creates history.
📊 Elliott Wave Confluence:
The stock remains within Wave 3 , unfolding with strong impulsive momentum and clean internal sub-waves.
Wave 3 is expected to mature around the 2.618 extension (~₹2,875) , but structure still supports further upside before exhaustion.
A Wave 4 correction will likely retrace toward the 0.382–0.5 Fib zone (₹800–₹500) , forming a deep yet healthy reset.
The grand finale — Wave 5 — targets the 3.618 Fibonacci extension (~₹10,000) , aligning with long-term macro growth and structural expansion. 🚀
💰 Smart Money Concept (SMC) Insight:
Institutional order flow remains bullishly displaced — no evidence of full distribution yet.
Expect Wave 4 to be the “smart money re-entry zone,” with liquidity sweeps and accumulation before the final push.
Wave 5 could trigger the euphoric phase where late retail chases and institutions start scaling out at premium valuations. 🧠💵
📈 Price Action Perspective:
Trend remains structurally bullish — higher highs and higher lows dominate.
A break above ₹1,600–₹1,700 confirms Wave 3 continuation.
Once the market consolidates into Wave 4, watch for equal lows, demand absorption, and BOS confirmations to catch early Wave 5 entries.
Wave 5 is expected to be sharp, emotional, and momentum-driven — classic of late-cycle impulsive waves. ⚙️📊
🌍 Fundamental Confluence:
Reliance’s expansion across energy, telecom, AI, green tech, and retail supports this wave count perfectly.
The next decade’s growth catalysts — digital ecosystem scale-up, Jio financial inclusion, and renewables — align with Wave 5’s “valuation explosion” narrative.
Fundamentals mirror Elliott psychology: Wave 3 = justified growth, Wave 4 = consolidation, Wave 5 = euphoria-driven expansion . 💹🌏
🔮 Expectations Ahead:
📍 Wave 3 Target: ₹2,800–₹3,000 range (2.618 fib).
⚠️ Wave 4 Retracement: ₹800–₹500 (accumulation & re-entry zone).
🚀 Wave 5 Target: ₹10,000 (3.618 extension — the ultimate cycle peak).
💎 Final Thought:
Reliance is still in the driver’s seat of its Wave 3.
Wave 4 will give patient bulls one final golden entry before Wave 5 — the ₹10,000 super cycle — rewrites market history.
Traders & Analysts
"This might be the mega move of the decade — and it’s happening right in front of us. 🔥
Reliance (RELIANCEIND) is still charging through a powerful Wave 3, and there’s plenty of air above before any major correction even begins. 🚀
Our Elliott Wave models show Wave 3 has not peaked yet — momentum, structure, and institutional flow all confirm that the current rally could still extend toward the ₹2,800–₹3,000 zone before any Wave 4 cooldown.
But here’s the big picture: after Wave 4’s healthy reset, the final Wave 5 explosion could drive prices to a massive ₹10,000 target (3.618 extension) — a potential super-cycle top years in the making. 💎
📈 Smart money isn’t exiting — it’s riding Wave 3 and preparing for the ultimate Wave 5 payoff.
Timing this phase could define your decade in trading. ⚡
So, traders — how far do you think Wave 3 can run before the big reset?
Drop your targets below 👇 and let’s see who rides this wave all the way to ₹10,000! 💰🌊”
— Team FIBCOS
#Reliance #ElliottWave #NSE #SmartMoney #PriceAction #WaveTheory #TechnicalAnalysis #TradingView #Investing #StockMarketIndia #RelianceIndustries #SwingTrading #LongTermInvesting #Wave3 #Wave5 #BullishIndia #ChartAnalysis #WealthBuilding #MarketStructure #Fibonacci #Wave4Accumulation

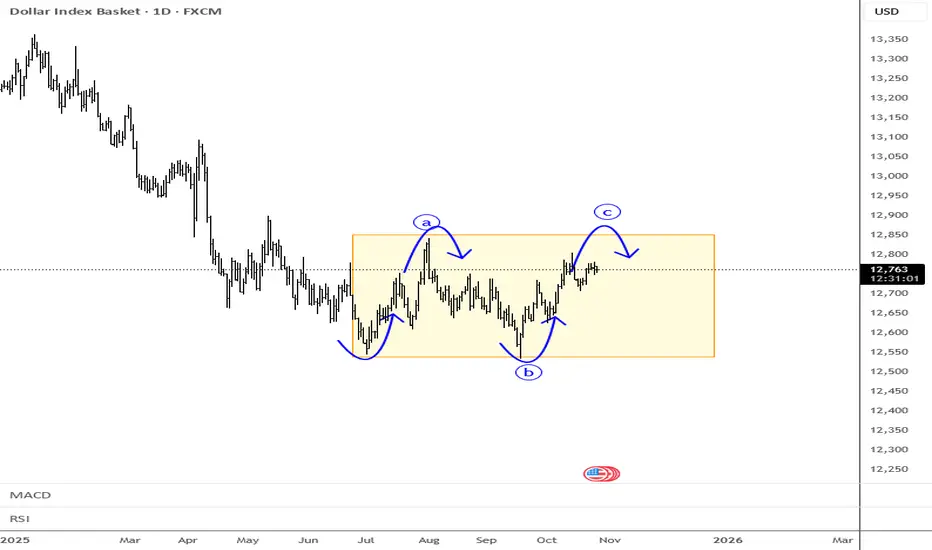
Dollar In Range-And It May Not Be Broken Soon...Stocks are pushing nicely to the upside after some optimism that a deal could be reached between the US and China regarding tariffs, as reported this weekend by Trump himself. He’s clearly driving the market into a risk-on mode.
However, it’s interesting to see that the dollar is still going nowhere; the only FX market showing a more decisive move is the Aussie, which is naturally benefiting from this story.
Looking at the dollar index, no one knows where it wants to move but basic analysis in ranges is simple; "down from resistance, up from the support".
Keep in mind we’re still missing the latest US jobs data, so the outlook for further cuts remains uncertain, and that could keep the dollar moving sideways for now.
Have a nice trading week!
GH
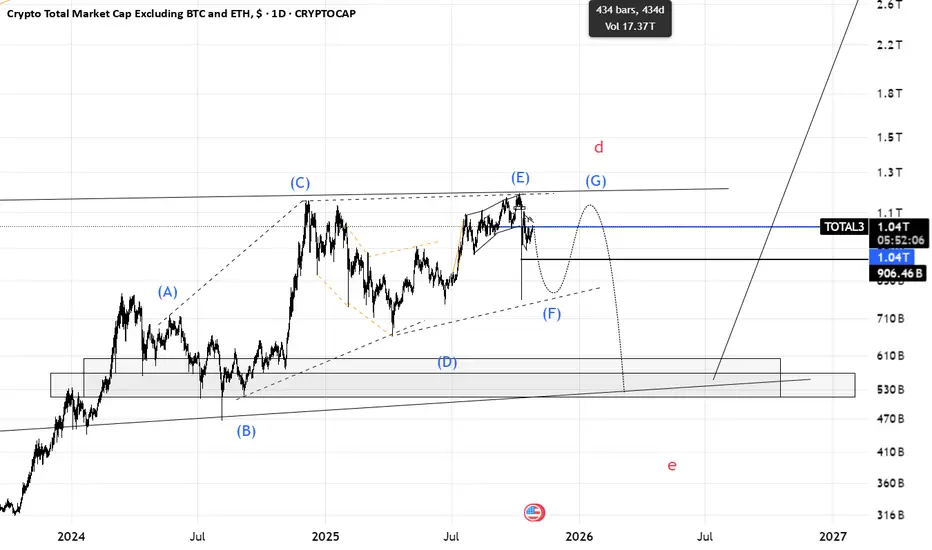
Total3(based on NEo wave)I think this branch is diametric. in last chart I thought its a triangle but its a diametric.
we should for wave F to finish and wave G to start then there is a heavy bearish wave for total3 and altcoins.
xauusd's swbig corrective :D
no clearly trend's form here
2 choices for SW -> wait and sell High , Buy low
if the price move into the zone,
then you see trend in the lower TF
follow it ! if you can :D
if you know what is a trend :(
HH HL = bull
LL LH = bear

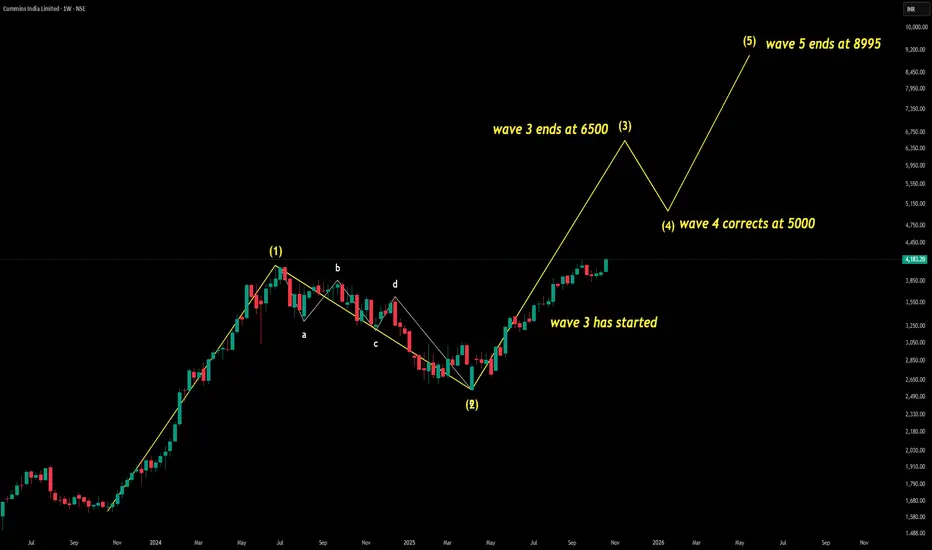
Elliot Waves showing teji in CUMMINS INDIAWave Structure Overview – Elliott Cycle Breakdown
This chart captures a full Elliott Wave impulse cycle (1–5) followed by the anticipated corrective phase (a–b–c). It reflects market psychology in motion—from early optimism to trend exhaustion.
Wave Summary:
Wave (1): Initial breakout – trend confirmation begins
Wave (2): Shallow pullback – bullish continuation
Wave (3): Ends at 6500 – strongest wave, broad participation
Wave (4): Corrects to 5000 – healthy retracement, sets up final push
Wave (5): Ends at 8995 – final rally, possible exhaustion or divergence
Wave a–b–c: Expected next – corrective structure likely
Technical Insights
Wave 3 shows classic acceleration – ideal for breakout teaching
Wave 4 respects Fibonacci zones – great for entry logic
Wave 5 overshoots – likely divergence, ideal for reversal training
Strategic Takeaways – For Traders & Students
Impulse cycle (1–5) is complete
Wave 5 has peaked at 8995 – trend exhaustion likely
What’s Next Prepare for a–b–c corrective structure
Watch for: RSI divergence
Volume drop
Fibonacci retracement zones (38.2%–61.8%)
“Wave 5 has completed at 8995. Expect a corrective a–b–c structure. Avoid fresh longs. Ideal time to teach reversal setups, divergence spotting, and Fibonacci retracement logic.”
Axis Bank Long Good RRAxis Bank if doesn't goes below 1230 can start one move upwards to 1296 to 1320.

Hellena | SPX500 (4H): LONG to resistance area of 6777.Price made a sharp and strong move to the 6503 level, making wave “4” quite large, but this move did not break the structure.
I think that now the price is in the big wave "5" and middle wave "2".
I think that there will be an upward movement with the purpose to renew the maximum of the wave "3" of higher order.
Therefore, I expect the price in the resistance area of 6777.
Fundamental context
After the sharp drop, the market quickly recovered — investors are once again turning to risk assets amid growing expectations of upcoming Fed rate cuts.
Inflation data came out under control, and corporate earnings have been stronger than expected, boosting confidence in the U.S. economy.
With the dollar losing momentum and bond yields easing, the S&P 500 now has room to extend its move upward toward the resistance area near 6777.
Manage your capital correctly and competently! Only enter trades based on reliable patterns!

Apple: New All-Time High as Low Is Adjusted Apple has recently seen a period of heightened volatility, marked by sharp gains and notable pullbacks. In response to the latest price action, we’ve made a slight adjustment to our wave count and revised the low for magenta wave (4). We’re now allowing for magenta wave (5) to break above the $260.10 resistance level, which would complete green wave . Our alternative scenario, which carries a 34% probability, still calls for a new corrective low in blue wave alt.(IV). In this case, Apple would have just finished beige wave alt.b slightly above $260.10 and would next decline in wave alt.c, falling below support at $212.94. Even so, the alternative corrective low would remain above the $168 level.

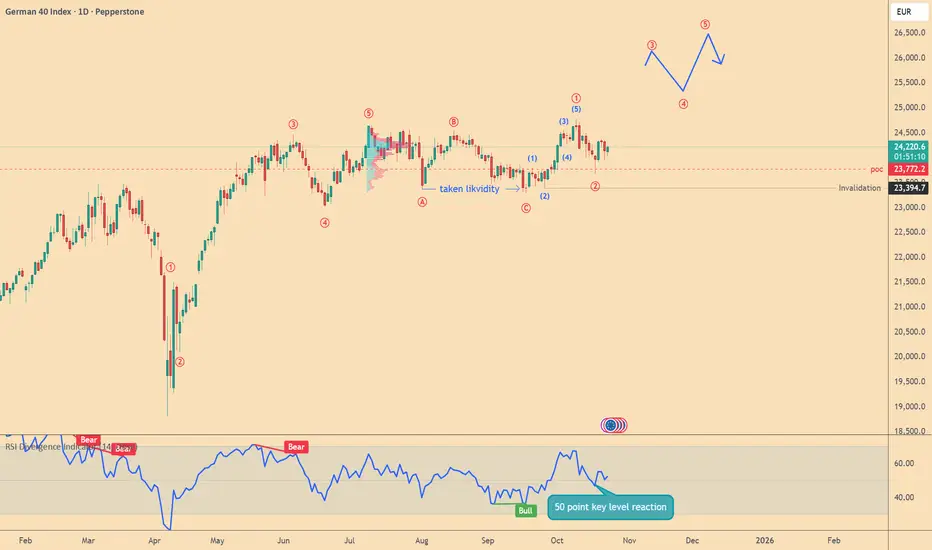
DAX/GER40, technical analysis 1DHello traders,
We bring you another important technical analysis on the DAX index.
We can see that according to Elliott Wave theory we have completed corrective ABC structure, also taken liquidity and started the bullish 12345 structure in smaller timeframe as u can see on the chart.
So the next outlook is that the value of the DAX index will increase.
But be careful!
It is necessary to respect the invalidation level in this case.
We also have to take into account the war in Ukraine, all of President Trump's statements, interest rates, and other stimuli that can change the market instantly!
WavePulse
Bitcoin - BTCUSDT – Daily NeoWave AnalysisStructure: Contracting Triangle (ABCDE)
Current Price: $108,985 (+1.3%)
🧠 Wave Structure Overview
Bitcoin’s daily chart is forming a Contracting Triangle pattern under NeoWave principles (Glen Neely).
This triangle appears to be part of a wave (4) correction within a larger impulsive cycle, consisting of subwaves A–B–C–D–E with well-balanced price and time proportions.
🔹 Wave Details
Wave A: Decline from 126K → 104K
Type: Impulsive start, setting the corrective tone.
Wave B: Sharp recovery to 123K (≈78.6% retrace of A)
Type: Zigzag – strong bullish response typical for triangles.
Wave C: Pullback to 106K, forming a 3-wave Flat correction.
Wave D: Rally to 118–119K, reaching 70% of wave B — perfectly proportional for a contracting structure.
Wave E: Final leg down toward 106K–107K, with diminishing momentum and volume — a textbook NeoWave E-wave behavior signaling triangle completion.
🔍 Technical Observations
Strong bullish divergence between price and RSI/OBV at the E-wave low.
Decreasing volume during wave E → confirms a terminal corrective phase.
Price remains above the long-term rising trendline and key demand zone near 106K.
🟢 Primary Scenario (≈70% Probability)
Triangle completed at E-wave (106K) → beginning of wave (5) to the upside.
Targets:
1️⃣ 115K–118K – short-term breakout zone
2️⃣ 123K–126K – retest of triangle resistance
3️⃣ 138K–145K – extended target if wave (5) unfolds impulsively
🔴 Alternative Scenario (≈30% Probability)
If BTC breaks below 106K, wave E may extend deeper toward 102K–100K, forming a Running Triangle E before a strong bullish reversal.
⚙️ Summary
✅ Current pattern: Contracting Triangle (ABCDE)
✅ Position: End of wave E of (4)
📈 Expectation: Start of wave (5) impulsive advance
⚠️ Invalidation: Daily close below 102K
Conclusion:
BTC is likely completing a major corrective phase. Holding above 106K keeps the bullish breakout scenario valid — watch for a decisive move above 111K–112K to confirm the next impulsive leg.

Hellena | GOLD (4H): LONG to 61.8% Fibo of 4265.Dear colleagues, in the new forecast the idea remains the same - the upward momentum (12345) is not yet complete.
At the moment I see the end of the formation of the corrective wave “4” at the level of 4000, as stated earlier, and the beginning of the upward movement in wave “5”.
I do not want to set distant targets, because their achievement may take time, so let's start small - the nearest target is the resistance area at 4265 - the area beyond the 61.8% level of wave “4”. I think that this is the nearest target that we should expect.
Fundamental context
Earlier this week, gold experienced a sharp pull-back after its recent record highs. Nothing to panic about — it’s simply a technical correction: investors are taking profits after a rapid and extended rally. Key drivers like central bank buying and lower rate expectations remain intact, so the broader bullish story is still alive. In fact, this brief dip may offer a better entry point before the next leg up.
Manage your capital correctly and competently! Only enter trades based on reliable patterns!

Netflix: Key Support Zone in sightNetflix shares have continued to decline since our last update. We have now provided additional detail on the ongoing turquoise wave 4, which is subdivided into a magenta three-part structure. Within this structure, wave is expected to push price further down into the turquoise Target Zone, between $962.77 and $845.22. The low point of the larger wave 4 is anticipated within this range. Only after reaching this level should wave 5 drive price back above the $1,341 mark. As such, the turquoise Target Zone presents long entry opportunities, which can be protected with a stop set 1% below the lower boundary of the zone. However, if price rises directly above the aforementioned resistance at $1,341, our alternative scenario would be triggered, and we would initially need to prepare for a higher wave alt.3 top (probability: 30%).

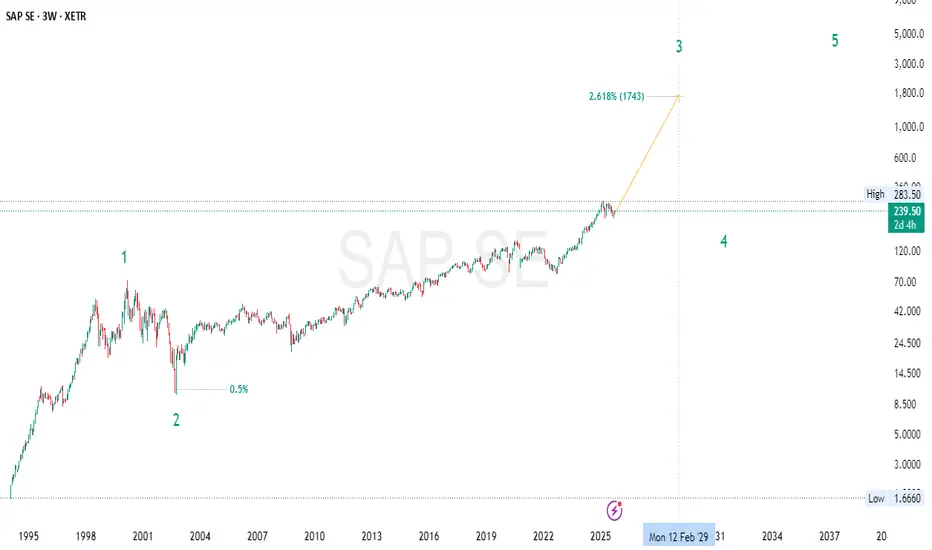
SAP SE – Wave 3 Macro Rally in Progress🚀 SAP SE – Wave 3 Macro Rally in Progress | Fibonacci Targets & Institutional Accumulation in Play 💼
📅 Timeframe : 3W (Macro Outlook)
📍 Current Price: 238.85
🎯 Wave 3 Target: ~1743 (2.618 Fibonacci Extension)
📊 Wave Structure & Elliott Theory
SAP SE appears to be mid-way through a major Elliott Wave cycle , where:
Wave 1 formed during the late 90s tech boom 📈
Wave 2 brought a deep correction post-2000 crash, respecting the 0.5 Fibonacci retracement
Wave 3 now underway, projected toward the 2.618 extension at ~1743 , suggesting a strong impulsive leg fueled by fundamentals and institutional accumulation
Wave 4 and 5 to come, but we are early in the Wave 3 journey – historically the most powerful wave in terms of price growth and investor sentiment ⚡
🧠 Smart Money Concepts (SMC)
✅ Reaccumulation Range: After an extended period of sideways price action (2001–2019), the chart shows clear signs of Smart Money accumulation – long-term positioning by institutions.
📈 Break of Structure (BOS): Clean break above prior macro highs indicates the end of reaccumulation and the start of a markup phase . This aligns with the SMC concept of entering trades after BOS and mitigation of supply zones.
📦 Liquidity Grab: Previous dips served to collect liquidity before major impulsive moves – a classic institutional playbook.
📐 Fibonacci Confluence
🔹 0.5 Retracement from Wave 1 → Wave 2 provided a textbook correction
🔹 2.618 Extension from Wave 1–2 projects a long-term Wave 3 target of ~1743 , giving this move macro-level significance
🔹 No visible divergence yet – momentum is supporting continuation 🌀
🔎 Price Action
Higher Highs & Higher Lows structure confirmed on multi-year view 📶
Strong bullish candles breaking historical resistances
No major supply zones overhead on the macro chart until much higher levels – suggests room for exponential upside
Pullbacks remain shallow, indicating strong buy-side pressure
🧾 Fundamental Outlook
SAP SE is Europe’s largest software company and a global ERP leader. It’s undergoing a digital transformation into cloud-based SaaS, improving recurring revenue and margins. 💻☁️
Strong balance sheet
Growing enterprise customer base
Cloud revenue growing YoY
Excellent positioning in AI and digital infrastructure themes going forward 🔮
Fundamentals support a multi-year bullish cycle , aligning perfectly with the current Wave 3 structure.
📌 Conclusion:
SAP is entering a potentially parabolic phase as part of a long-term Wave 3 impulse, supported by:
📈 Elliott Wave alignment
🔁 Institutional reaccumulation (SMC)
🔍 Strong technical structure & price action
📐 Fibonacci confluence
💼 Solid fundamental trajectory
As long as price holds above previous structure highs and no macroeconomic shock disrupts the tech cycle, SAP could be heading for an exponential breakout over the coming years.
⚠️ Disclaimer: This is not financial advice. For educational purposes only. Always manage risk and use proper position sizing. 🛡️
#SAP #SAPSE #ElliottWave #WaveAnalysis #Fibonacci #SmartMoney #PriceAction #LongTermInvestment #SwingTrading #TechnicalAnalysis #BullishSetup #MacroView #FibonacciExtensions #StockMarket #TradingStrategy #InstitutionalTrading #Breakout #Reaccumulation #ChartPattern #Fundamentals
Hellena | GOLD (4H): SHORT to support area of 4040.Gold is actively rising and I believe that before the impulse ends we should see the correction that many are expecting.
As of today, I see the completion of the higher order wave “3” and the approaching start of the correction in wave “4”. It makes no sense to put any distant plans in the correction and I think that the support area of 4040 looks quite attractive.
Fundamental context
Gold continues its rally and recently broke new highs, fueled by expectations of U.S. rate cuts, global uncertainty, and safe-haven demand. Central banks are still actively increasing their gold reserves — this structural demand adds support even if price pullbacks occur.
Supply growth is modest — mining output is constrained, and recycling of gold is not enough, which limits the downward pressure on prices.
Given this backdrop, the chance of a correction rises as momentum stretches — but the underlying fundamentals remain favorable for further upside once the correction completes.
Manage your capital correctly and competently! Only enter trades based on reliable patterns!

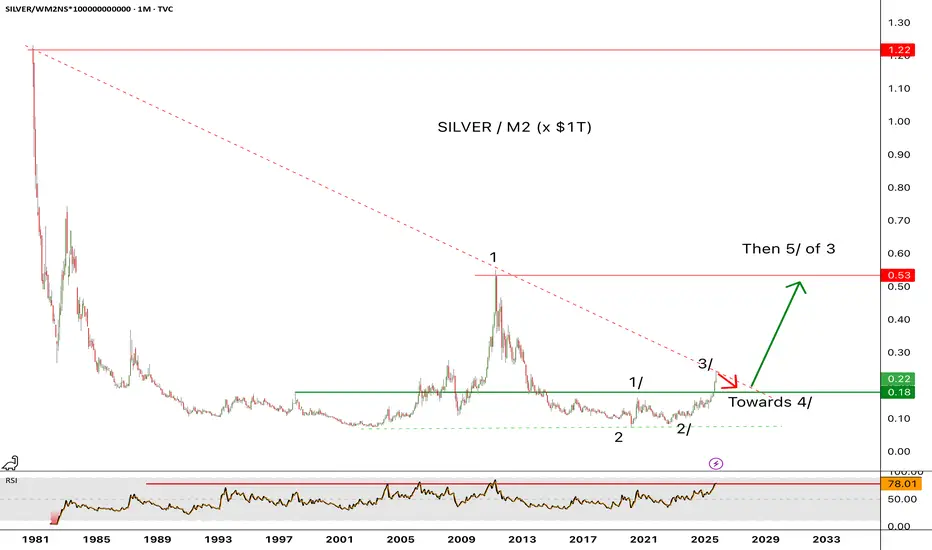
The ratio of Silver / M2 reached an important resistanceThe ratio of Silver / M2 (x$1T) has reached an important resistance last Thursday. It also reached rare overbought condition (see the monthly RSI14 at the 78 resistance area). It is now due for a consolidation phase, support seen near 0.18 (implying a pullback of about 18% to $44 from the recent high of $54 on silver. This could take a few months (normally, but who knows) before exploding above the down trend line towards the 0.53 area. In summary, the rise of silver has just started.
AMD: Wave [iv] Low AMD shares have recently gained upward momentum as anticipated, confirming the low of wave in magenta. In light of this, we have added a new resistance level at $223.50 to the chart. The primary outlook is for the stock to continue completing the magenta five-wave sequence to the upside, thereby finishing the larger magenta wave (1). Afterward, wave (2) is expected to pull price back toward support at $164.53. Alternatively, AMD could see a direct sell-off, which would bring the alternative wave alt.(2) to an early conclusion. In this scenario, wave alt.(1) would already be complete, with a probability of 27%.
