Gold w3 top? Elliott Wave Analysis yearlyThis count is based on my assumptions so anything can happen not a trading or financial advice just for educational purposes only kindly do your own ta thanks trade with care good luck.
Elliotwaveanalysis

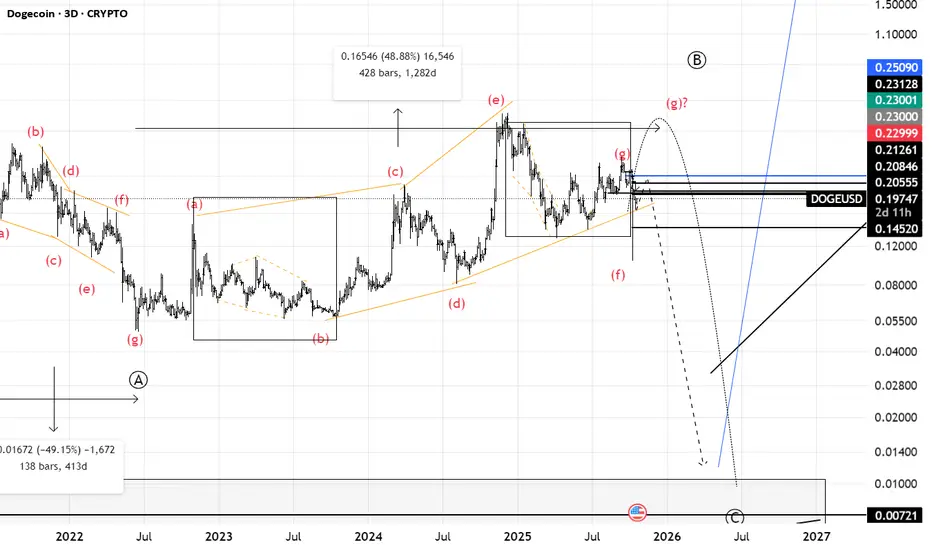
Doge(based on NEo wave)I think Its gonna be a flat and some how we will see a very strong bearish wave to 0.01$!
I dont see any bullish waves for long terms.
Bitcoin 4H Elliott Wave & Fibonacci ZonesThis 4-hour Bitcoin (BTCUSD) chart zooms in on the late-stage corrective action following a major Elliott Wave impulse completion. The complex WXY corrective structure appears to be near resolution, approaching key Fibonacci retracement zones from the prior wave sequence.
Elliott Wave & Fibonacci Confluence: The chart traces the final decline wave (Y) reaching just above the 23.6% retracement at $106,563, a critical technical confluence area where sellers have gained momentum. If support fails here, the next focus shifts downward toward the 38.2% ($95,604) and deeper retracement levels for potential stabilization.
Momentum & Indicators: RSI is nearing oversold levels on this timeframe, signaling that momentum may be waning and a reversal could be imminent. MACD and volume show signs of diminishing selling pressure, consistent with a corrective leg approaching exhaustion.
Trading Outlook: This 4-hour timeframe highlights a tightening short-term balance between sellers and prospective buyers, setting the stage for either a continued drop to stronger support zones or a base formation preceding a renewed bullish impulse. Traders should closely monitor price reactions at Fibonacci support, as these areas historically mark accumulation zones and inflection points in Bitcoin’s macro cycles.
This analysis serves as an update to our prior weekly outlook, zooming in to actionable price levels for tactical entry or risk management in anticipation of Bitcoin’s next significant directional move.

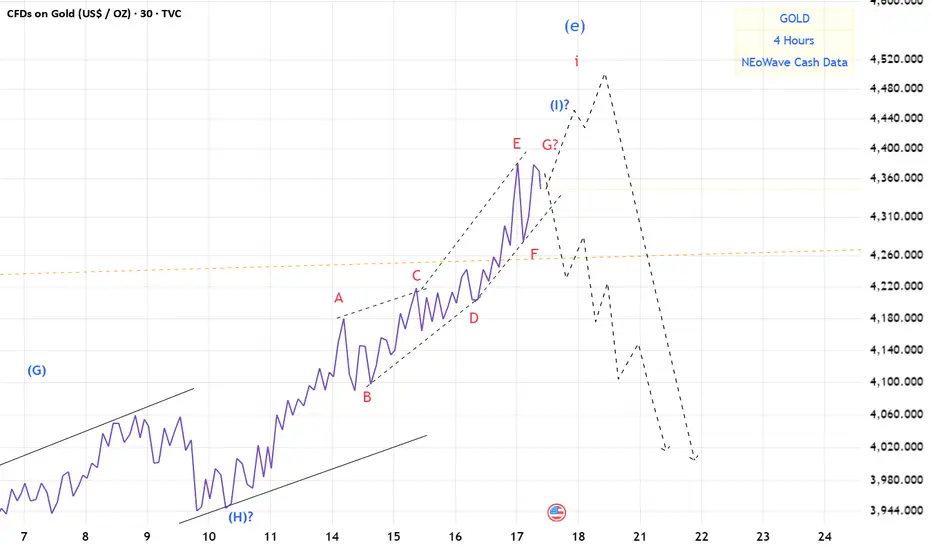
Gold(based on NEo wave)maybe here is the end of wave i.
based on Dow theory good news on top.
crazy people are buying gold.
I think soon we will see crash of gold.
market will not be bullish forever.
Hellena | Oil (4H): SHORT to support area of 56-57.Colleagues, price is actively moving in a downward direction and I believe the move is not yet complete.
Earlier I saw this move as a big correction, but now the structure is more of an impulsive one. This means that the price is moving in the wave “3” of the higher order (Red), which should be completed soon.
For this to happen, the price needs to complete the correction in the wave “4” of medium order and then update the low, reaching the support area of 56-57.
The extension of wave “3” is possible - then the price will reach the target without correction.
Fundamental context
Global oil inventories are forecast to rise through 2025, putting downward pressure on prices despite efforts by some producers to restrain output.
OPEC+ has been increasing production again, which adds to the supply burden.
Meanwhile, demand forecasts have been trimmed amid softer economic growth indicators in key consuming regions.
Major banks have lowered long-term price expectations for crude — the balance is tilting toward a more bearish outlook.
Manage your capital correctly and competently! Only enter trades based on reliable patterns!

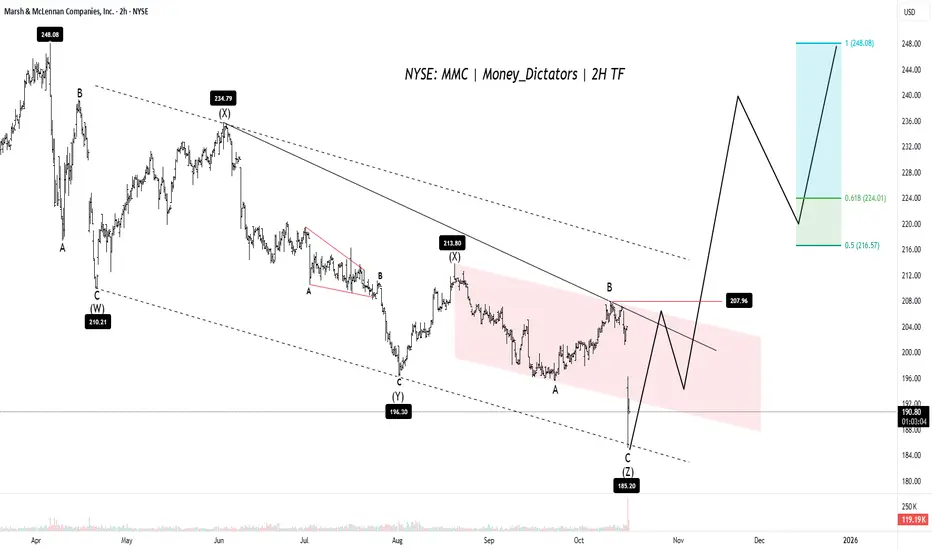
What Should You Expect From MMC?MMC is nearing the end of a recent price drop. The price is currently in its final downward phase, expected to bottom out around $184 to $186. Targets are 219, 234 & 245. Bulls can take control at wave B point(Resistance - $207).
If the price successfully holds above this $184–$186 support, the analysis predicts it will trigger a new, major upward trend. To officially confirm that the correction is over and a strong bullish trend has begun, the stock needs to break out above the $207 to $210 level. Once that breakout happens, the price is expected to rise sharply, potentially hitting the previous high of $248.
However, if the price drops below $184, this positive outlook will be invalidated, and the stock is expected to continue its downward correction.
Stay Tuned! Thank you:)
@Money_Dictators
M
MSTR: Trend ContinuesSince our last update, MSTR extended its sell-off. We still expect the low of this wave to form above the support level at $153.49. Once wave 2 is complete, we anticipate a strong wave 3 rally pushing above resistance at $674.18. Our alternative scenario assumes a different wave count: in this case, price may currently be developing the magenta wave alt. to the upside (probability: 30%). This count would be confirmed by a direct move above resistance at $430.50.

Hellena | EUR/USD (4H): LONG to the resistance area 1.16827.Colleagues, the recent continuation of the downtrend has made me reevaluate my wave analysis a bit.
If everything is correct, we are now witnessing a correction - triangle (ABCDE).
In this case, wave “C” should not update the minimum of wave “A”. This means that I expect the upward movement to start either from the current values or after the correction is completed around 1.14876.
Then I expect the beginning of the upward movement at least to the resistance area of 1.16827 - the middle line of the triangle.
Fundamental context
The U.S. dollar is showing signs of weakness — recent labor data came out softer than expected, and markets continue to price in further Fed rate cuts. This reduces demand for the dollar as a safe-haven asset.
At the same time, the ECB is likely to keep its current policy unchanged, as there’s limited room for additional easing. That gives the euro a slight fundamental advantage.
Manage your capital correctly and competently! Only enter trades based on reliable patterns!

My analysis so far for BTCEven though I think that wick of destruction, isn’t valid. But it might help me to create a 5 wave pattern.

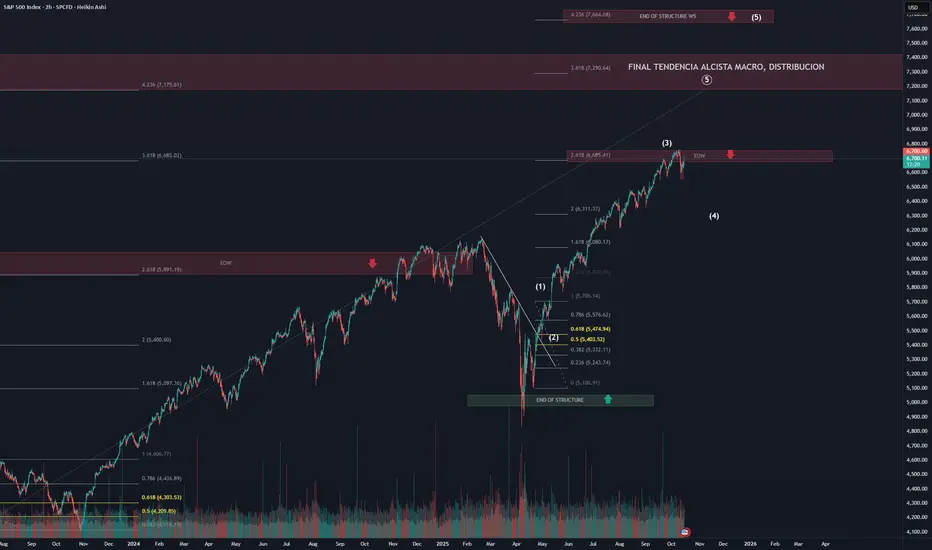
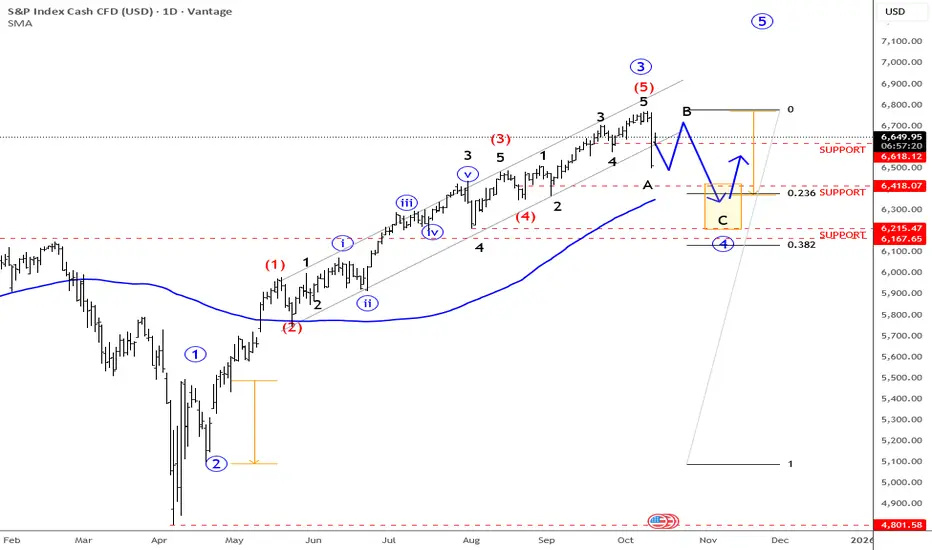
SPX Bullish Trend / Elliot analysisOur analysis of this index suggests that we are currently in the development of a Wave 4 (W4) within the last bullish substructure of the macro fifth wave, where, in the long term, we could potentially see the end of the trend between the 7100 and 7600 levels.
At the moment, the price appears to be moving within the final substructure, which seems about to begin a Wave 4 (W4) correction.
💡 This is just my opinion — always remember to do your own analysis!
USDJPY- Do Not Ignore The Gaps And US Yields USDJPY has seen a nice recovery in the last few weeks, but prices are coming out of a previous triangle formation in wave B, meaning the upside could be limited within wave C. Especialyl fi we also conider that recovery from 2025 lows is coming into important 61-78.6% Fib area, where recently bulls slowe down a bit.
We are already seeing some reversal, so it wouldn’t be a surprise to see some new leg down in xxx/JPY pairs too. Also keep in mind there are still some big unfilled gaps, and we can also see one at 149.20 on USDJPY, which could act as a magnet zone in the weeks ahead.
Its important to add at US yields are coming down, as investors moves into treasuries after recent stocks crash, and this can keep JPY supported.
GH

Airbnb: Correction still in playAirbnb has continued to move in line with our expectations since our last update, steadily approaching support at $108.60. We anticipate that price will break below this level during the ongoing turquoise wave 3 and will not reclaim it during the subsequent wave 4 rebound. In wave 5, we expect another leg lower to ultimately complete the broader correction of beige wave II.

Hellena | GOLD (4H): LONG to resistance area of 4104.Colleagues, gold is going up steadily and right now it is hard to say where the correction will be. If we look at the wave structure, I expect the completion of the higher order wave “3” and the middle order wave ‘5’. because wave “5” completes the impulse - it complicates the concept of where exactly this wave will end. I think the psychological level of 4100-4105 is suitable for this target.
I expect the price to reach the 4104 resistance area.
Fundamental context
Gold recently broke above $4,000, driven by strong safe-haven demand amid global uncertainty and expectations of U.S. rate cuts.
Central banks continue to accumulate gold, supporting demand structurally.
Deutsche Bank raised its 2026 target to $4,000, citing a weak dollar and sustained global demand.
Given the strength and stretched momentum, a pullback is plausible — but the exact timing remains unclear.
Manage your capital correctly and competently! Only enter trades based on reliable patterns!

S&P500: Rebound Offers Relief, But Downtrend Likely to ContinueThe S&P 500 managed to recover somewhat, which helped to partially offset the recent sell-offs. However, we continue to expect the ongoing wave (4) in magenta to extend further to the downside. We anticipate that the low of this wave will be reached within the similarly colored long Target Zone (6,055 points – 5,822 points), before a new upward move begins that should push the index above resistance at 6,812 points. At that level, the magenta five-wave sequence should be completed, and the high of the higher-level wave (III) in blue should be established. Given recent price action, we have added a bearish alternative scenario to the chart. This scenario suggests that the most recent high has already marked the end of the large wave alt.(III) in blue, and that the index has since entered the corrective wave alt.(IV) . If support at 5,528 points is breached, this scenario will be triggered. Long positions within the magenta Target Zone could therefore be protected with a stop set 1% below the lower edge of the zone to limit risk.

SP500: Breaks Out Of Channel, Steps Into Wave Four I hope you had a nice weekend despite that nasty turn lower on stocks we saw on Friday. As you know, the move came after Trump threatened to impose new tariffs on China, following China’s own restrictions and tighter export controls on rare earth metals, which are crucial for the tech sector. We’ve seen this story before back in April, and if tariffs come back into focus again, traders will likely react with fear — so it’s not a surprise we saw such a strong drop in stocks on Friday.
Normally, markets are most sensitive when this kind of news first hits, and then they tend to stabilize afterward. What’s interesting, though, is that despite the strong sell-off in stocks, the dollar index didn’t show the kind of sharp upside reaction you’d usually expect. So I’m wondering if stocks can find some support, but seems like this can be only wave B rally, since we are in the middle of wave four retracement. Keep in mind there is an open gap lower on futures.
Big supports is at 6400 and 6200.
Grega
Hellena | Oil (4H): SHORT to support area of 58.884Colleagues, it appears that the downward movement is not over and I see several reasons to continue to look short.
The higher order wave “C” is looking to complete the correction and I expect the start of the middle order wave “3” to see the low update and reach the support area at 58.884.
Fundamental context
Oil remains under pressure as supply increases and demand outlook weakens. OPEC+ decided to slightly raise output for November, while U.S. inventories keep growing. Crude lost about 8% last week, and EIA now expects lower prices by the end of the year — all of which supports the idea of a continued downside move within wave “3” toward the 58.884 support area.
Manage your capital correctly and competently! Only enter trades based on reliable patterns!

Hellena | SPX500 (4H): SHORT to support area of 6646 .Colleagues, in the last forecast I was counting on price reaching the 6550 area, but that plan turned out to be a long term plan. I see the sense in making some shorter term targets.
The closest target I see is the 6646 support area, where wave “4” ends. This is a corrective movement, so it is necessary to realize that the price may continue to fall after reaching the target.
Fundamental context
U.S. inflation remains elevated — CPI rose to about 2.9 % YoY, with core inflation around 3.1 %. At the same time, the labor market continues to cool, and corporate earnings show mixed results. Combined with the Fed’s cautious stance and ongoing fiscal uncertainty, this creates pressure on the stock market.
Manage your capital correctly and competently! Only enter trades based on reliable patterns!

GOLD: Risk of ABC Correction Wave, Short-term Sell at 4028LiamTrading – GOLD: Risk of ABC Correction Wave, Short-term Sell at 4028
Hello traders,
Gold has had an impressive growth week, but as prices hit new highs, the risk of correction always increases. Let's examine this week's Gold scenario based on wave analysis and market liquidity.
📊 Technical Analysis (Chart H4 – XAUUSD)
Based on the H4 chart, Gold (GOLD) seems to have completed the Push Wave 5 (Elliott Wave 5) in the current uptrend cycle, reaching strong resistance around 4050–4060.
Current Structure:
The price is within a sustainable Uptrend Channel.
The 4050–4060 range is a significant resistance where selling pressure may emerge.
An ABC correction wave scenario appears after completing Wave 5.
Key Liquidity Zones:
Potential Resistance Zone (Sell Wave C): Around 4028–4033 (Price area to watch for the reaction of the final Wave C).
Confirmed Drop Support Zone: 3972 (Critical price area confirming if selling pressure is strong enough).
Attractive Buy Zone: 3976 (Temporary liquidity if price corrects, waiting for Breakout confirmation).
Long-term Buy Zone (POC Buy): ~3850 (Price area with a huge Volume Profile, ideal for long-term buy orders).
🎯 New Week Trading Scenario
📉 Short-term Sell
This scenario is based on the expectation of an ABC correction wave starting from the resistance zone.
📍 Entry: 4033
🛑 SL: 4040 (Very tight SL, suitable for short-term Sell strategy at the wave peak)
🎯 TP: 3976 → 3943 → POC (~3850)
📈 Long-term Buy
This setup waits for a correction to lower liquidity zones to enter Buy orders with optimal R:R ratio.
📍 Entry: 3976 (Temporary liquidity buy zone)
🛑 SL: 3970
🎯 TP: 4040 → 4090 → 4150
🛑 Failure Scenario (Wait for Breakout Confirmation)
If the price breaks the 4060 peak and creates a new ATH (All-Time High), the ABC wave scenario will fail.
Action: Continue to prioritize Buying. The best entry is to wait for the price to retest the broken liquidity zone (Breakout Retest) around 3976.
🧭 Fundamental & Long-term Analysis
Macroeconomic Sentiment: The Royal Bank of Canada (RBC) forecasts Gold to rise to $4,500 in the next two years, bolstered by long-term inflation concerns. This confirms the long-term uptrend of Gold remains intact.
US Dollar Impact (USD): The traditional view is that USD rises as investors seek liquidity during market stress. However, Gold's rise alongside USD shows the market prioritizes gold as an inflation hedge rather than just a safe haven.
Long-term Strategy: The buy zone at POC (~3850) according to Volume Profile is extremely suitable. Large liquidity here will help traders enter optimal orders and hold long-term, leveraging the pressure from the Seller's Liquidity to push prices up.
📌 Conclusion
Gold is at a critical crossroads. Although the long-term trend is up, the short-term correction risk (ABC Wave) at the 4028–4033 zone is very high.
Priority: Watch for short-term sells at the resistance zone with a tight SL.
Safe strategy: Wait to Buy at liquidity support zones like 3976 or POC (~3850) to optimize risk/reward (R:R).
I will continue to update Gold scenarios daily with insights from 8 years of trading experience.
👉 Follow me to not miss important updates!

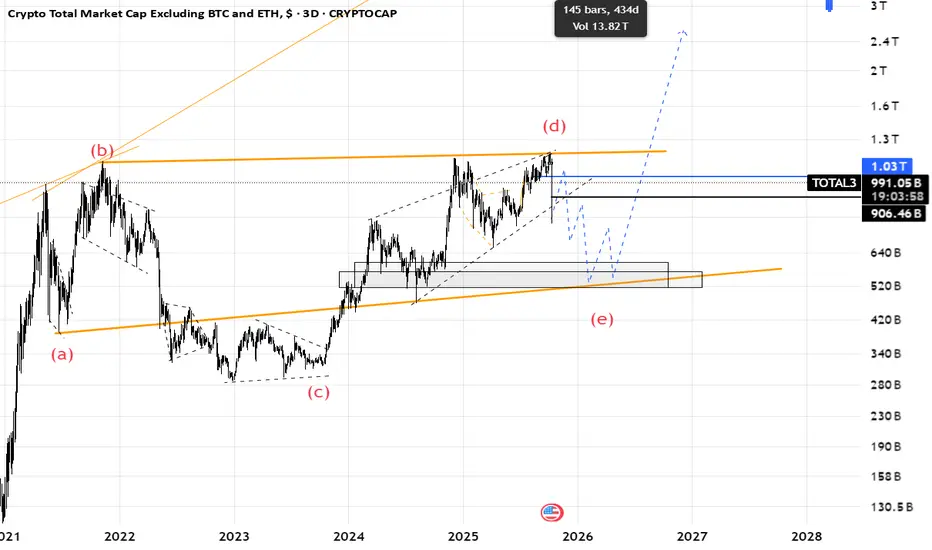
Total3(based on NEo wave)I thought wave (e) is finised but I was wrong.
now I think its the start of wave (e) and we should afraid of altcoins.
when wave (e) is finished altcoins will start to pump.
every upward is a chance to sell.
there is another scenario that I will share it on next post.
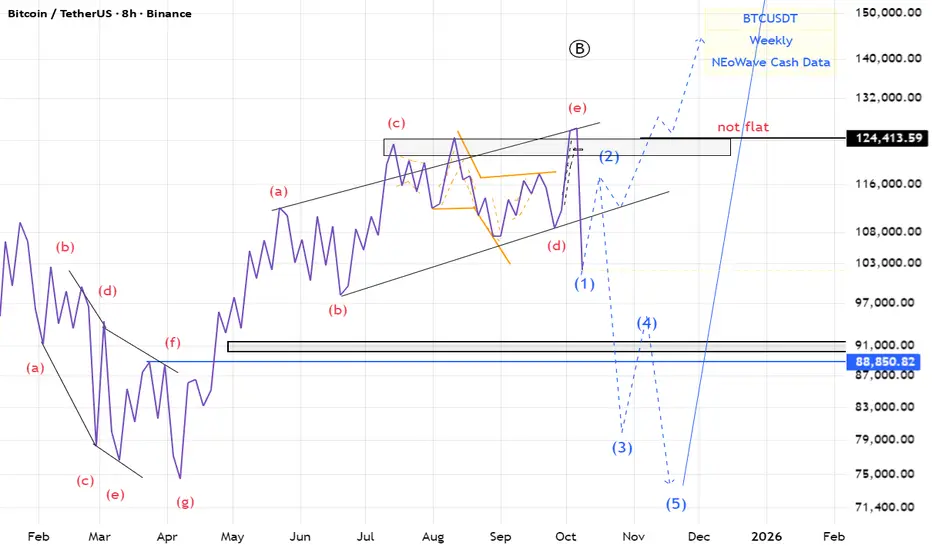
BTC(based on NEo wave)there is a good possibility for the irregular flat.
I think 2-3 month we will see the red market
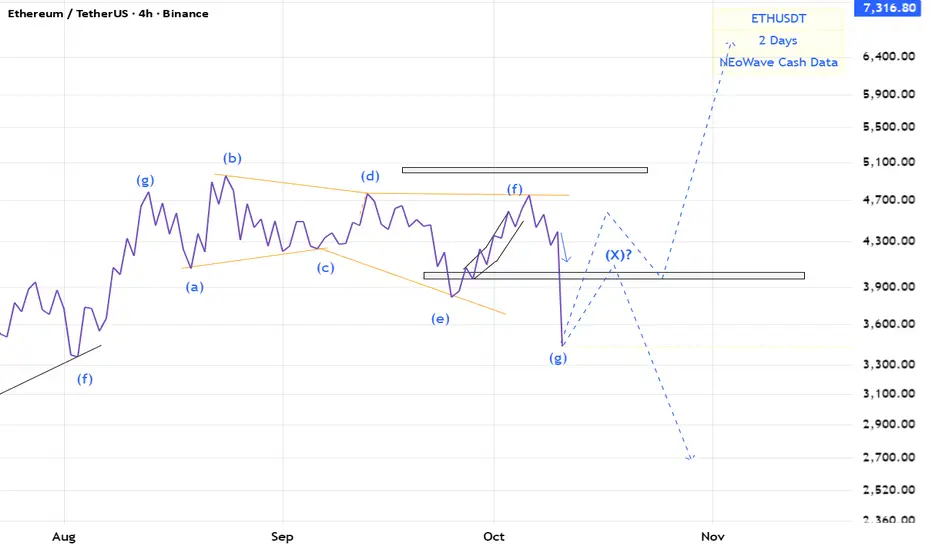
ETH(based on NEo wave)stop loss touched and now there are 2 ways for eth.
we need a post pattern confirmation for bullish wave.
or there is an x wave an correction stills go on.
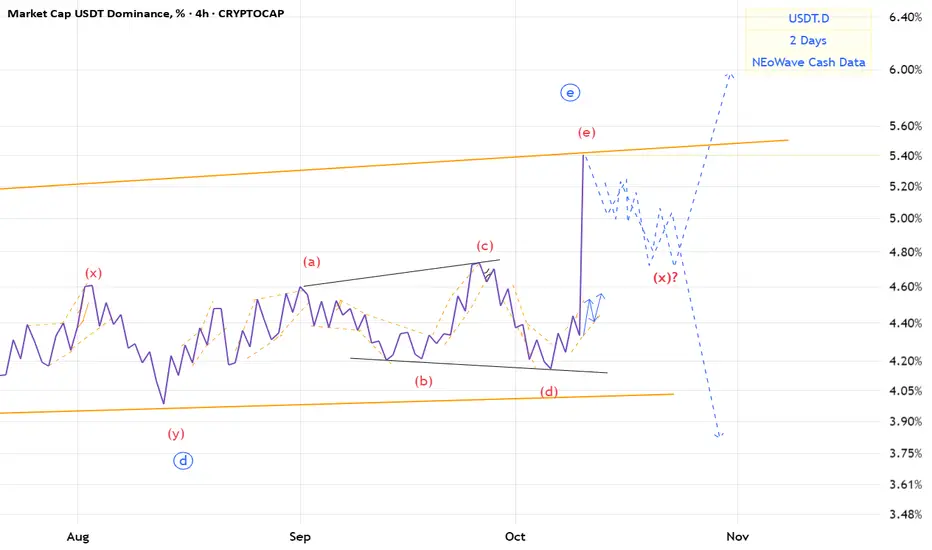
USDT.D(based on NEo wave)The e wave that I wanted made a descending triangle.
we should wait for it becouse it may make an x wave or a post pattern.
BITCOIN'S FALL HAS BEGUN ! DON'T GET CAUGHT UP IN THE BLOODBATH JPowel's rate cut hints that something bad is about to happen. All Fed Rate cuts have been marked by devastating market crash and this time will be no different. Don't lose your hard-earned money to the upcoming carsh !! You have been warned.
Disclaimer: Not financial advice.
