Hellena | GOLD (4H): LONG to 4800 area.Colleagues, the situation with gold is very complicated. The latest strong and deep correction suggests that these movements are movements in higher-order waves, which should have formed later.
But we have what we have, and I believe that wave “III” of the highest order is complete, which explains such a deep correction in wave “IV.”
However, this marking does not contradict my desire to look for long positions. I think it is worth continuing to watch the upward movement, but it is not worth making long-term plans and working with immediate goals.
I believe that the price will recover to at least the 4800 area, as this is a fairly important round level.
In other words, I expect the start of movement in wave “5” of the highest order.
Manage your capital correctly and competently! Only enter trades based on reliable patterns!
Elliotwaveanalysis

EUR/USD | Price Shows Moderate Upward MomentumEUR/USD moved within a narrow range around 1.1815 during today's Asian trading session.
Investors are in a "wait and see" mode ahead of the release of important Eurozone inflation data this afternoon and tomorrow's European Central Bank (ECB) policy meeting.
✅ Europe Focus: Awaiting HICP Data & ECB Meeting
Sentiment towards the euro currently depends heavily on inflation indicators and the direction of monetary policy:
- ⚡January HICP Estimates: Eurozone headline inflation (HICP) is projected to decline to 1.7% YoY (from 1.9%), while core inflation is expected to remain stable at 2.3% YoY. If this data is lower than expected, the euro risks weakening as markets speculate about an earlier ECB interest rate cut.
- ⚡ECB Meeting (Thursday): Markets expect interest rates to remain broadly unchanged. However, the main focus will be Christine Lagarde's press conference to see if the ECB will begin to soften its rhetoric in response to the decline in inflation below the 2% target.
✅US Focus: Services Sector & Kevin Warsh Nomination
The US Dollar (USD) maintains its strength as a safe-haven asset amidst domestic dynamics:
- ⚡"Warsh Effect": The nomination of Kevin Warsh as the next Fed Chair continues to support the USD. Warsh is seen as a more disciplined figure on inflation, which has triggered an increase in US bond yields.
- ⚡Labor & Services Data: The ADP Employment Change report (8:15 PM WIB) and the ISM Services PMI (10:00 PM WIB) tonight will be the main catalysts for volatility. Strong services data (consensus forecast at 53.8) will further strengthen the Dollar's position.
- ⚡Risk Sentiment: Still volatile geopolitical tensions (US-Iran) and trade tariff issues continue to maintain demand for the Dollar as a hedge.
✅ EUR/USD Technical Analysis (Intraday)
Technically, the pair is attempting to establish a support base after falling from its 2021 high last week.
- ⚡Critical Support ($1.1775 - $1.1800): This one-week low serves as a key defensive line. If this level is breached, EUR/USD risks sliding towards 1.1650.
- ⚡Immediate Resistance ($1.1870 - $1.1910): The euro needs to break above this area to ease selling pressure and retest the psychological level of 1.2000.
- ⚡RSI Momentum: The relative strength indicator is in the 42-45 range, indicating continued seller dominance but not yet reaching extreme oversold conditions.

Wave B +15%: Is 4,400 the Final Bottom?After a strong rally in yesterday’s Asian session, gold moved into consolidation during the European and US sessions, with a failed breakout late in the US session. In today’s Asian session, price broke above the 4,882–4,960 range, confirming it as a new buy-side base.
Gold has rebounded ~15% from the 4,404 area, driven by dip-buying demand and rising US–Iran geopolitical tensions, which remain a key catalyst alongside this week’s economic data.
From an Elliott Wave perspective, 4,400 marks the Wave A bottom. The market is now in a Wave B corrective rebound, with potential upside toward 5,140 – 5,200 – 5,220. Once Wave B completes, Wave C may follow, where signs of weakness and distribution will be watched to identify new swing-buy zones after the correction.
Support: 4,990–4,950 | 4,880–4,890 | 4,780–4,750 | 4,650–4,624
Resistance: 5,140 | 5,200 | 5,220
Note: Volatility remains elevated. Trade cautiously with strict risk and capital management

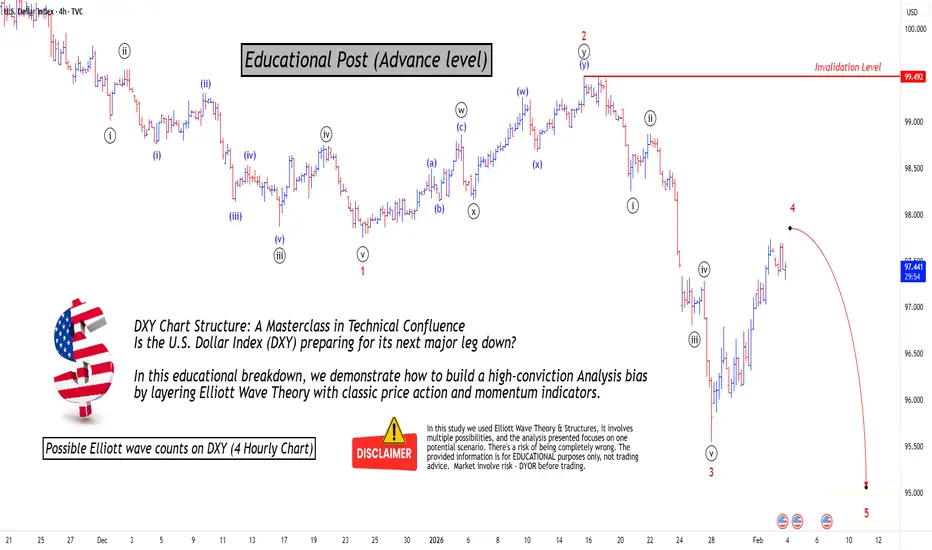
Mastering Technical:DXY Elliott Wave & Multi-Indicators AnalysisTechnical Analysis: DXY Bearish Confluence
This post serves as an educational guide on how various technical analysis tools converge to suggest a strong potential for a continued downtrend in the U.S. Dollar Index (DXY) on the 4-hour timeframe.
Elliott Wave Structure & Bearish Bias
The prevailing Elliott Wave count suggests the DXY is currently completing a corrective minor wave 4 rally within a larger five-wave impulse sequence to the downside. The market bias remains bearish, anticipating the onset of a significant minor wave 5 decline once the current wave 4 correction finishes.
Dow Theory & Price Action Confirmation
Dow Theory principles support the bearish outlook. The price action is clearly establishing a pattern of lower lows and lower highs, a classic signature of an active downtrend. The current rally (wave 4) is simply a higher low correction within this established structure, confirming the overall market direction is down.
Key Confluence Points for Resistance
Multiple technical indicators are clustering at a specific price zone, suggesting a high-probability area where the rally might reverse:
200 EMA Resistance: The price is trading below the 200-period Exponential Moving Average (EMA) on the 4-hour chart. This indicator is positioned just above the current price and is expected to provide significant dynamic resistance (a "hurdle") to the upside.
Fibonacci Retracement Alignment: The crucial 61.8% Fibonacci retracement level of the last major swing low is located very near the 200 EMA. This strong overlap of resistance levels increases the likelihood of a price reversal.
Divergence Analysis
Divergences between price and oscillators further reinforce the bearish sentiment:
Hidden Bearish Divergence: There is existing hidden bearish divergence present. This is a powerful trend-continuation signal that reinforces the expectation that sellers will soon regain control.
Absence of Bullish Signals: A key factor increasing conviction in the bearish bias is the lack of any bullish divergence seen yet on chart. The absence of this potential reversal signal suggests that a strong bullish bounce is not imminent.
Invalidation Level & Potential Targets
Defining risk and reward is essential in trading:
Invalidation Level: The bearish count is only valid as long as the price remains below the critical invalidation level marked at approximately 99.492
Potential Targets: Upon confirmation of the wave 4 top and the start of wave 5, the target for the decline is expected to be lower than the last swing lows (below the wave 3 termination point around 95.100).
I am not Sebi registered analyst. My studies are for educational purpose only.
Please Consult your financial advisor before trading or investing.
I am not responsible for any kinds of your profits and your losses.
Most investors treat trading as a hobby because they have a full-time job doing something else.
However, If you treat trading like a business, it will pay you like a business.
If you treat like a hobby, hobbies don't pay, they cost you...!
Hope this post is helpful to community
Thanks
RK💕
Disclaimer and Risk Warning.
The analysis and discussion provided on in.tradingview.com is intended for educational purposes only and should not be relied upon for trading decisions. RK_Chaarts is not an investment adviser and the information provided here should not be taken as professional investment advice. Before buying or selling any investments, securities, or precious metals, it is recommended that you conduct your own due diligence. RK_Chaarts does not share in your profits and will not take responsibility for any losses you may incur. So Please Consult your financial advisor before trading or investing.
Gold Correction Done? Quick UpdateGold smashed the $5,600 blow-off top and dropped hard ~10% to test right at the 0.618 Fib retracement ($4,410). That violent shakeout looks complete, classic profit-taking after the parabolic run, weak hands flushed, volume likely drying on any further dips. Structure from late 2025 bull trend still intact.
Holding here sets up resumption higher toward the measured extensions in the $6,400–$6,600 zone (green box target).
A close back above $4,700 would lock in the higher low and give bulls strong conviction. For now: dip bought aggressively? Or waiting for confirmation? What’s your read, correction over, or one more leg down?
Disclaimer: Not financial advice. Trading involves significant risk of loss. Do your own research. Past performance is not indicative of future results. For educational purposes only.
- FIBCOS
#Gold #XAUUSD #Fibonacci

Hellena | EUR/USD (4H): LONG to MAX wave 3 (1.20813).I think that the price confirmed the extension of wave “3” and, as a result, the continuation of the upward movement.
This means that we will see new highs, but the correction in wave “4” should end before wave “5” begins.
In our case, wave “4” has either ended or will soon end in the area of 38.2% - 50% Fibonacci levels (1.18594).
Then I expect the upward movement to continue at least to the area of wave “3” high at 1.20813.
The forecast may take quite a long time to play out, so I will immediately indicate that I will consider closing positions at the level of 1.20000 if the price reaches that level after a good correction.
Manage your capital correctly and competently! Only enter trades based on reliable patterns!

Hellena | Oil (4H): SHORT to support area 62.295.Colleagues, earlier I described the upward movement as a full-fledged ABC correction, and the price justified expectations and completed the planned upward movement, but at the moment I think it is worth considering that wave A has been extended.
This fits well with both the old and new scenarios.
I expect wave “B” to begin its movement soon.
I will not set distant goals and will wait for the price to reach the first support area — the maximum of wave “3” of the middle order at 62.295.
I admit the possibility of updating the maximum of wave “A” approximately in the resistance area of 65.199.
In general, if correction “B” continues too far down, I will return to the old scenario.
Manage your capital correctly and competently! Only enter trades based on reliable patterns!

BTC Cycle Peak Confirmed at $126k – Mapping the Road to $58kThe Macro Picture
The multi-year bull cycle that began in November 2022 has officially reached its terminal point. The blow-off top at $126,198 in October 2025 completed a textbook Primary Wave 5. We are now dealing with a significant macro ABC correction that is likely to dominate 2026 price action.
The Elliott Wave Breakdown
Primary Wave (1): Topped near $75k in early 2024.
Primary Wave (3): The parabolic engine of the run, surging from $50k to above $110k.
Primary Wave (5): Final exhaustion leg that peaked at $126k.
Wave (A) (Current): A sharp 30–40% decline from the ATH, currently testing psychological support in the $75k–$80k range.
What’s Next?
Relief Rally (Wave B): Markets rarely drop in a straight line. Expect a bounce toward the $100,000 – $112,000 zone. This is a prime area for de-risking or entering macro shorts.
Final Capitulation (Wave C): After the Wave B bounce, a final leg down typically targets the previous Wave 4 territory. My ultimate bottom target remains the $58,000 – $71,000 "Golden Pocket".
Invalidation
A sustained weekly close above $116,000 would invalidate this bearish count and suggest that Primary 5 is undergoing a rare extension.
#BTC #Bitcoin #ElliottWave #TradingStrategy #2026Outlook

This Will Take Time – Part IV: The End of WaitingAlmost exactly five months after Part III (published mid-August 2025 and updated November 2025), where I nailed the retracement scenario following the completion of the prior impulsive structure, Ethereum continues to respect the larger corrective framework I've been tracking.
Current Snapshot (as of late January 2026)
ETH/EUR is hovering in the low €2,200s (recent range €2,215–€2,360), down significantly from the €2,500+ levels seen earlier this month.
Monthly RSI(7) has plunged to ~28.50 — oversold territory and aligning precisely with the pattern I anticipated back on November 17, 2025, targeting the completion near the 1,994.58 level.
Key Technical Update
The probability of a temporary breach below €2,000 remains extremely high in the short term. This would fulfill the final leg of the multi-year correction.
The overall structure still qualifies as a complex WXY corrective wave (2) , holding firmly above critical Fibonacci levels so far. However, a decisive break and close below the 61.8% retracement would re-label this final decline as wave (E) of an extended ABCDE triangle (or diagonal in some interpretations) — a classic exhaustion pattern that often precedes explosive resolutions.
This isn't just another dip; it's the culmination of a 4+ year sideways-to-down corrective phase following the 2021 blow-off top. Corrections of this magnitude and duration in major assets are rare — and historically, their endings mark the true start of the next macro bull leg.
What Comes Next?
Once this final capitulation prints (likely via a spike low into the €1,800–€1,994 zone or slightly below), expect a swift reversal. The pent-up momentum from years of consolidation, combined with Ethereum's fundamentals (scaling progress, institutional adoption, ETF flows, etc.), sets the stage for a move of historic proportions.
I'm looking at an outcome similar — or potentially even more extreme — than the parabolic run XRP delivered last year . Think multi-fold gains in compressed time, with the kind of velocity that rewrites charts and shakes doubters.
Patience has been the name of the game. The waiting is nearly over.
Stay sharp, manage risk on any final flush, and prepare for what could be the most spectacular chapter yet in Ethereum's journey.

#XMR Just Flipped Control – Bears Are Running Out of Time
Yello Paradiser!, are you aware that #XMR has been signaling the exhaustion of its bearish cycle long before the recent breakout even occurred? The structure has been quietly transitioning from distribution into accumulation, and the market is now starting to reveal that change.
💎#XMR shows a clear deceleration of downside momentum from one descending channel into another. In Elliott Wave theory, this behavior is commonly seen during the late stages of a corrective or impulsive decline, particularly as wave 5 begins to lose strength. This structural compression strongly suggests that the downtrend was nearing completion.
💎The recent breakout from the descending channel is technically critical. Price has decisively crossed above the top of wave 4, which confirms a Change of Character (CHoCH). A bullish divergence on the RSI between wave 3 and wave 5. This is a classic confirmation of wave 5 termination and increases the probability that a trend reversal is already in progress.
💎The breakout occurred with a sharp and impulsive move to the upside, which is characteristic of a wave 1 or wave A advance. Such price behavior reflects strong demand entering the market and confirms that buyers have regained control of the short-term structure.
💎From here, two primary Elliott Wave scenarios remain valid. #XMR may be starting a new impulsive bullish cycle in the form of a 1–2–3–4–5 structure, or it may be developing a corrective ABC or WXY rally within a larger-degree bearish trend. Regardless of the macro labeling, both scenarios point toward one more strong upside expansion before any meaningful correction occurs.
💎Key resistance is located at the top of the larger-degree wave 4, around the $650 region. This level represents the natural target for the current advance and could be exceeded if the move develops impulsively. On the downside, major structural support is located near $410.
Strive for consistency, not quick profits Paradisers. Treat the market as a businessman, not as a gambler. This is the only way you will make it far in your crypto trading journey. Be a PRO💰
MyCryptoParadise
iFeel the success🌴

NFLX | Wave 4 Correction Playing Out – Wave 5 to 744–1kHey guys, quick real-talk update on Netflix.
Right now we're smack in the middle of Wave 4. That recent drop to around $83 is classic Wave 4 behavior, it's shaking out the weak hands, creating exhaustion, and hunting for liquidity below recent lows. This isn't the end of the move; it's the healthy breather before the real fireworks.
The main target zone for this Wave 4 low is still sitting between 47 and 36.
That area lines up perfectly:
0.5 to 0.618 retracement of the whole Wave 3 leg
Previous structural support from 2019–2020 consolidation
High-volume nodes on the profile that love to act like magnets
Time/proportion symmetry with earlier corrections
Once we print a solid bottom in that 47–36 window (could be a quick flush lower first to take out stops, then reversal), Wave 5 should kick off hard.
The upside extensions we watching are the 744–1k cluster:
2.618 Fib of Wave 4 projected from the low
Alignment with the upper boundary of the long-term parabolic channel
Final push to complete Wave 5 of the bigger supercycle
If we start seeing strong reversal candles or a volume spike on the bounce near 47–36, that's the high-probability entry window for the Wave 5 ride.
Quick Risk Note:
Only thing that would kill this count short-term is a clean break and close way below 160 on big volume. That would flip us into a deeper ABC correction instead. But right now the structure still screams higher & primary count is bullish.
Bottom Line:
Sit tight through the chop, let Wave 4 do its job, then be ready for Wave 5 to deliver the 744–1k extension. This could be the blow-off leg we've been waiting for.
If this makes sense to you, smash that boost, drop your own targets or questions in the comments, and hit follow, so you don't miss the live updates when we get closer to the reversal.
Stay sharp out there – trade the structure, not the noise.
— Fibcos
#NFLX #Netflix #Stocks #ElliottWave #Wave4 #Wave5 #Supercycle #Fibonacci #StockMarket #Trading #TechnicalAnalysis #BullishSetup #Investing

$MSTR Is Preparing For A Dive...NASDAQ:MSTR : We cannot ignore the downside risks at this point. With $430.35 intact, NASDAQ:MSTR is poised for a significant downward move toward the March lows or lower to complete wave (C) of a simple zigzag correction.

Hellena | GOLD (4H): LONG to max of wave “3” 5593.I think that wave “3” is complete, since excessive stretching is also unacceptable, so it would be more rational to assume that the price is now in a correction of wave “4” of a higher order.
This means that we will still see new highs, but the correction in wave “4” should end before wave “5” begins.
In our case, wave “4” has either ended or will soon end in the area of 38.2% - 50% Fibonacci levels at 5016.
Then I expect the upward movement to continue at least to the area of the wave “3” high at 5593.
The forecast may take quite a long time to play out, so I will immediately indicate that I will consider closing positions at the level of 5450 if the price reaches that level after a good correction.
Manage your capital correctly and competently! Only enter trades based on reliable patterns!

SOL/USD: ABC Correction Ending at SupportSOL/USD has completed a bullish impulsive move, finishing a full 5-wave structure to the upside. After the top of Wave 5, the market shifted into a corrective phase, forming a clear A-B-C correction. Price has now moved down into Wave C, which is testing a strong support zone between 121–119 (Fibonacci 0.618–0.786 area). This zone is important because corrections often end here. As long as price holds above ~119, the bias turns bullish, and a recovery toward 129–132 (Wave B / retracement area) is expected first, followed by a potential continuation higher. If price breaks and closes below 119 , the bullish recovery idea fails, and SOL could move lower toward the next support near 115 .
Buy zone: 121 – 119 (0.618–0.786 Fibonacci support)
Stop-loss: 118.50 (below Wave C low)
Target 1: 129.30 (0.382 retracement)
Target 2: 132.00 – 135.00 (prior structure resistance)
Stay tuned!
@Money_Dictators
Thank you :)

Dollar Breaking Down, But How Far? Good day everyone..
While I was away, skiing in Austria, the dollar has seen a very strong and extended decline, exactly as we discussed and expected in our previous updates. Dollar weakness has now pushed to new lows, breaking below the 2025 levels, which suggests we may soon be heading into more overextended conditions. This means that at some point we may see some meaningful pullbacks. COT short positioning is close to 2007 extremes, and with recent sell-off this data can be pushed into even more significant levels… Something to consider; what may happen at such levels. Stabilization?
At the same time, there is still a lot going on in the background, including uncertainty and potential escalation between the US and Iran, the risk of a partial US government shutdown, and most recent event was the Fed decision yesterday. The Fed decided to hold rates steady at the first meeting of 2026 as the economy is doing quite well, but there is also strong pressure coming from President Trump toward Powell, which could help stabilize the dollar in the near term if FED losses independecy.
On the other hand, stocks remain firmly in risk on mode. META, Tesla, reported strong results above expectations, and there are also new reports about further investments into OpenAI. So we are still in a phase of strong risk on flows and tech boom. But as said, given how extended the recent legs lower on the dollar have been this week, so some stabilization is likely to show up. But what will cause it its yet to be discovered.
Grega

Gold Pulls Back After Impulse – Trend Still IntactQuick Context
Recent geopolitical uncertainty continues to support safe-haven flows. Gold has already delivered a strong bullish impulse, and the current move looks like a healthy correction, not a reversal.
Technical Snapshot (H1–H4)
Strong bullish impulse already completed
Current price action = controlled retracement
No bearish CHoCH, no structural breakdown
Market is resetting momentum after expansion
This is typical impulse → retrace → continuation behavior.
Key Levels to Watch
Buy Zone: 5,180 – 5,160
Invalidation: H1 close below 5,120
Upside continuation targets:
5,300
5,360
Extension toward 5,440+
If – Then Logic
If price holds above 5,160 → expect continuation higher
If price sweeps into 5,180–5,160 and reacts → buy-the-dip opportunity
Only if H1 closes below 5,120 → bullish bias weakens
Bottom Line
Gold is not reversing — it is reloading.
Pullbacks are part of trend strength.
Wait for reaction, not confirmation at the highs.

5 IMPOTANT TYPES OF ELLIOTT WAVE PATTERNS !!Hello traders, today we will talk about 5 TYPES OF ELLIOTT WAVE PATTERNS
( FIRST SOME BASIC INFO )
What is Elliott Wave Theory?
The Elliott Wave Theory suggests that stock prices move continuously up and down in the same pattern known as waves that are formed by the traders’ psychology.
The theory holds as these are recurring patterns, the movements of the stock prices can be easily predicted.
Investors can get an insight into ongoing trend dynamics when observing these waves and also helps in deeply analyzing the price movements.
But traders should take note that the interpretation of the Elliot wave is subjective as investors interpret it in different ways.
(KEY TAKEAWAYS)
The Elliott Wave theory is a form of technical analysis that looks for recurrent long-term price patterns related to persistent changes in investor sentiment and psychology.
The theory identifies impulse waves that set up a pattern and corrective waves that oppose the larger trend.
Each set of waves is nested within a larger set of waves that adhere to the same impulse or corrective pattern, which is described as a fractal approach to investing.
Before discussing the patterns, let us discuss Motives and Corrective Waves:
What are Motives and Corrective Waves?
The Elliott Wave can be categorized into Motives and Corrective Waves:
1. Motive Waves:
Motive waves move in the direction of the main trend and consist of 5 waves that are labelled as Wave 1, Wave 2, Wave 3, Wave 4 and Wave 5.
Wave 1, 2 and 3 move in the direction of the main direction whereas Wave 2 and 4 move in the opposite direction.
There are usually two types of Motive Waves- Impulse and Diagonal Waves.
2. Corrective Waves:
Waves that counter the main trend are known as the corrective waves.
Corrective waves are more complex and time-consuming than motive waves. Correction patterns are made up of three waves and are labelled as A, B and C.
The three main types of corrective waves are Zig-Zag, Diagonal and Triangle Waves.
Now let us come to Elliott Wave Patterns:
In the chart I have mentioned 5 main types of Elliott Wave Patterns:
1. Impulse:
2. Diagonal:
3. Zig-Zag:
4. Flat:
5. Triangle:
1. Impulse:
Impulse is the most common motive wave and also easiest to spot in a market.
Like all motive waves, the impulse wave has five sub-waves: three motive waves and two corrective waves which are labelled as a 5-3-5-3-5 structure.
However, the formation of the wave is based on a set of rules.
If any of these rules are violated, then the impulse wave is not formed and we have to re-label the suspected impulse wave.
The three rules for impulse wave formation are:
Wave 2 cannot retrace more than 100% of Wave 1.
Wave 3 can never be the shortest of waves 1, 3, and 5.
Wave 4 can never overlap Wave 1.
The main goal of a motive wave is to move the market and impulse waves are the best at accomplishing this.
2. Diagonal:
Another type of motive wave is the diagonal wave which, like all motive waves, consists of five sub-waves and moves in the direction of the trend.
The diagonal looks like a wedge that may be either expanding or contracting. Also, the sub-waves of the diagonal may not have a count of five, depending on what type of diagonal is being observed.
Like other motive waves, each sub-wave of the diagonal wave does not fully retrace the previous sub-wave. Also, sub-wave 3 of the diagonal is not the shortest wave.
Diagonals can be further divided into the ending and leading diagonals.
The ending diagonal usually occurs in Wave 5 of an impulse wave or the last wave of corrective waves whereas the leading diagonal is found in either the Wave 1 of an impulse wave or the Wave A position of a zigzag correction.
3. Zig-Zag:
The Zig-Zag is a corrective wave that is made up of 3 waves labelled as A, B and C that move strongly up or down.
The A and C waves are motive waves whereas the B wave is corrective (often with 3 sub-waves).
Zigzag patterns are sharp declines in a bull rally or advances in a bear rally that substantially correct the price level of the previous Impulse patterns.
Zigzags may also be formed in a combination which is known as the double or triple zigzag, where two or three zigzags are connected by another corrective wave between them.‘
4. Flat:
The flat is another three-wave correction in which the sub-waves are formed in a 3-3-5 structure which is labelled as an A-B-C structure.
In the flat structure, both Waves A and B are corrective and Wave C is motive having 5 sub-waves.
This pattern is known as the flat as it moves sideways. Generally, within an impulse wave, the fourth wave has a flat whereas the second wave rarely does.
On the technical charts, most flats usually don’t look clear as there are variations on this structure.
A flat may have wave B terminate beyond the beginning of the A wave and the C wave may terminate beyond the start of the B wave. This type of flat is known as the expanded flat.
The expanded flat is more common in markets as compared to the normal flats as discussed above.
5. Triangle:
The triangle is a pattern consisting of five sub-waves in the form of a 3-3-3-3-3 structure, that is labelled as A-B-C-D-E.
This corrective pattern shows a balance of forces and it travels sideways.
The triangle can either be expanding, in which each of the following sub-waves gets bigger or contracting, that is in the form of a wedge.
The triangles can also be categorized as symmetrical, descending or ascending, based on whether they are pointing sideways, up with a flat top or down with a flat bottom.
The sub-waves can be formed in complex combinations. It may theoretically look easy for spotting a triangle, it may take a little practice for identifying them in the market.
Bottomline:
As we have discussed above Elliott wave theory is open to interpretations in different ways by different traders, so are their patterns. Thus, traders should ensure that when they identify the patterns.
This chart is just for information
Never stop learning
I would also love to know your charts and views in the comment section.
Thank you

Hellena | GOLD (4H): LONG to resistance 5200.Since the movement continues and clearly shows no signs of reversing, I had to slightly revise the wave count, and it looks as if the impulse has been extended.
This means that the higher-order wave “3” has just ended or will end soon.
This means that wave “5” is not over yet and we should expect another update of the maximum.
I expect the gap at 4984.97 to be closed, after which I expect the rather important and strong level of 5200 to be reached.
Alternatively, wave “3” has not yet ended and should be expected at the same level of 5200.
Manage your capital correctly and competently! Only enter trades based on reliable patterns!

BTCUSD | Trying to predict the unpredictableHello traders,
USD index is weakening. Metals, stocks and basically anything USD related is skyrocketing. And there we have BTC dumping over and over.
BTC is currently in a very unpredictable price action as it forms an internal uptrend and a dump all of a sudden like what happened yesterday
The reason is? Buy side liquidity sweep
Now, I'm expecting BTC to continue lower to target around 86,200 to 86,800
From this range, we could potentially form an inverse H&S that could reverse the trend to short-term bullish
If that fails, price will drop to target 84,000 zone
Action plan? For now, nothing. I'll monitor how the indicated level ($86,000) reacts to price first
Good Luck!

GOLD UPDATED: FINAL GRAND CYCLE ANALYSIS – $5,131 Hit, NEXT?hey everyone — quick update on the GOLD Grand Supercycle Chart ( 2026 edition ).
We've been riding this beast hard, and it's delivering exactly as mapped. We smashed through that first big fib target at $5,131 ( nailed it perfectly today ), printed a fresh all-time high around $5,190 on the 3W, and now... yeah, we're seeing the classic pullback kicking in. This looks like the transition from the end of the 3rd minor wave into the 4th — a healthy, needed breather before the final 5th leg of this minor cycle.
Short-term roadmap right now: Expecting a correction down toward the $3,600–$3,500 zone (marked in red on the chart as that 3-to-4 wave dip). Could be sharp, could grind, but it's the shake-out most people miss or panic-sell. Support clusters there line up with prior structure, fib retraces, and the longer-term channel floor.
Once that 4th wave bottoms, boom — 3rd wave of the minor cycle fires up, targeting ~$9,419 ( 3.618% extension cluster — clean alignment).
After that? The chart tells the rest of the story: Micro 4th wave correction (probably multi-month, classic profit-taking / "gold is done again" vibes).
Then Micro 5th pushes the envelope higher potentially topping near $22,744 (3.618%) , feeding into the Macro Wave 3 climax.
Bigger picture stays unchanged: Macro Wave 3 potentially topping near $22,744 (3.618%), then deep Wave 4 shakeout, followed by the monster Wave 5 blow-off into $78,940+ (or way higher in full fiat-reset chaos — $100k–$250k not off the table if trust fully evaporates).
This isn't hype — it's the same Elliott + fib + PA structure that's respected every major turn since the '70s. We're deep in the "price discovery" phase of Macro Wave 3, where third waves get parabolic and make doubters look silly.
Smart money's been accumulating for years; now retail's piling in, central banks keep buying physical, and the fiat narrative keeps cracking. Dips like the one coming are the last real gifts before the next leg rips.
Plan: Watch for confirmation of the $3,500–$3,600 bottom (higher lows, volume dry-up, reversal candles).
Scale in on weakness if you're positioned — this correction is setup for the next impulse.
Don't fight the trend; third waves extend, corrections get ugly but end.
Stay sharp, manage risk, and let's see if we print $9k+ sooner than most think.
Drop your thoughts below — you calling this dip to $3,500 or shallower? Positions?
What a time to be watching gold... the system's hedge is waking up for real.
Disclaimer: Not financial advice — just sharing the chart structure and my read. Do your own homework, trade your plan.

UNH: adding into fear after a completed ABC correctionThesis
NYSE:UNH has completed its corrective ABC structure and is stabilizing within Wave 2, offering long-term accumulation opportunities in a proven cash-flow compounder.
Context
- Daily and weekly timeframes
- Deep corrective phase already completed
- Long-term uptrend remains intact on the weekly chart
- Dividend-paying, high free-cash-flow defensive name
What I see
- Yesterday’s selloff was headline-driven, not structural
- Price is holding inside the Wave 2 retracement zone
- Volatility is shaking out weak hands, not breaking structure
- This behavior is typical at the end of corrective phases
- I added to my long-term position yesterday, bringing my average into the $270s
What matters now
- The priority is stabilization and base-building
- A reclaim of the 50-day MA improves short-term structure
- Reclaiming the 200-day MA confirms the next impulsive leg
- Gap-filling narratives are noise, not a strategy
Buy / Accumulation zone
- Accumulation remains valid inside the current Wave 2 range
- I have no issue adding again once price stabilizes
- Risk is defined against the recent correction lows
Targets
- First major structural reference: 200-week MA near $460
- Wave 3 target remains the 1.618 Fib extension around $540
- Dividend yield (~2.6%) pays while waiting
Execution note
- This game isn’t for everyone — pressure exposes conviction
- I added at $250 and $240 when sentiment was darkest
- Buffett added at higher prices, yet fear returned instantly
- NYSE:UNH is my current safe-haven: strong FCF, cash-rich, defensive
This is a 3–5 year hold for me, not a short-term trade

JD: Final Wave 2 consolidation (patience before the breakout)Thesis
NASDAQ:JD is still compressing in the final stages of Wave 2, and the longer this base builds, the stronger the breakout typically becomes.
Context
- Weekly timeframe
- Multi-year downtrend transitioned into a base
- Compression phase continues while peers already broke out (BABA, BIDU)
- 2026 remains the window for JD to catch up
What I see
- Standard late-stage consolidation behavior for a Wave 2 structure
- Volatility keeps compressing inside the wedge
- Support is still holding, while resistance is still capping price
- Nothing “broken” here — just time passing and pressure building
What matters now
- We need patience until the weekly breakout and hold above wedge resistance
- Until that happens, this is still a compression structure, not the breakout itself
- The longer this range holds, the better the breakout odds and follow-through
Buy / Accumulation zone
- Wedge floor / support zone remains the area of interest
- Risk stays clean as long as support holds
Targets
- Wave 3 target remains: 1.618 Fib at ~$71
- Higher extensions come later once Wave 3 plays out and Wave 4 support is confirmed
Risk / Invalidation
-Loss of the wedge floor support would delay the bullish catch-up thesis

EUR/JPY: Wave 5 Completed, ABC Correction AheadEUR/JPY has completed a strong bullish impulsive move, finishing a full five-wave Elliott Wave structure to the upside. The recent highs suggest that Wave 5 is likely complete, which often signals the end of a trend phase. After such a move, the market usually shifts into a corrective phase, and the chart shows the start of an A-B-C correction. Price is expected to move lower first into Wave (A), followed by a bounce in Wave (B), and then another decline in Wave (C). As long as price remains below the recent high near 186.9, the bias is short-term bearish, with downside targets around the 179–176 zone. This pullback would be a normal and healthy correction after a long rally, not a trend reversal yet.
Targets
Wave (A) target: 179.5 – 178.0
Wave (C) target (if correction extends): 176.0 area
Stop-Loss
Above recent high: 186.90
Invalidation Level
Daily close above 186.90
Stay tuned!
@Money_Dictators
Thank you :)
