Identifying High-Probability Support: The Power of ConvergenceHello Friends,
Welcome to RK_Chaarts
Today we're going to learn Comprehensive Guide to Identifying Convergent Support Zones
Which are High Probability Support areas. This post is for Educational purpose only.
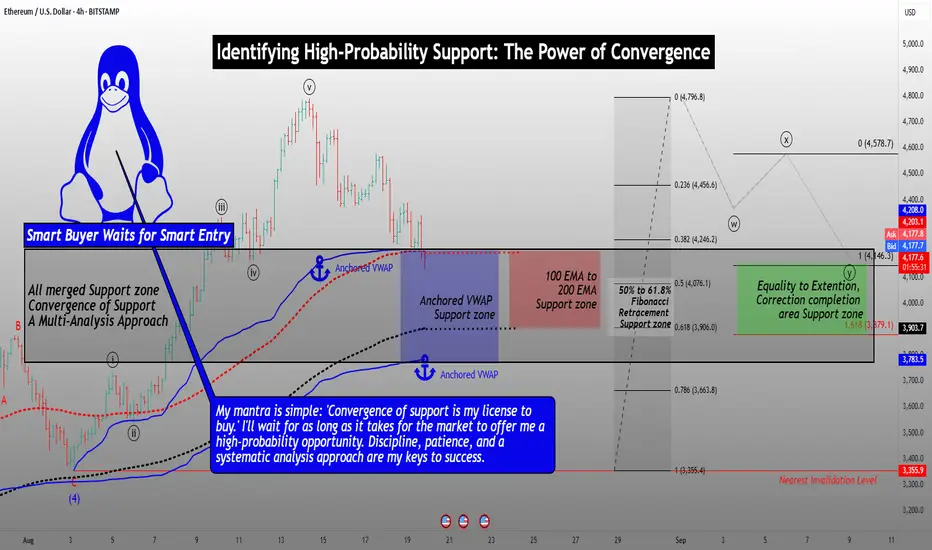
This detailed analysis will walk you through a step-by-step process of combining multiple technical analysis methods to identify a robust support zone. We'll explore how Elliott Wave theory, Anchored VWAP, EMA200, Fibonacci Retracements, and equality to extensions can coincidentally converge on the same support zone.
Step 1: Elliott Wave Analysis
Begin by identifying the Elliott Wave structure. Look for impulse waves, corrective waves, and the relationships between them. In this example:
- Wave Y is potentially completing near the equality zone (100% to 161.8% extension).
- This level marks a potential reversal point.
Support zone as per Elliott Wave theory Analysis
Step 2: Anchored VWAP Analysis
Apply Anchored VWAP to identify key support levels:
- Plot the VWAP from the last swing low and the second-last swing low.
- Note the convergence of these VWAP levels, which can indicate strong support.
Support zone as per Anchored VWAP Analysis
Step 3: EMA200 Analysis
Add the 200-period Exponential Moving Average (EMA) to your chart:
- The EMA200 has consistently provided support during previous corrections.
- Note the price approaching this level, increasing the likelihood of a bounce.
Support zone as per 200 Exponantial Moving Average
Step 4: Fibonacci Retracement Analysis
Apply Fibonacci retracements to the previous rally:
- Identify the 50%, 61.8%, and 78.6% retracement levels.
- Note the current fall has already exceeded the 38% retracement.
Support zone as per Fibonacci Retracement Analysis
Step 5: Convergence of Support Zones
Combine the analysis from each step:
- Note the striking convergence of support zones:
- Elliott Wave equality zone (100% to 161.8% extension)
- Anchored VWAP support zone
- EMA200 support level
- Fibonacci retracement zone (50%-61.8%)
Coincidentally all these are providing nearly same Support area (Price zone)
Trading Implications
With the convergence of these multiple analysis methods, you can:
- Identify a high-probability support zone.
- Look for buying opportunities near this zone.
- Monitor price action and market sentiment for confirmation of a reversal.
- Consider scaling into positions or setting limit orders within the support zone.
Important Note: Failure to Hold Support
If the price fails to hold support at this converged zone, it may indicate a stronger bearish trend. In this scenario:
- Be prepared for a potential significant downfall.
- Consider adjusting your trading plan to account for the increased bearish momentum.
- Keep a close eye on price action and market sentiment for further guidance.
By understanding the convergence of these multiple analysis methods and being aware of the potential risks, you'll be better equipped to make informed trading decisions and navigate the markets with confidence.
I am not Sebi registered analyst.
My studies are for educational purpose only.
Please Consult your financial advisor before trading or investing.
I am not responsible for any kinds of your profits and your losses.
Most investors treat trading as a hobby because they have a full-time job doing something else.
However, If you treat trading like a business, it will pay you like a business.
If you treat like a hobby, hobbies don't pay, they cost you...!
Hope this post is helpful to community
Thanks
RK💕
Disclaimer and Risk Warning.
The analysis and discussion provided on in.tradingview.com is intended for educational purposes only and should not be relied upon for trading decisions. RK_Chaarts is not an investment adviser and the information provided here should not be taken as professional investment advice. Before buying or selling any investments, securities, or precious metals, it is recommended that you conduct your own due diligence. RK_Chaarts does not share in your profits and will not take responsibility for any losses you may incur. So Please Consult your financial advisor before trading or investing.
Elliotwaveanalysis
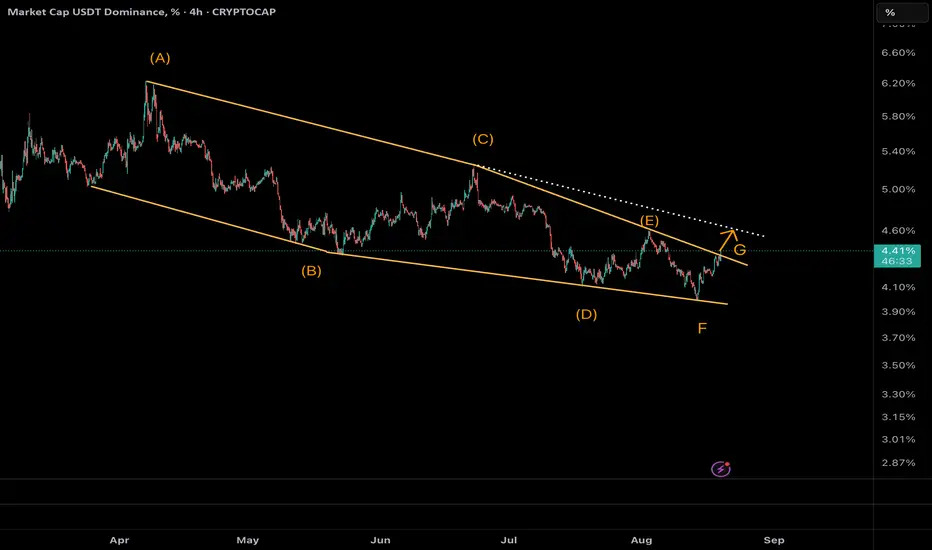
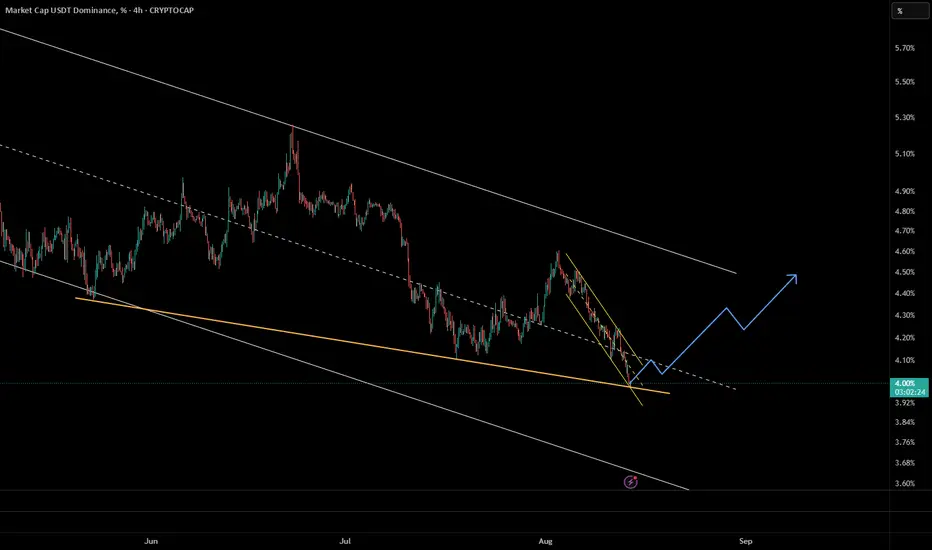
USDT.D Daily | Explosive Surge from 4% –Altcoins Bloodbath Ahead🔹 Overview
USDT Dominance (USDT.D) has completed a 7-wave Diametric correction inside the descending yellow channel. Now, Wave G is accelerating with strong momentum.
, dominance is at 4.33%, breaking the channel trendline. This confirms the end of the correction phase and signals the start of a dominance rally.
Our prior forecast from the 4% floor is playing out exactly—capital is flooding into stables as risk-off sentiment crushes Altcoins.
⸻
🔹 Wave Structure (NeoWave)
• Diametric unfolded as A-B-C-D-E-F-G.
• Symmetry holds: large A/C/E/G vs. small B/D/F.
• Trendline break = pattern completion.
Monowave count (~55–70) confirms the structure’s legitimacy.
⸻
🔹 Technical Setup
• Current support: 4.28% (brown line).
• Target 1: 4.6% (Fib 1.618 extension + trendline).
• Target 2: 5% (channel midline).
• RSI bullish divergence + rising volume confirm strength.
⸻
🔹 Market Implications
This breakout means:
⚠️ Altcoin Bloodbath incoming.
USDT dominance rally = liquidity moving away from alts. BTC/ETH may stabilize, but alts risk heavy drawdowns.
⸻
🔹 Trade Idea (Bullish USDT.D)
• Entry: Long USDT.D (or short alts) above 4.33% on BOS confirmation (daily).
• Targets: TP1 = 4.6%, TP2 = 5%.
• Stop Loss: Below 4.28%.
• Risk: 1–2% per trade. Trail stops if midline breaks.
⸻
🔥 Get ready for a stablecoin takeover & brutal altcoin flush.
ETH.D : 5-Wave Bull Run Over –Bitcoin to Outshine EthereumeEthereum Dominance (ETH.D) has completed a textbook 5-wave impulsive rally on the weekly timeframe, signaling the end of its upward cycle and entry into a deep corrective phase. As of August , ETH.D at 13.37% is rejecting the key order block at ~14%, hinting at weakening momentum. This shift favors Bitcoin's outperformance, as capital rotates from ETH to BTC, potentially boosting BTC/ETH ratio and Bitcoin returns during the downturn.
NeoWave Wave Count (Daily Chart):
The rally from ~10.5% lows unfolded in 5 waves: Wave 1 to ~11.41%, Wave 2 correction to ~10.11%, Wave 3 extended to ~13.97% (161.8% of Wave 1), Wave 4 shallow to ~13.32%, and Wave 5 topping at 13.97% with the 1.618 Fib extension (1.141%).
Monowave count (~55-70 subwaves) validates the impulse, with alternation (Wave 2 deep/time-extended, Wave 4 shallow/short). The ascending channel (yellow) has been touched multiple times, and the recent rejection confirms exhaustion.
Weekly Chart Insight:
On the weekly TF, ETH.D has hit a major order block at ~14% (1.425%), not the channel top, coinciding with the 1.618 Fib extension from 2023 lows and historical resistance from 2018 highs (~52%). This multi-year descending channel holds firm, with price failing to break the OB—suggesting reversal to midline ~12.5% or lower (38.2%-50% Fib retrace of rally).
Why Bitcoin Outperforms From Here:
As ETH.D corrects (likely a Zigzag or Flat, targeting 11%-12%), Bitcoin gains dominance, driving better returns for BTC holders. Expect BTC/ETH ratio to climb (current ~12.5, target 14-15), with Bitcoin yielding 10-20% superior performance in risk-off environments. If ETH.D drops below 12.5%, correction accelerates to 10% (78.6% Fib), amplifying BTC's edge.
Trade Idea (Bearish ETH.D / Bullish BTC):
Entry: Short ETH.D (or long BTC/ETH pair) below 13.32% on BOS confirmation in weekly.
Targets: TP1 at 12.5% (channel midline), TP2 at 11% (50% Fib).
Stop Loss: Above 14.25% (OB high, R:R ~1:3).
Sizing: 1-2% capital; trail stops on midline breaks. Watch dominance flips—crypto rotations can spark quick BTC pumps.
ETH bulls, pivot to BTC now! #ETHDominance #NeoWave #BitcoinOutperformance #CryptoAnalysis

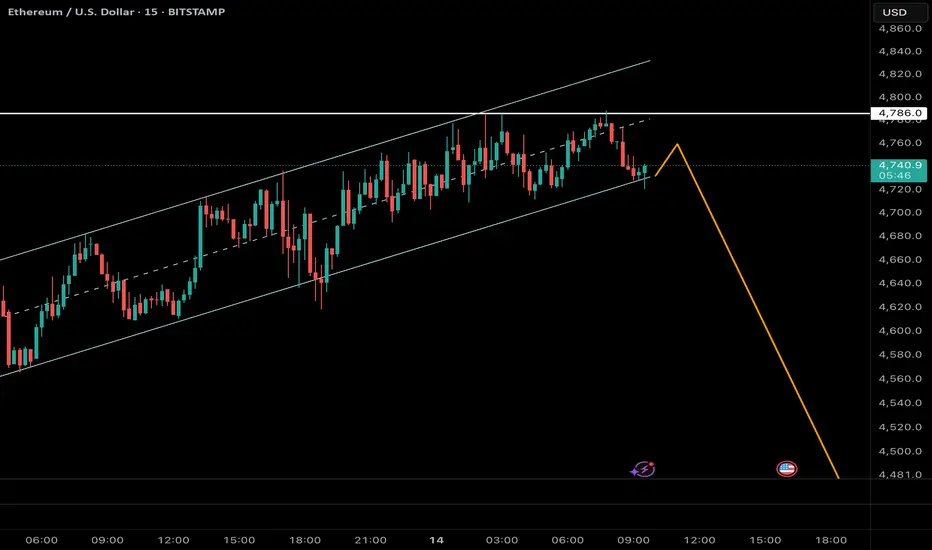
Close view of ETH Short Description : the possible next Move of ETH Shown in graph. ETH can drop to 4100 as 5th wave of correction pattern
XAUUSD: Elliot Wave Analysis 15 minHello friends, if you are viewing the gold chart on the 15-minute time frame, it seems that based on Elliott waves, we will have an upward wave towards 3389, followed by a continuation of wave C towards 3306, and then we need to see in which direction the trend will move.

Elliott Wave Analysis of Kirloskar Brothers KIRLOSBROSThe script is currently in 4th wave of hourly chart. The 4th wave seems to be ending, which means a 5th wave will start from here. The wave patters and patterns, retracements and analysis have been highlighted on the chart. Will update this as it progresses.

BTCUSDT:Elliot Wave 15minAccording to the previous analysis, it is expected that Bitcoin's upward trend will occur with the formation of waves 1 and 2. Considering the market structure, the market structure must be broken and stabilized above the previous ceiling, followed by a decline towards liquidity as the second wave, after which we will expect growth.

ETH Elliot Wave to Smash the BIG 5k ATHmarked out some precise Elliot Wave levels on ETH:
recently closed W3 at 4788, which gives a W4 targets 4343.56 and 4167
leading to W5 breaking the big 5k mark with targets 5081.20 or 5171.78 (with deeper pullback in W4).
this gives a nice short opportunity entering just below the HTF supply zone at 4618.92 (divergence suggests another small bounce)
followed by an epic long to new ATH entering at 4313.56 (and 4167 on a deeper W4) with TPs at 4899 and 5081

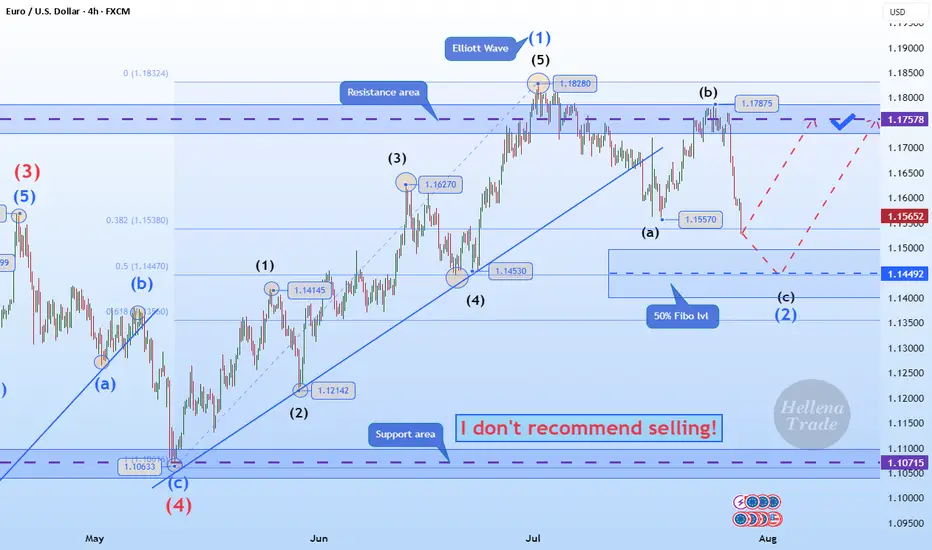
Hellena | EUR/USD (4H): LONG to the resistance area 1.17578.Colleagues, the price has made a strong downward movement, which can only mean one thing: the correction is not complete.
This means that the latest upward movement is wave “1” of medium order.
Therefore, I now expect the correction to end in wave “2” at the 50% Fibonacci level and thean upward movement to continue to at least the resistance level of 1.17578.
It is quite possible that after updating the level of 1.15570, the price will immediately begin an upward movement — this is a more risky option for entering a position.
Manage your capital correctly and competently! Only enter trades based on reliable patterns!
Hellena | Oil (4H): SHORT to support area of 61.937 (Fibo lvl).Hello, colleagues!
Well, I think that the previous scenario is still relevant and the “ABC” correction is developing according to the scenario.
At the moment, I see a five-wave structure in the downward wave “C”. I expect a small correction to the area of 67.287, then a continuation of the downward movement to the area between 61.8% and 100% of the levels of Fibonacci extension - the support area of 61.937.
Manage your capital correctly and competently! Only enter trades based on reliable patterns!

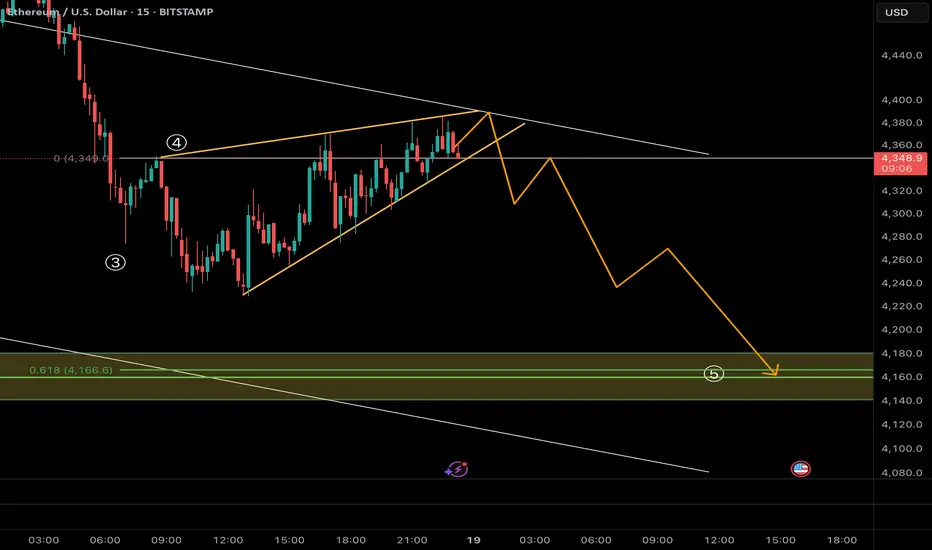
Ethereum on the Edge – The Breakdown Could Start Any Moment!Following yesterday’s analysis, where we identified Ethereum in the final stages of wave 5 of 5 at the upper boundary of its ascending channel, the 15-minute chart now reveals a contracting Neutral Triangle structure. This pattern typically forms as the final subdivision of wave 5, often preceding a sharp and decisive reversal.
Currently, price is testing the upper boundary of the B–D trendline. A confirmed breakdown from the E-wave low (≈ $4,590) would mark the completion of the triangle and signal the start of the anticipated decline.
Key Observations:
• Pattern: Neutral Triangle inside wave 5 of 5 (final stage of advance)
• Reversal Trigger: Break below E-wave low (~$4,590) on strong volume
AUDNZD Technical OutlookWhat I See!
AUDNZD is showing a rising wedge formation after an extended move higher from the May swing low. Price is reacting around the 1.1000 psychological level, which overlaps with a daily Fair Value Gap (FVG) and a prior supply zone.
From a structural perspective, a move toward the bullish daily FVG near 1.0850 is a possible short-term development. If this zone holds, the chart could continue to build toward the equal highs around 1.1181.
Alternatively, invalidation of the 1.0850 daily FVG could open the door for a deeper decline, potentially completing the wedge pattern and drawing price toward lower demand areas.
This chart is presented for educational discussion of market structure and technical patterns only. It is not a trade signal or financial advice.
💬 Got questions? You’re welcome to share your thoughts in the comments.

Tether Dominance at Double Support – Is the Bull Run in Danger?The market is currently at a critical juncture – any correction from here could signal the end of the strong bullish wave we’ve been riding.
As seen in the Tether Dominance chart, price has reached two key support levels. From this zone, we anticipate a potential strong reversal in the market.
ASX:REA - 13 AUG, 2025 - ELLIOTT WAVE ANALYSISConclusion: Wave 4)-blue needs more time to complete, then wave 5)-blue can move higher.
Key points: Wave 4))-purple has finished at 62.05 and wave 5))-purple is moving higher. It is subdividing into wave 1)blue to wave 4)blue. Basically wave 4)blue is not completed, because there is not enough convincing evidence, it will probably last longer and develop as a Triangle. After we have more price action, we will know what it is trying to say, for now just wait.
Invalidation point: 180.67 (Wave 4 does not overlap wave 1).
©By Hua Chi Cuong (Shane), CEWA-M | Certififed Elliott Wave Analyst - Master Level

Ethereum (ETH/USD) – Elliott Wave AnalysisThe current price structure suggests that Ethereum is completing the final stages of a 5-wave impulsive advance, with the market now positioned in wave 5 of 5. Price action has reached the upper boundary of the ascending channel, coinciding with a key Fibonacci projection zone (green resistance area), which aligns with typical wave 5 termination points.
Given this confluence, the probability of a medium-to-long-term top forming here is elevated. Once wave 5 completes, a corrective phase is expected, potentially retracing towards the midline or lower boundary of the channel. The projected path (blue arrows) anticipates a significant decline, consistent with the completion of a full impulsive cycle.
Key Points:
• Structure: Impulse wave (5 of 5) nearing completion
• Confluence: Channel resistance + Fibonacci projection zone
• Outlook: High probability of reversal and corrective decline
• Targets: First support near $3,650, with deeper retracements possible toward $3,000–$2,800 if bearish momentum accelerates
This suggests caution for late long entries, as risk/reward now favors a corrective move.

Hellena | GOLD (4H): LONG to resistance area of 3448 (Wave 3).Dear colleagues, it seems that wave “2” has been formed and now we are seeing the development of wave ‘3’ of the higher order and wave “3” of the middle order.
I think we will see an update of the maximum of wave “1” at 3448.90. A slight correction to the support area of 3341.74 is possible, but there is also a possibility of a continuation of the upward movement without correction.
The target is the resistance area of 3448.
Manage your capital correctly and competently! Only enter trades based on reliable patterns!

BTCUSDT 111k first then UPHi fellow traders,
Here’s my current BTCUSDT view on the 4H chart, based on Elliott Wave principles.
After a corrective structure, we’ve seen a strong bounce, and price is now approaching a key area of interest. I’ve marked the zones I’m watching for potential buys and sells:
🟨 Lower box: Potential buy zone if price pulls back with a corrective structure.
🟨 Upper box: Area of interest for taking partials or looking for potential short setups, depending on how price reacts.
If momentum continues, we could see BTC pushing into the 125K region, which aligns with fib extensions from previous swings.
As always, I’m waiting for confirmation before making any entries.
Let me know what you see on your end!

XAU/USD – Bearish Momentum Building: Circle 2 Top In?OANDA:XAUUSD
We have now completed a 1-2-3-4-5 move to the downside (in white), followed by a counter-correction in the form of an A-B-C.
This may have already completed our yellow (Circle) Wave 2 🟡 — though it’s not confirmed just yet.
We still have two potential resistance levels at 3400 and 3418 that could serve as final topping points for Circle 2.
Today, we can also observe a break of structure with the white trendline being broken, adding further confirmation to the bearish outlook 🔻.
I am now tracking my 1-2-3-4-5 structure in yellow, which should unfold into Circle Wave 3 🟡.
Bias remains bearish, and I expect this move to develop in line with the yellow projection already shown on my chart.
If price breaks decisively above our Fibonacci resistance, the alternative scenario would be an ABCDE triangle formation that has potentially been forming over the past months — in that case, I’ll post a dedicated update 📌.
For now, I’m actively looking for sell setups and have already entered short positions ✅.

Price Analytics: $TRUMP's Potential Correction and Future RallyPossible Rebranding of an Existing Token: A Strategic Collaboration with the President
The recent announcement of the MEXC:TRUMPUSDT cryptocurrency has ignited discussions about its origin and its sudden rise to fame. Market data suggests that $TRUMP might not be entirely new but a rebranded version of an existing token. Historical price charts from exchanges like Gate.io and MEXC reveal trading activity for a $TRUMP-named token as far back as March 2024, long before the President’s public endorsement.
Rebranding an existing token in collaboration with a high-profile figure like the President offers several advantages:
Instant Market Hype: Association with a well-known personality generates massive publicity, attracting retail and institutional investors.
Enhanced Trust and Legitimacy: A presidential collaboration can shift market perception, making the token appear more credible.
Reviving Dormant Projects: Tokens with limited traction can leverage rebranding to reignite interest and trading activity.
If the MEXC:TRUMPUSDT token is indeed a rebranded project, its association with the President has proven successful, as evidenced by its meteoric rise in value to $72 shortly after the announcement.
Current Analysis:
The MEXC:TRUMPUSDT token is currently trading at $72, experiencing a surge due to its high-profile launch. However, considering historical data and market patterns, a price correction to the $37–$40 range is likely. This range aligns with the previous all-time high (ATH) of $37–$38 recorded on March 5, 2024.
Short-Term Projection:
If the token revisits its previous ATH, this retesting could act as a strong support level. Historically, price corrections to significant levels often precede larger upward movements, as they confirm market confidence in these levels.
Long-Term Projection:
Assuming the token completes the #5 Wave of the Elliott Wave cycle, it could potentially surpass the $100 mark. The Elliott Wave theory suggests that the fifth wave is often driven by strong market sentiment and euphoria, fueled by both technical and fundamental catalysts.
Conclusion:
While the MEXC:TRUMPUSDT token's current momentum is undeniable, investors should anticipate a near-term correction to $37–$40 before a rally beyond $100. This projection combines historical data, technical analysis, and the hype surrounding its rebranding and presidential collaboration. However, as with any volatile asset, investors should exercise caution and conduct thorough due diligence.

ETH is ready to Drop Sharply Now it time to Short ETH, a big drop is going to start .
Fasten your seatbelt

FETUSDT|C&H Setup +100% Breakout MA cluster-A High Quality BreakCup&Handle setup with a high quality breakout the confluent MA cluster—especially the 200-day— as the gatekeeper.
If price hold above the ma200 (and the nearby 20/50) cluster a high-quality breakout and more likely to break the handle and the cup rim.
Here is how I’d weigh it and trade it: DON'T WAIT FOR CUP RIM BREAKOUT
Priority of BUY signal strength indication:
1. Daily close & hold above the ma200 dynamic resistance the most institutions watch - follow BUY
2. Cup handle breakout watch for volume expansion on the break (> 20-day average)
3. Cup rim breakout with a golden cross ma20 reclaim > ma50 curl up is a follow-through BUY
Decision matrix:
- Breaks above key fib level - look for a shallow retest of the breakout line / MA bundle at key fib zone 38.2% - 61.8% liquidity zone for proper trailing stop / limit order.
Target
- TP1 100% fib zone (+50%)
- TP2 extended 161.8% (+100%)
SL slightly below previous low
RR: 3:1
Always trade with affordable risk and respect your stop!

HAPPYUSDTBased on the overall output of these analyses, spot buying of this cryptocurrency around 0.001 to 0.00088 is reasonable and less risky. As long as these levels are valid, we can expect the price to grow in the form of wave C.
The ideal target of wave C could be around 0.0047.. which has a very attractive range of movement.
Mid-September could be a reasonable time to complete wave B and start the hypothetical wave C.. Also, important times are clear on the chart.
This is just a scenario. Only if the price reaches these areas by re-examining the market can we look for buying.
It should also be noted that this cryptocurrency is an anonymous meme coin with a very small market cap and carries a lot of risk.
HLong

Is Gold (XAUUSD) finally ready to rally?Gold has been in a corrective phase since April 2025. The broader complex correction or triangle formation now appears to be complete, and a high-probability bullish signal is emerging.
On the 1-hour chart, a clear 5-wave impulsive pattern has unfolded. I expect one more pullback to complete a 3-wave corrective move for Wave 2, ideally retracing toward the prior Wave 4 zone.
If this scenario plays out, it would provide a high-conviction entry ahead of a potential Wave 3 extension.
However, if price continues its current momentum and closes above $3,390 (the end of Wave 1), I’ll consider that Wave 2 may already be complete, in which case I would look to enter on confirmation of breakout strength (strong RSI reading).
