SOL big picture: All Time High again in this cycle?
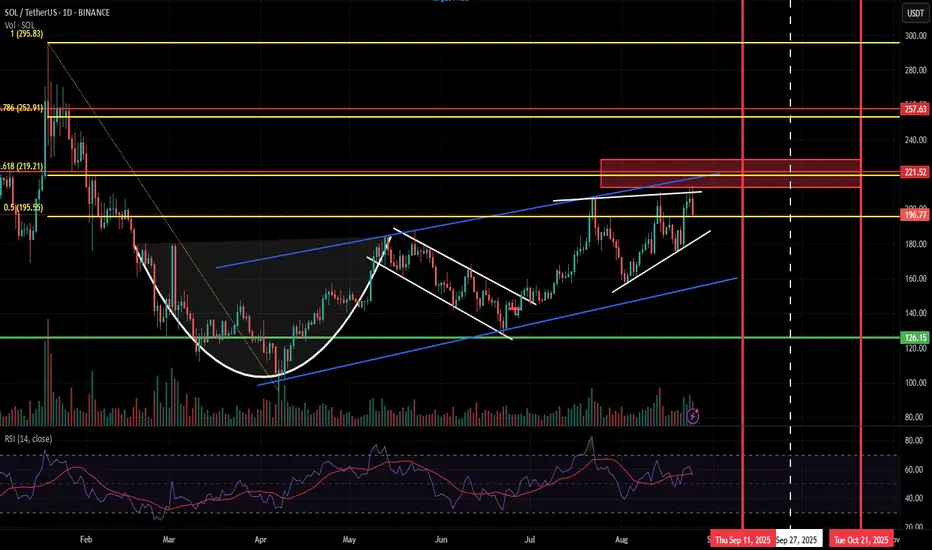
Solana has being showing strength in its price action recently compared to top 10 altcoins (in MarketCap) within the past few days, yet failing to break the strong resistance within 200 and 220. Bears have consistently defended this region while maintaining the price below the 0.618 Fibonacci level of the mid January - April price drawback.
Since then, the price has maintained an uptrend where the cup-and-handle pattern strongly playing out. But the the uptrend was restricted within a parallel channel (blue) and yet to be broken, which is a breakout to be played for SOL to break the 210 barrier. Price has been moving within a bearish wedge (white) during the months July and August, and still failed to confirm a positive breakout even after the price surge due to Jerome Powell's hint on rate cuts at annual economic policy symposium in Jackson Hole, Wyoming.
The current Bull Cycle is shortly coming to an end. Based on historical behavior, BTC reaches its ATH within 510 to 550 days from its recent halving which falls between mid-September to October end. BTC is supposed to go for an ATH within this region and September rate cuts can be a good fuel to reach this target. Mostly we will be having a short altcoin season for this cycle with a probability of an extension until year end (November or early December).
Statutory 240-day deadline for VanEck and Franklin SOL ETF applications will conclude by October 2025. As reported by Coinpaper, the final deadline has been set to October 16, 2025 for five Solana ETF applications. (source: coinpaper). These positive news can align with the last phase of the Crypto Cycleand trigger new ATH for SOL. Price will take a downturn if Bulls progressively struggle to break the parallel channel resistance by this time, marking the end of the current cycle.
So, a high probability exist for SOL to reach new ATHs with caution on the overall market sentiment within the coming 2 to 4 months. As the time of writing, SOL is at 198.14 , plunged from a local high of 213.6.
Endofcycle
What does a bull market look like?Sir John Templeton said: “Bull markets are born on pessimism, grown on skepticism, mature on optimism, and die on euphoria.”
Pessimism:
Following the 2008 crisis, the global economy was engulfed in a cloud of pessimism. Investors were gripped by fear and uncertainty as financial institutions crumbled, economies contracted, and unemployment soared. Stock markets experienced significant declines, and investors became cautious, bracing themselves for further turbulence. This initial stage of pessimism laid the foundation for the birth of a new bull market.
Skepticism:
As the dust settled and economies started to stabilize, skepticism took hold. Investors remained cautious, wary of another downturn and skeptical about the sustainability of the recovery. However, as central banks and governments implemented unprecedented monetary and fiscal stimulus measures QE1,2 & 3, confidence began to slowly seep back into the markets. Gradually, investors started to see signs of improvement, albeit with a sense of skepticism.
Optimism:
The bull market gained momentum as skepticism transformed into optimism. Economic indicators started showing signs of recovery, corporate earnings improved, and investor sentiment shifted towards a more positive outlook. This stage witnessed increased buying activity, as investors sought to capitalize on the upward momentum. As the market continued to rally, optimism became the prevailing sentiment, driving prices higher.
Euphoria:
The final stage of a bull market is characterized by euphoria, a state of extreme excitement and irrational exuberance. During this phase, investors become overly optimistic, disregarding potential risks and buying into the market frenzy. This euphoria is often fueled by widespread media coverage and the fear of missing out (FOMO). In this stage, valuations may become detached from underlying fundamentals, leading to excessive speculation and a heightened risk of a market correction.
Conclusion:
Since the last cycle low established during the 2008 crisis, we have witnessed the birth and evolution of a remarkable bull market. From the depths of pessimism and fear, it grew through skepticism and optimism, ultimately reaching a state of euphoria. It is essential for investors to recognize these stages and exercise caution, especially during the euphoric phase when markets may be prone to excessive speculation and unsustainable valuations. While bull markets provide ample opportunities for wealth creation, it is crucial to remain vigilant and focus on long-term investment strategies that align with underlying fundamentals. By understanding the cyclical nature of bull markets, investors can navigate the ever-changing landscape of financial markets with greater confidence and resilience.
Reference of Nasdaq:
E-mini Nasdaq-100 & Opt
Minimum fluctuation
0.25 index points = $5.00
Micro E-mini Nasdaq-100 Index & Opt
Minimum fluctuation
0.25 index points = $0.50
Disclaimer:
• What presented here is not a recommendation, please consult your licensed broker.
• Our mission is to create lateral thinking skills for every investor and trader, knowing when to take a calculated risk with market uncertainty and a bolder risk when opportunity arises.
CME Real-time Market Data help identify trading set-ups in real-time and express my market views. If you have futures in your trading portfolio, you can check out on CME Group data plans available that suit your trading needs www.tradingview.com

My time is running outTime,Time,Time
Where are we in time? At the beginning of new digital era but at this time the masses are all in and in my lifetime i need to time the market so i can have the biggest % return of my time-money spent. Do not be greedy with your time, spend it wisely...

Nasdaq Correction Time?The Nasdaq has been been enjoying a bull run for the last 12 years. The average market cycle is between 11-14 years (based on history). With imminent inflation in the US, I feel that this may be the end of this cycle. Commercial Real Estate is beginning to default at an alarming rate. Residential homes are extremely overpriced and near impossible to get. Still no state of the union address. The gov't also pushed back the update on the mortgage delinquency rate from March to June. Once everyone realizes that this current economy is built like a house of cards, I expect things to go down in a hurry. History usually repeats itself. I was too young to take advantage of the 09' crash. But i will be in position to take advantage of this crash.
NOT FINANCIAL ADVICE
DYOR

Market Crash to $0 - End Game (Elliot Wave Analysis)Elliott wave analysis shows we are currently completing the end of Wave B of the final market correction. Wave C could be heading down to zero very soon and very fast. The falsely inflated economic bubble is about to burst. The virus was simply an excuse to start the inevitable. Time to stop being greedy and just get out of this fake garbage. Remember why we are here. This is all prophesied. Soon every company will be bankrupt and everybody will be out of the job. Peace.

$DXY Weekly Chart. Directional change| #dxy #dollar #usdx The March ’08 advance is labeled as a corrective upswing, a Zig-Zag pattern. Using Fib-price ratio model for this pattern combined with internal price measurements, we have three fib-price ratios converging, heightening the probability that the five-wave sequence (i)-(v) has ended within the last C-wave (circle) of the corrective Zig-Zag pattern indicating the closing of a cycle. The end of the larger degree second-corrective wave 2(square) at 103.82 (61.8% of the first-wave drop (1 square)) is paving the way for the larger trend continuation.
After the completion of the internal fourth-wave correction (iv) of C(circle) which took the form of a triangle, price traded upwards with a 5-wave sequence till January 2017 high at 103.82, responded lower afterwards and has been declining since. Is this the case, then the scenario for the A-B-C (circle) Zig-Zag completion is corroborated as a triangle always occur in a position prior to the final actionary wave, in our case (v)-wave.
Having confirmed the reversal signature and witnessing a five-wave (i.-v.) price event coming to its completion labeled as 1, we have set our price target at 88.70(+/-) awaiting a reversal from that point, and price to go through some retracement rise.
Could that be the rally of strength during the post bubble contraction phase before the bubble burst? It remains to be seen. One thing for sure though, the next 1-2 years will be dollar’s recovery phase.
Thanks for your attention
Trade with Discipline
Best
