CRUDE OIL Local Short! Sell!
Hello,Traders!
CRUDE OIL is reacting from the horizontal supply area after liquidity above previous highs was taken. Expect continuation to the downside as the market rebalances toward the target level.
Sell!
Comment and subscribe to help us grow!
Check out other forecasts below too!
Disclosure: I am part of Trade Nation's Influencer program and receive a monthly fee for using their TradingView charts in my analysis.
Energy Commodities

Crude Oil is InflationOne of the best ways to gauge where inflation is heading is by tracking the relationship between crude oil prices and the U.S. Consumer Price Index (CPI).
If we take a moment to observe their movement from the 1980s to today, we can see that they have generally moved in tandem. The year of their peaks and troughs are in synchronization.
So, who is leading whom?
Is it the inflation data that drive crude oil prices higher or lower — or is it crude oil prices that influence the inflation trend?
WTI Crude Oil Futures & Options
Ticker: MCL
Minimum fluctuation:
0.01 per barrel = $1.00
Disclaimer:
• What presented here is not a recommendation, please consult your licensed broker.
• Our mission is to create lateral thinking skills for every investor and trader, knowing when to take a calculated risk with market uncertainty and a bolder risk when opportunity arises.
CME Real-time Market Data help identify trading set-ups in real-time and express my market views. If you have futures in your trading portfolio, you can check out on CME Group data plans available that suit your trading needs www.tradingview.com

Crude oil: Sell around 62.50, target 60.00-58.00Crude Oil Market Analysis:
Crude oil fell again, in line with our expectations. Today's crude oil price remains bearish. Sell on any rebound. The strategy for crude oil remains to follow the market. Consider selling if crude oil rebounds to 62.50 today. This level has been successfully suppressed. The impact of crude oil inventory data is only temporary. There are no recent data that will have a significant impact on crude oil prices. Focus on the impact of the Federal Reserve's monetary policy.
Fundamental Analysis:
The previous smooth Sino-US trade negotiations were positive for the US dollar, leading to a sharp drop in gold's safe-haven sentiment. Another major data point this week is the Federal Reserve's monetary policy.
Trading Recommendations:
Crude oil: Sell around 62.50, target 60.00-58.00.
Natural Gas - Did You Profit?Today natural gas saw some downside pressure.
We closed our KOLD long - which was our short trade on Nat Gas, netting over 8% gain.
Being nimble in the Nat gas market is key, as its a very choppy asset and gains can be lost very quickly.
Breaking below the 7 day MA needs to be watched closely as it does leave room for more downside.
Inventories lately have been lack luster and need to show some positivity before price start to gravity to the weekly trend.

USOIL Bearish swing tradeEntry from last higher low breakout
RRR 1:2
overall in bearish momentum
have touch it's major support zone before going up

Oil bounced from POC. Sanctions aganst russia did't push it upOil bounced from POC. Sanctions aganst russia did't push it up
which is so good for down trend)
in a case of retest of POC - u can take short trade with goals $55 and $49

MCX Crude Oil: Bearish Setup with 5550 PEMCX Crude Oil – November Contract
CMP: ₹5467
Bearish view
Bought 5550 Put Option (Expiry: 17 Nov 2025)
Target: ₹320 to ₹325
Target valid till 14 Nov 2025
Tracking price action closely. Will reassess if momentum fades or structure breaks.
#CrudeOilOptions #MCX #OptionsTrading #TradeSetup #PriceAction #TradingViewIndia #DerivativeStrategy #PutOption #ExpirySetup

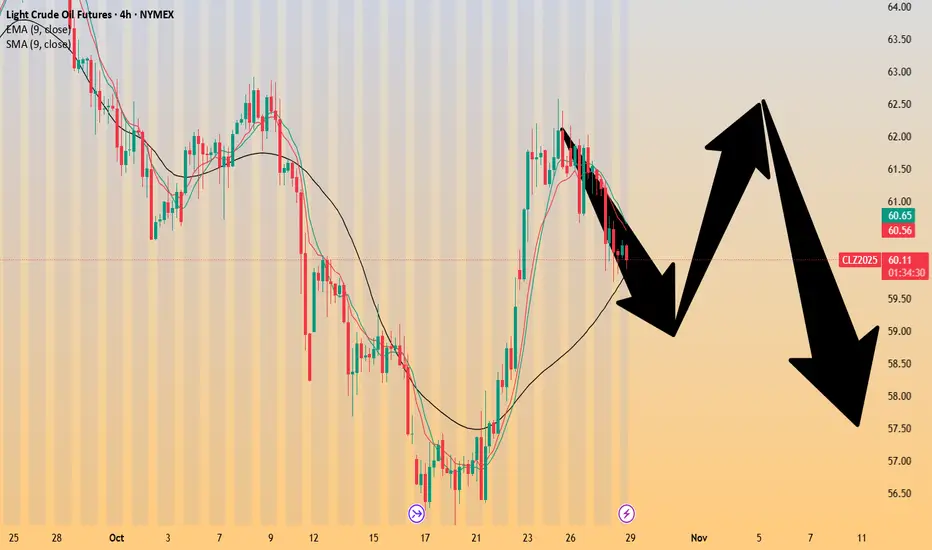
Crude Oil Long Idea (WTI, 15m)After an extended correction, WTI has reached the lower boundary of the ascending channel, where buying volume spikes are appearing. The market is testing support near $60.70–$60.50, aligning with the median line structure from previous swings.
A potential reversal setup may form if price holds above this zone and reclaims $61.20.
The first bullish target lies near $62.30–$62.60, followed by the upper channel resistance around $63.50.
Bias: short-term long within the broader bullish channel; invalidation if candle closes below $60.00.
In essence — buying oil at the lower edge of the channel, expecting a rebound toward midline resistance.

Crude oil: Sell near 63.00, targeting 60.00-58.00Crude Oil Market Analysis:
Crude oil has been volatile, with few significant unilateral moves. Today, we're focusing on short-term rebound opportunities. We recommend selling high and taking a bearish stance. The impact of crude oil fundamentals and news is short-lived. Previous inventory data support buying, but we should still sell as crude oil nears 63.00.
Fundamental Analysis:
The decline in gold prices is ultimately due to the fading of news, which has led to a decline in risk aversion. We will continue to monitor the Federal Reserve's new monetary policy.
Trading Recommendations:
Crude oil: Sell near 63.00, targeting 60.00-58.00.

CRUDE OIL Potential Short! Sell!
Hello, Traders!
CRUDE OIL Price is reacting to a clear Horizontal Supply Area after liquidity sweep above the recent swing high. Smart money positioning suggests a short-term redistribution phase as sell-side liquidity below $61 becomes the draw.Time Frame 4H.
Sell!
Comment and subscribe to help us grow!
Check out other forecasts below too!
Disclosure: I am part of Trade Nation's Influencer program and receive a monthly fee for using their TradingView charts in my analysis.

USOIL WILL FALL|SHORT|
✅CRUDE OIL/b] after engineering liquidity above the recent high, price reacted sharply from the 4H supply area, suggesting distribution by institutional players. With buy-side liquidity swept, the market now looks poised to rebalance inefficiency below the $61 handle. Time Frame 4H.
SHORT🔥
✅Like and subscribe to never miss a new idea!✅

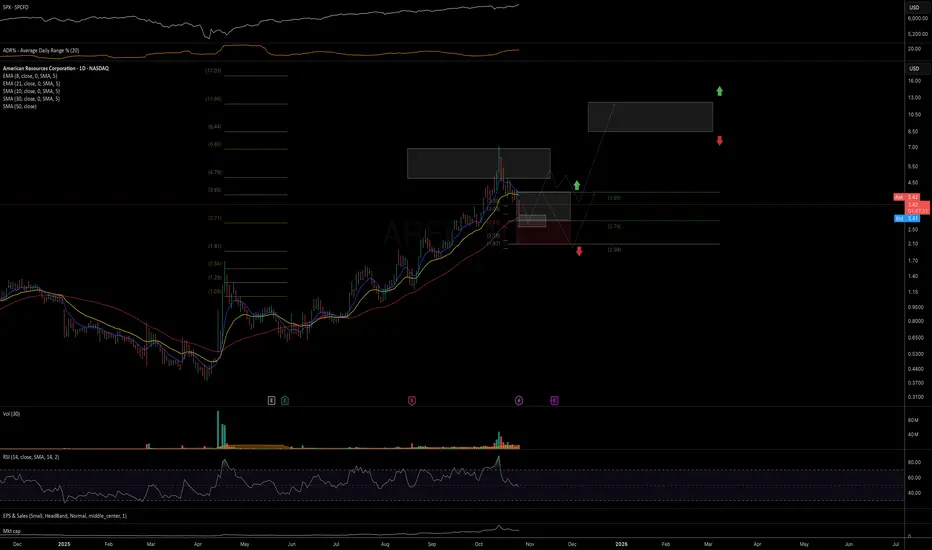
AREC potential trend structurePrice is showing a constructive mid-term trend structure, with price now testing a key support zone around 3.0–2.7–2.6. This area could serve as a potential higher low base for the next leg up toward the 8.5–12.0 resistance range.
As long as price continues to close above 2.57, I’ll be holding this trend structure with higher resistance targets in focus over the coming months.
Chart:
CL Crude Oil Short Supply-DemandSee Chart For Details.
Mainly a technical edge with price inside Daily supply + resistance and we have confirmation on lower timeframes.
Technicals = bearish
Fundamentals = Mixed
Sentiment = Mixed
Overall Slight edge I would say roughly 25% chance of 5:1

How about a big profit short trade in gold?
Hello everyone
The gold correction is still ongoing and we should wait for a good and beautiful correction.
If you want to make good profits from the market, just follow my page.
Don't forget to support me, friend!!!

USOIL – Daily Rejection & 4H Bearish Engulfing: Short Setup from 💬 Trade Description:
Price on **USOIL** recently pushed into a **daily supply zone** around the **62.00 area**, which had previously acted as a strong rejection point.
On the **daily timeframe**, a **clear pin-bar rejection** formed, showing that buyers lost control and sellers are stepping back into the market.
Dropping down to the **4-hour timeframe**, price created a **bearish engulfing candle** directly inside that same daily supply zone — confirming a strong **shift in momentum** and offering a precise entry opportunity.
This setup aligns perfectly with the **higher-timeframe bearish structure**, where the market continues to print **lower highs and lower lows**.
The reaction from the 62.00 zone suggests a potential continuation to the downside as price seeks liquidity near the **next major demand zone around 57.00**.
⚙️ Trade Breakdown:
* **Weekly Bias:** Bearish — market creating lower highs.
* **Daily Confirmation:** Pin bar rejection from daily supply.
* **4H Entry Trigger:** Bearish engulfing after retest.
* **Entry:** After 4H candle close.
* **Stop Loss:** Above the 4H engulfing high.
* **Take Profit:** Targeting 57.00 (next demand zone).
---
## 🧩 Technical Insights:
* The **daily pin bar** served as higher-timeframe confirmation that sellers were defending a premium level.
* The **4H engulfing** offered an early confirmation of short-term structure shift.
* The **trade idea** follows a simple, high-probability model:
**“Daily confirmation → 4H execution → Patience for follow-through.”**
---
## 💭 Trader’s Note:
Patience was key on this one. I waited for the daily signal first before dropping to the 4H to catch the clean bearish momentum. This is how I’m structuring all my trades now — only executing when the higher-timeframe aligns with the lower-timeframe trigger.
Discipline > Frequency.
Quality > Quantity.

USOIL SELLERS WILL DOMINATE THE MARKET|SHORT
USOIL SIGNAL
Trade Direction: short
Entry Level: 61.87
Target Level: 58.58
Stop Loss: 64.06
RISK PROFILE
Risk level: medium
Suggested risk: 1%
Timeframe: 6h
Disclosure: I am part of Trade Nation's Influencer program and receive a monthly fee for using their TradingView charts in my analysis.
✅LIKE AND COMMENT MY IDEAS✅

Crude oil - Sell around 63.60, target 61.00-58.00Crude Oil Market Analysis:
Crude oil inventory data triggered a surge in buying. The daily price rebounded to around 60.00 after two sessions. The current daily chart suggests selling pressure remains. This week, our outlook remains bearish. I predict a corrective rebound this week, followed by continued declines in the second half of the week. Crude oil is unlikely to see a significant rebound, so continue selling. Sell if it rebounds to around 63.60 today.
Fundamental Analysis:
For fundamentals, we're focusing on key data and geopolitical developments. This week will feature the Federal Reserve's significant interest rate decision, and the market currently anticipates continued easing.
Trading Recommendations:
Crude oil - Sell around 63.60, target 61.00-58.00

WTI(20251027)Today's AnalysisMarket News:
① September's US CPI fell short of expectations across the board, leading traders to bet on two more Fed rate cuts this year.
② White House National Economic Council Director Hassett stated the data was "excellent," indicating slowing inflation and easing pressure on the Fed.
③ The White House stated that inflation data may not be released next month, a first for the time being. Technical Analysis
Technical Analysis:
Today's Buy/Sell Levels:
61.54
Support and Resistance Levels:
62.86
62.37
62.05
61.03
60.71
60.22
Trading Strategy:
If the market breaks above 62.05, consider entering a buy position, with the first target at 62.37.
If the market breaks below 61.54, consider entering a sell position, with the first target at 61.03.

Crude oil analysis and trading strategiesAffected by the U.S. sanctions on Russia and India's reduction in crude oil imports from Russia, coupled with the boost to demand from the easing of trade tensions, crude oil prices have rebounded significantly amid multiple uncertainties.
From the daily chart perspective, after oil prices touched around the 56 level, the candlesticks closed three consecutive bullish candles, successfully regaining the losses from the previous decline.
Oil prices have broken above the moving average system, and the medium-term objective trend has shifted from a downward direction to a transition phase. The MACD indicator has opened upward below the zero line, indicating that the bearish momentum is weakening. It is expected that the medium-term trend of oil prices will gradually pick up, but a clear medium-term bullish pattern has not yet been formed. From the 1-hour short-term trend, oil prices have risen for three consecutive trading days, breaking through the 60 level and reaching a high above 62. The current moving average system shows a bullish arrangement, providing support for oil prices, and the short-term trend is generally upward.
During the early trading session, oil prices fluctuated slightly within a high-level range. It is expected that the intraday crude oil trend will continue the upward rhythm. Based on comprehensive analysis, the trading strategy for crude oil today is recommended to focus on buying on dips.
Resistance Levels:61.50, 62.00, 63.00
Support Levels: 59.50, 59.00, 58.50

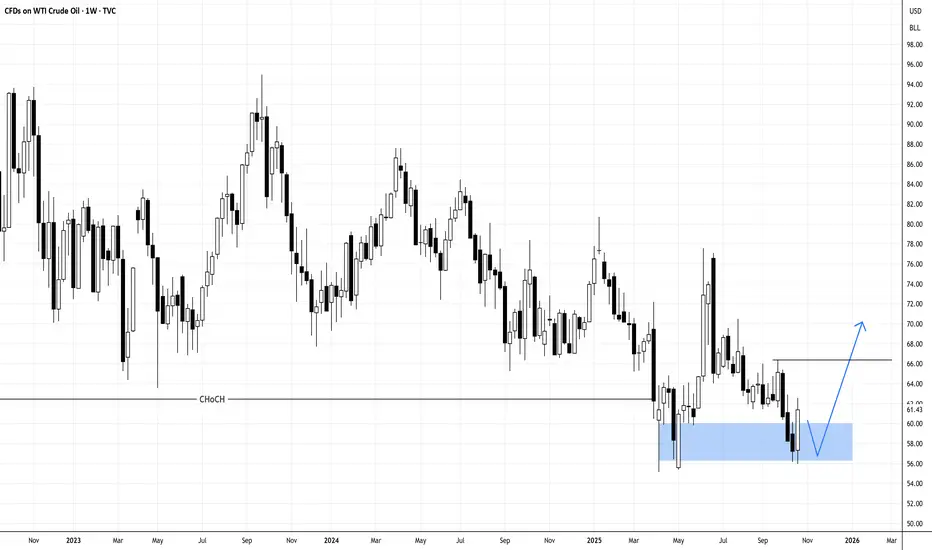
USOIL IN DOUBLE BOTTOM, MAYBE TARGETING ABOVE 66Oil may have found temporary bottom with the weekly double bottom.
N.B!
- USOIL price might not follow the drawn lines . Actual price movements may likely differ from the forecast.
- Let emotions and sentiments work for you
- ALWAYS Use Proper Risk Management In Your Trades
#usoil
#ukoil
Daily Outlook on Surge Energy (SGY)In this outlook I am providing a daily chart update of the previous weekly outlook. Since the weekly outlook was posted TSX:SGY has moved higher in an impulse, after which we have had a shallow correction, SGY could be about the break out of that correction. The correction has reached the 38.2% retracement of a or i and price has also reacted at the 100% extension within the sub waves of the wave b or ii flat pattern correction (not shown on this timeframe). Oil is making a move higher, so SGY could follow it. More comments on the chart.

Gold | Oil | Dollar | Silver | Natural Gas Price ForecastGold | Oil | Dollar | Silver | Natural Gas Price Forecast
AMEX:BOIL AMEX:KOLD NYMEX:CL1! COMEX:GC1!

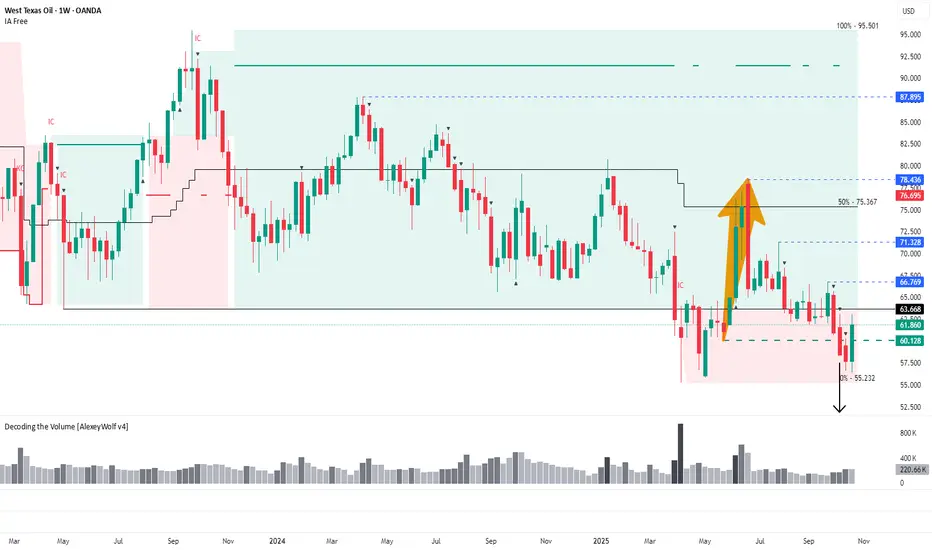
WTI: Possible reversal after false breakout of 60.128Weekly range structure may define oil’s direction for the coming months — buyers defend key support, while targets above 66.769 remain in focus.
Hi traders and investors!
This analysis is based on the Initiative Analysis (IA) concept.
On the weekly timeframe, a sideways range has been in place since April 2023, followed by a transitional phase.
Sellers managed to push the price below the lower boundary of this range — the first breakout occurred in March 2025.
After that, buyers brought the price back inside the range and reached the 50% level of the trading zone, from where sellers resumed control and once again pushed the price below the lower boundary at 63.668.
What’s interesting here is that earlier there was a buyer’s move returning the price into the range, with its base around 60.128.
We now see a seller candle attacking this level on high volume, followed by another seller candle with even higher volume, after which the price returned above 60.128.
This behavior may signal a false breakout (manipulation) of that level.
If this interpretation holds, the next potential upside targets are:
66.769 — first target,
71.328 — second target,
78.436 — third target,
followed by 87.895 and possibly 95.501.
Key points to watch:
whether buyers defend the 60.128 level if the price pulls back,
and whether they manage to break through the range boundary at 63.668, and then 66.769
.
If buyers succeed in holding above these two levels, the buyer’s vector is likely to continue developing toward the mentioned upside targets.
Wishing you profitable trades!