Engulfing Candlestick Pattern : ENGULFING PATTERN is often considered a "reversal pattern", but it is not always so, this model can be considered a simple pause of the major trend.
An engulfing pattern is an excellent trading opportunity because it can be easily spotted and the price action indicates a strong and immediate change in direction. In a downtrend, an up candle real body will completely engulf the prior down candle real body (bullish engulfing). In an uptrend a down candle real body will completely engulf the prior up candle real body (bearish engulfing).
- A high probability price action approach for trading bullish and bearish Engulfing patterns is to look for the pattern to appear at important support and resistance levels.
- The best place for a stop loss order in an Engulfing trade is beyond the Engulfing pattern extreme. This would mean that if the Engulfing setup is bullish, the Stop Loss order should be placed under the lower candlewick of the engulfing candle. If the Engulfing setup is bearish, then the Stop Loss order should be located above the upper candlewick of the engulfing candle.
What is the first TARGET :
We hope to have been useful!
Thank you for your support and trade with care!
Engulfingpattern

EMBR3 gives a bullish Engulfing reversal in week timeframeEMBR3 gives a bullish Engulfing reversal in week timeframe.

NZDJPY SHORT term (retest Trendline + pattern)-NZDJPY SHORT term
-retest of the Trendline + pattern (Bearish Engulfing)
-38,2% Fibonnacci retracement
Follow me for Daily analysis !

NQ / NASDAQ / SP500 - Preparing for bullish buy signalsThe QQQ have been on a tear for about a week now. If you we're watching my analysis from 3-4 weeks ago you were aware of the inside bar setup that I was waiting for a bullish breakout of. Although we had a false break down on 5/23, price immediately recovered and the bullish breakout that I had been predicting did ensue. The price action on 5/23 produce a very bullish Inside-Bar/False Break pattern as well as a bullish engulfing bar, all above a critical support level. This generated a number of overlapping buy signals that many of you, including myself ended up going long on. I cashed out as price approached upper resistance and now we can see price has begun to pull back a bit. I will be watching for price to fall back to the support zone and then new bullish buy candlestick patterns to form such as a bullish pin bar, bullish engulfing bar or inside-bar. As long as price remains above 7,000 I am going to be strongly bullish and be watching for any signals to get long with the trend.

NZDJPY - Engulfing Pattern on Weekly chartOn the chart we can see that an engulfing bearish candle has formed. As a pretty reliable sign of trend reversal/continuation I suggest placing orders with a Bearish sentiment. The zone highlighted in green might be tested next week.

(DAILY) EURUSD (SHORT)-Description
bearish engulfing pattern formed on the daily time frame.
inside bar formation also formed.
my bias currently is a short swing trade short till price reaches support level

ALK - Alaska Air on the radarAlaska Air is currently trading at the top of its downtrend channel, a bearish engulfing pattern is currently forming (although we'll need to wait for the close to confirm) and the RSI has already turned down from a high level....

Eur/Jpy bloody sellEurjpy marked an engulfing pattern on a monthly chart, one of the best simple techniques to determine a trade.
i suggest to wait for a pullback so that stop loss would be acceptable. shorts may be targeting 118 at first then 113.
good luck!!!!


USDCAD 15M Long | Engulfing PatternCandle Pattern: engulfing
Trend: up
Trend Entry: with
TP/SL Ratio Target: 1 to 1
Target TP PIPs: 16
SL PIPS: 16
Fib Entry: 1
Fib TP: 2
Stochastic: overbought
Inside EMA/SMA zone: no
BB: top band
Notes:
breaish engulfing to break the recent high, looking for a push to a new high
using stochastic overbought indication as indicator price will push even higher before rolling overbought

NZDUSD 15M Long | Engulfing PatternCandle Pattern: Engulfing
Trend: down
Trend Entry: against
TP/SL Ratio Target: 1 to 1
Target TP PIPs: 10
SL PIPS: 10
Fib Entry: .382
Fib TP: 1.382
Stochastic: oversold
Inside EMA/SMA zone: no
BB: middle band
Notes:
fib down swing to the .764 then showing a bullish engulfing. Stochastic showing oversold at a higher low than previous low.

NZDUSD 15M Long | EngulfingCandle Pattern: Engulfing
Trend: down
Trend Entry: against
TP/SL Ratio Target: 1 to 1
Target TP PIPs: 10
SL PIPS: 10
Fib Entry: na
Fib TP: na
Stochastic: overbaught
Inside EMA/SMA zone: yes
BB: top band
Notes:
lets try doing the opposite

EURUSD 15M Short | Evening Star / Engulfing PatternsCandle Pattern: Evening Star / Engulfing
Trend: up
Trend Entry: Against
TP/SL Ratio Target: 1 to 1
Target TP PIPs: 1
SL PIPS: 10
Fib Entry: 76.4%
Fib TP: 61.8%
Stochastic: overbought
Inside EMA/SMA zone: no
BB: top band
Notes:
evening star / bearish engulfing after several dojis and engulfings prior.
Lets see if this one can give at least 10 pips

USDJPY 15M | Engulfing + 3 White Soldiers LongCandle Pattern: Engulfing + 3 White Soldiers
Trend Location: Bottom end of trend location
TP/SL Ratio Target: 1 to 1
Estimated PIPs: 30

USDCHF 30M | Engulfing LongCandle Pattern: Engulfing
Trend Location: Bottom end of trend location
TP/SL Ratio Target: 1 to 1
Estimated PIPs: 20

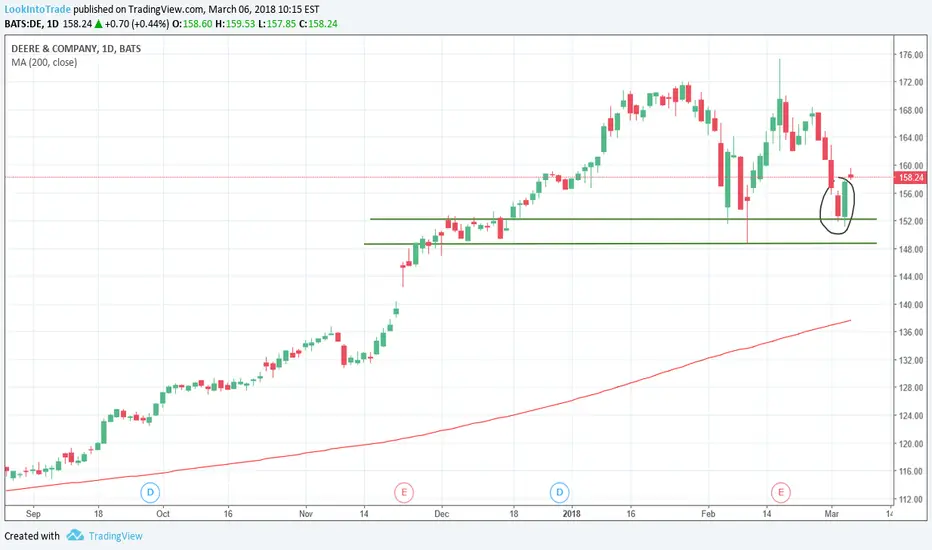
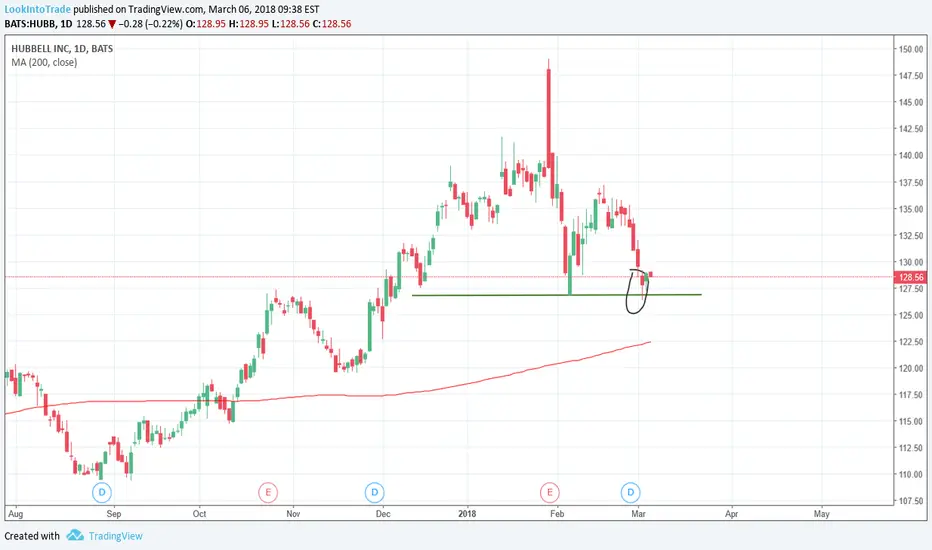
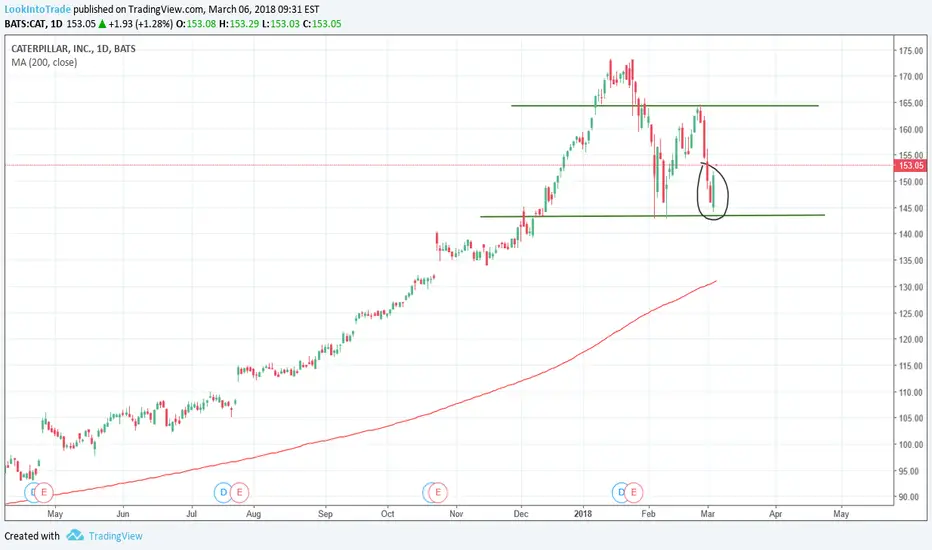
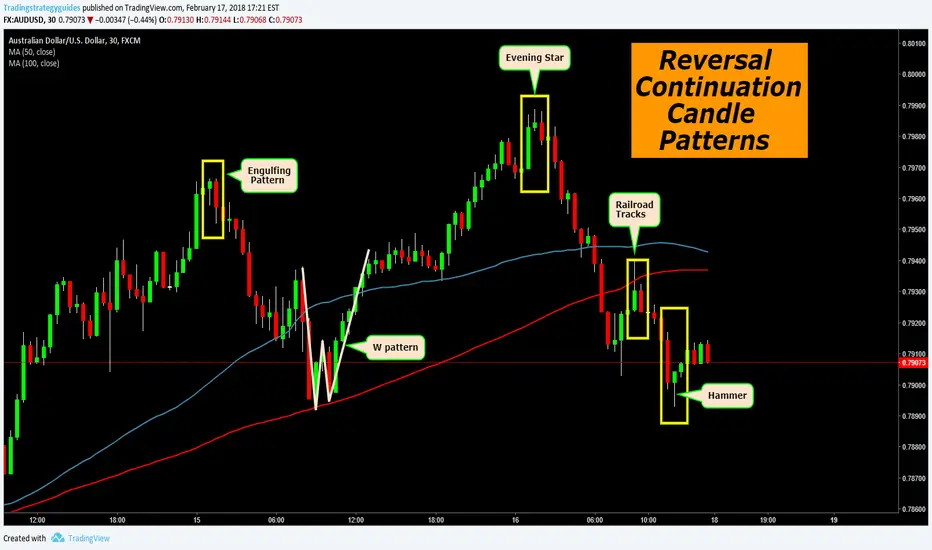
Reversal Continuation Candle patternsThese are the "GO" reversal continuation candle patterns I use when I am using the Break-Hook-Go pattern.

CONE: Engulfing bullish patternEngulfing bullish pattern in CONE. Right now the price has actually dropped: perhaps it is a buying opportunity?


FIZZ: Engulfing bullishEngulfing bullish pattern in FIZZ (and a hammer the day before!). Looks very bullish.
