ENJ/USDT — At Demand Zone, Could This Be the Next Major Rebound?📊 Overview:
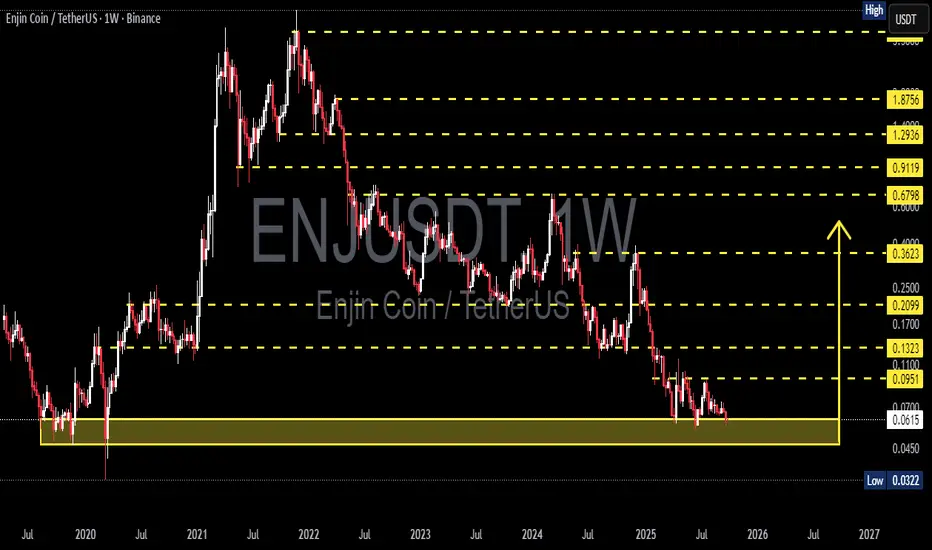
Enjin Coin (ENJ) is now sitting at one of the most crucial levels in its history. Price is consolidating within the 0.045 – 0.070 USDT demand zone, the very same area that once served as the launchpad for the massive 2020–2021 rally.
After years of decline since its 2021 peak, ENJ is once again retesting this key zone. The big question: Will this mark the beginning of a new accumulation phase and bullish cycle, or will we see a breakdown into new lows?
---
Structure & Chart Pattern
📉 Primary Trend: Multi-year downtrend since the 2021 ATH (lower highs & lower lows).
📌 Critical Zone: 0.045 – 0.070 USDT demand zone (highlighted in yellow), historically strong support.
📈 Key Resistance Levels: 0.095 – 0.11 – 0.132 – 0.21 – 0.36 → potential upside targets if a rebound occurs.
📉 Extreme Support: 0.0322 → the all-time low, in case of breakdown.
---
Bullish Scenario (Potential Rebound / Accumulation)
1. Price holds above 0.045 – 0.070 USDT → confirming demand is active.
2. A breakout above 0.095 – 0.11 USDT → would be the first signal of a medium-term trend reversal.
3. Bullish upside targets:
🎯 0.132 (minor resistance)
🎯 0.2099 (key swing high)
🎯 0.3623 (strong bullish confirmation)
4. With strong momentum, further expansion could push price towards 0.679 – 0.91 USDT, which were major distribution zones in the past.
In short, this area offers a potential “discounted entry” if the bullish scenario plays out.
---
Bearish Scenario (Continuation of Downtrend)
1. Weekly close below 0.045 → failure of the demand zone.
2. Next downside target: 0.0322 (historical low).
3. A breakdown here strengthens the continuation bearish structure, possibly leading to prolonged sideways movement at low levels before any recovery attempt.
---
Conclusion & Key Notes
ENJ is now at a golden demand zone that will decide the long-term direction.
Aggressive traders may consider scaling in small positions in this zone with a tight stop below 0.045.
Conservative traders may prefer waiting for a confirmed breakout above 0.095 – 0.11 before entering larger positions.
Risk/Reward looks attractive here, but remember: the macro trend is still bearish, so risk management is crucial.
---
"Markets often give second chances at historical levels. ENJ is back to the same area where its last major rally began in 2020. Will history repeat itself with a new bullish cycle, or will we witness fresh lows? This is where patience and risk management make all the difference."
---
#ENJ #ENJUSDT #EnjinCoin #CryptoAnalysis #CryptoTrading #Altcoins #SupportResistance #CryptoRebound #CryptoBearish #CryptoBullish #AccumulationZone
Enjusdtanalysis
ENJUSDT —Make-or-Break at Multi-Year Demand: Rebound / BreakdownOverview
Timeframe: Weekly (1W), Binance
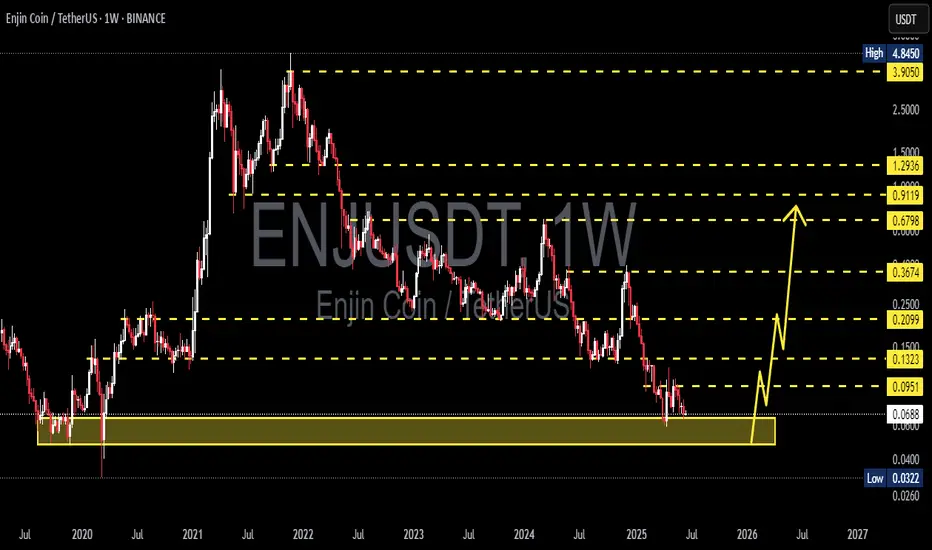
Price is sitting inside a multi-year demand zone $0.055–$0.095 with midpoint around $0.068.
Larger structure still showing lower-highs since 2021 peak, but currently in sideways range at the historic 2019–2020 base.
Key resistance levels: $0.095, $0.132, $0.2099, $0.30–0.362, $0.450, $0.6798, $0.9119, $1.2936.
Key support: $0.068, $0.055 (bottom of the box). Historical low marked at $0.0322.
---
Pattern & Context
Pattern: Sideways Accumulation/Base forming above the $0.055–$0.095 zone. Multiple touches confirm defensive buying, but no higher-highs yet on weekly.
Implication: As long as price holds inside or above the zone, mean reversion rallies remain possible. A clean breakdown below the zone confirms continuation of the macro downtrend.
---
Bullish Scenario
1. Conservative (reclaim range):
Trigger: Weekly close above $0.095.
Validation: Retest of $0.095 holds as support → move towards $0.132 then $0.2099.
Extension: Break and hold above $0.2099 → next targets $0.30–$0.362, then $0.450 and $0.6798.
Invalidation: Close back below $0.095 after reclaim.
2. Aggressive (buy the box):
Idea: Accumulate within $0.055–$0.068 with tight stop below $0.055.
Initial target: $0.095 → $0.132.
Note: Possible wick into the bottom of the box before reversal.
---
Bearish Scenario
1. Breakdown of demand zone:
Trigger: Weekly close below $0.055.
Impact: Opens path towards $0.0322 (historical low).
2. Rejection at upper edge:
Rejection at $0.095–$0.132 could send price back to $0.068 and $0.055.
Invalidation (short-term bearish): A strong close above $0.132, shifting structure to more neutral-bullish.
---
Key Levels to Watch
Support: $0.068 → $0.055 → $0.0322
Resistance: $0.095 → $0.132 → $0.2099 → $0.30–$0.362 → $0.450 → $0.6798 → $0.9119 → $1.2936
Risk Management: Always use weekly close confirmation and set clear invalidation (e.g., below $0.055 for long bias). Volatility on altcoins remains high.
#ENJ #ENJUSDT #Enjin #CryptoAnalysis #PriceAction #SupportResistance #SupplyDemand #WeeklyChart #Altcoins #RiskManagement #DYOR #NFA

ENJUSDT 1W AnalysisENJ ~ 1W Analysis
#ENJ Buy back gradually from this support block with a short-term target of at least 20%++.
ENJUSDT 1D AnalysisENJ ~ 1D Analysis
#ENJ Buy after successfully breaking through this resistance line with a short-term target of at least 10%+.

ENJ Spike 63% Gearing For 300% Surge Amidst Bullish Flag PatternThe price of Enjin coin ( NYSE:ENJ ) broke out of a bullish flag pattern surging 63% for the past 24 hours. With growing momentum, the asset is gearing for a 300% breakout.
One key factor contributing to the surge is the launch of the Enjin NFT SDK, which enables seamless integration of non-fungible tokens (NFTs) into various platforms, paving way for NFT's on the ENJ ecosystem.
As of the time of writing, NYSE:ENJ is up 19% setting the course for a 300% breakout. The asset has formed a perfect bullish flag pattern with the ceiling of the pattern already broken, NYSE:ENJ will be aiming for the $0.32 resistant and beyond.
With growing momentum as hinted by the RSI at 71.89, NYSE:ENJ might just be the asset to look out for this week.
What is Enjin ( NYSE:ENJ )
Enjin is a blockchain platform that makes it easy for developers to integrate NFTs and digital assets into their games and apps.
The platform provides tools for creating wallets, minting tokens, and managing transactions without requiring users to understand complex blockchain technology.

ENJUSDT 1WENJ ~ 1W Analysis
#ENJ Buy gradually from here if you still have a Conviction on this coin with a short -term target of at least 20%+.

ENJUSDT 1WENJ ~ 1W Analysis
#ENJ If you still have a Conviction on this coin. Maybe this support you can consider to start buying back with a short -term target of at least 20%+.

ENJUSDT 1WENJ ~ 1W Analysis
#ENJ re-testing this support, If you still have Conviction on this coin, buy from here with a target of at least 20%++

ENJUSDT LONG TERM ACCUMULATIONENJUSDT ACCUMULATION
have been using ENJ services for years now as a wallet user, have been very satified with the services provided, hence its one of its working proiduct , i would bet on them for a bright future.
Previous Idea:

ENJUSDT 1WENJ Update ~ 1W
#ENJ At Time Frame 1W,. Once again it was rejected from this resistance line. If you still have Conviction on this coin,. You can start buying gradually at the current price. or if you want to play more safely,. You can buy on this support block..
these two scenarios with a minimum target of 20%+

ENJUSDTENJ ~ 1W
#ENJ If you have Conviction on this Coin,. This is the right time to make purchases in stages.

ENJUSDTENJ ~ 1W
#ENJ If you have Conviction on this Coin,. This is the right time to make purchases in stages.

ENJUSDTENJ ~ 1W
#ENJ If you have Conviction on this Coin,. This is the right time to make purchases in stages.

ENJUSD 1WENJ ~ 1W
#ENJ The price returns to the support block zone. Accumulate again from here, with a minimum target of 20%+

ENJ USDT Long Idea - Bullish Reversal ENJUSDT 4-Hr TF. Bullish Reversal
We observe a budding shift from a prevailing downtrend to potential bullish momentum.
Key support and resistance levels have been mapped, indicating areas of significant market interest.
Price Action:
Recently, the price has shown an upward momentum, creating a series of higher lows and higher highs, which suggests a potential shift in trend from bearish to bullish.
The recent pattern of higher lows and highs could suggest an imminent trend reversal.
Our strategy recommends a long entry at 0.5685, with a conservative stop loss at 0.4270 to safeguard against unexpected downturns. Profit targets are set at 0.5300 and 0.5500, aligning with major resistance zones.
The RSI presents a neutral stance with a bullish bias as per the moving average crossover. Traders are advised to monitor these levels and adjust positions accordingly to market dynamics."

ENJUSDT 3D LONG📈Hello everyone. Timeframe 3 days. ENJUSDT is at strong support and has formed a triangle. The output can be strong. I am considering going long on a breakout/retest of a trend line. Marked goals and levels.

ENJ/USDT Could ENJ break the pattern or downward to the demand??💎 ENJ has recently experienced significant developments in the market. Currently, there's potential for ENJ to reach the demand and initiate an upward movement.
💎 However, if ENJ breaks the pattern without a retest at the demand, it may undergo upward momentum, targeting the supply area. A successful breakout of the supply area, probability could lead to an easy movement toward our target on the bearish OB.
💎 On the contrary, if ENJ fails to break out of the pattern, there's a likelihood of continued downward movement. Retesting the demand area becomes crucial for ENJ to gain momentum, break the pattern, and resume its upward trajectory.
💎 In the scenario where ENJ doesn't exhibit a positive response at the demand, lacking a bounce or favorable candle formations, it raises concerns about losing demand. This bearish momentum could lead ENJ to continue its downward trajectory, revisiting the bottom support levels.

ENJ LONG IDEAThe price made a nice retest, and we expect it to rise to the $0.37 level.
Take your risk, make some profit !

ENJUSDT - W1\D1ENJUSDT
W1 - The price was able to break through the high of the first wave, which may mean the implementation of the 3rd wave. The best option for considering purchases is to wait for the level of the first wave to be fixed or for a retest to D1 at the level of 0.3319. When implementing the idea, you can expect a target at the level of 0.5451
D1 - you can wait for a corrective movement within 50% of the previous impulse and expect the formation of the 5th wave - from levels ~0.3172 with targets up to 0.3942
What can you expect?
Expect the formation of the 5th wave - from levels ~0.3172 with a small risk on the idea with a target of 0.3942
Cancellation of the idea when fixing behind the trend line 0.2991
Long
Targets 0.3407 - 0.3652 - 0.3942

ENJUSDT - W1\D1ENJUSDT
The price was able to break through W1 - the trend line. The best option for considering purchases is to wait for the trend level to be fixed; a more convincing option for purchases would be a retest of this level of 0.2390.
If the price is not fixed behind the trend line, you can expect the price to move down to the level of 0.2040 - from which you can expect a rebound and consider buying.
What can you expect?
If successful fixation behind the trend line, you can consider entering from the nearest levels of 0.2390 with a small risk on the idea with a target of 0.3670
It is better not to take increased risks; a correction is being traded. Cancellation of the idea when the low of the 2nd wave is broken.
If the price does not consolidate, then wait for the entry point at the level of 0.2040 and below.
Long
Targets 0.2860 - 0.3025 - 0.3360 - 0.3670

ENJUSDTBINANCE:ENJUSDT Long idea
⛔"Daily crypto market analyses I provide are personal opinions & not financial advice. Trading carries risks, so do your own research & seek advisor's help.#DYOR"
Don't forget to like and comment

ENJUSDT Analysis (LOCAL VISION)Hello friends.
Please support my work by clicking the LIKE button👍(If you liked). Also i will appreciate for ur activity. Thank you!
Everything on the chart.
Entry: market and lower
Target: 2.1 - 2.4 - 2.9
after first target reached move ur stop to breakeven
Stop: 1.3 (depending of ur risk). ALWAYS follow ur RM .
Risk/Reward: 1 to 4
risk is justified
Good luck everyone!
Follow me on TRADINGView, if you don't want to miss my next analysis or signals.
It's not financial advice.
Dont Forget, always make your own research before to trade my ideas!
Open to any questions and suggestions.

ENJ/USDT SHORTER TF TRADE SETUP Hi guys, This is CryptoMojo, One of the most active trading view authors and fastest-growing communities.
Do consider following me for the latest updates and Long /Short calls on almost every exchange.
I post short mid and long-term trade setups too.
Let’s get to the chart!
I have tried my best to bring the best possible outcome in this chart, Do not consider it as financial advice.
LONG #CHZ/USDT
ENTRY: $0.24 - $0.23840
SELL- 15% TO 20%
LEVERAGE: 5X to 10X
STOP LOSS: $0.235
This chart is likely to help you in making better trade decisions, if it did do consider upvoting this chart.
Would also love to know your charts and views in the comment section.
Thank you
