Options Trading Idea: Energy Transfer LP 1-3 MonthsThree companies caught our eye last week from insider activity, namely:
Transocean (RIG): Offshore drilling upcycle fueling new high-rate contracts. Insiders bought millions of shares, signalling confidence. Strong oil prices and recent debt reduction amplify upside. Short-term catalysts: additional rig contract wins and positive earnings momentum.
Gran Tierra (GTE): Oversold oil producer with 30% YoY output growth. Upcoming catalyst: management’s debt-cut plan (Dec) – could re-rate equity higher. High risk-reward, as leverage magnifies upside if the plan succeeds.
Energy Transfer (ET): A high-yield midstream MLP offering, the insiders are accumulating shares at a cheap valuation. Lower-risk trade with a catalyst of potential distribution growth or project news.
1. What Energy Transfer Actually Does
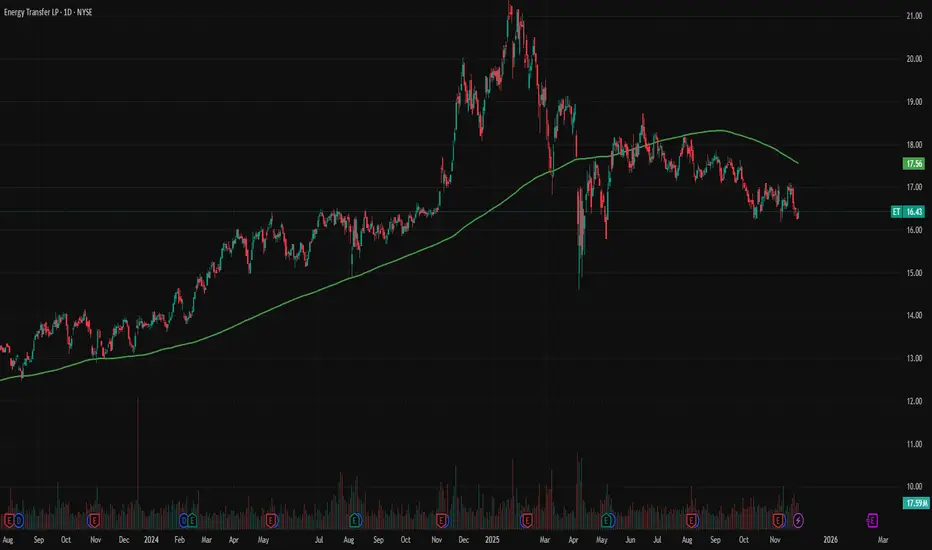
Energy Transfer LP exemplifies an expansive midstream energy infrastructure, driven by its vast pipeline network and strategic market positioning. It is one of the most extensive midstream energy partnerships in North America, owning and operating more than 130,000 miles of pipelines and associated storage, processing, and export infrastructure across the U.S., moving natural gas, NGLs, crude oil, and refined products from wellhead to end markets.
Broadly, its system is organised into:
NGL & refined products (fractionation, the process where raw liquids are split into higher-value products; storage facilities; export docks)
Crude oil transportation (gathering, which involves collecting oil from different sources; long-haul pipelines for transportation)
Natural gas/midstream (gathering, processing, intrastate and interstate pipelines)
Investments in Sunoco LP & USA Compression (fuel distribution and compression services)
This integrated footprint gives ET exposure to most major U.S. basins, especially the Permian, and to global NGL markets via Gulf Coast export terminals.
2. Earnings Power and Margin Structure
Over the last 12 months, Energy Transfer generated about $79.8 billion in revenue and $4.3 billion in net earnings, implying a net margin of about ~5%. This margin can be attributed to the company’s strategic balance between tariff contracts and commodity exposure. A significant portion of the earnings is stabilised by long-term tariff contracts, which ensure consistent revenue regardless of market fluctuations. On the other hand, spot market deals tied to commodity prices introduce some variability. Gross profit was roughly $16.1 billion against a $63.7 billion cost of revenue. These figures underline the operational leverage and its capacity to manage expenses effectively.
These numbers matter because they frame the debate around ET:
On one hand, scale and diversification support relatively stable cash flows even when commodity prices swing.
On the other hand, it is still a capital-intensive, low-margin business, which means balance-sheet discipline and project selection are crucial for equity holders.
From a growth perspective, analysts expect ~11% annual EPS growth and ~6.4% revenue growth over the next several years, slightly below broader U.S. market earnings growth but ahead of typical pipeline peers on revenue.
3. Balance Sheet: Leverage With Cushion
Midstream investors care as much about leverage as they do about growth. Energy Transfer historically carried a heavy debt load following years of acquisition-driven expansion. Two years ago, the debt-to-EBITDA ratio was around 5.0x. Today, it has improved to approximately 4.3x, showcasing the company’s commitment to reducing leverage and highlighting tangible progress in its financial strategy.
Short-term assets: ~$17.4bn vs short-term liabilities of ~$12.4bn
Long-term assets: ~$111.9bn vs long-term liabilities of ~$69.8bn
This tells us three things:
The asset base is large and tangible – pipelines, plants, and terminals that are hard (and expensive) to replicate.
ET has favourable short-term coverage; current assets comfortably back near-term obligations.
Long-term leverage is meaningful, but assets still exceed liabilities by a wide margin, giving lenders and equity holders a buffer.
Credit-rating agencies and management guidance suggest a target leverage range around 4.0–4.5x debt/EBITDA, with recent trends moving gradually lower as growth capex moderates.
4. Ownership and Insider Alignment
One of the more interesting aspects of Energy Transfer is who owns it.
General public: 64.7%
Institutions: 31%
Individual insiders: 4.27%. That 4.27% is not trivial on a partnership of this size. It reflects substantial holdings by Executive Chairman Kelcy Warren and other insiders, who collectively own more than 140 million units. Warren’s recent purchase of an additional 2 million units in the open market represents a significant personal investment, estimated to be a considerable portion of his personal net worth. This strong alignment of interests with other stakeholders suggests a deep conviction in Energy Transfer's long-term prospects.
Recently, Warren purchased an additional 2 million units in the open market, at a cost of roughly $33 million of personal capital. Historically, Warren’s heavy open-market purchases have often coincided with attractive entry points for long-term investors.
5. Valuation: A Deep Discount on Cash Flows
Where the story becomes compelling is the valuation. The Simply Wall St fair-value gauge shows:
Current price: ~$16.27
Estimated fair value: ~$43.57
Implied 62.7% undervaluation
This fair value is based on a discounted cash flow (DCF) model using consensus forecasts and a cost of equity input. To stress-test these assumptions, consider a scenario in which growth drops by two percentage points or the cost of equity rises by 1%. Even under these more conservative assumptions, the valuation gap remains significant, suggesting ET is at least modestly undervalued.
External sources corroborate this discount:
The units trade at about 8–9x forward distributable cash flow (DCF), translating to an implied earnings yield of approximately 30%. This perspective highlights the potential upside for income-focused investors. In comparison, high-quality utility-like infrastructure often trades at mid-teens multiples, and many midstream peers trade at 10–12x. This gap in peer multiples can be viewed as a margin of safety for investors considering ET.
The distribution yield is ~7–8%, and coverage has been trending toward ~2x on a DCF basis, providing room for modest distribution growth or buybacks.
Relative PE vs Peers
Your PE-comparison chart reinforces the absolute valuation story:
ET: ~13x earnings
Kinder Morgan: ~21.8x
Williams Companies: ~30.6x
Enterprise Products Partners: ~12.3x
MPLX: ~11.3x
Peers on average trade closer to 19x, yet ET sits near the bottom of the range despite comparable or slightly better earnings growth forecasts.
6. Growth Outlook and Capital Allocation
Consensus expects ET’s earnings to grow ~11.2% annually, broadly in line with the midstream industry’s 12.1% but below the broader U.S. market at 16%. Revenue is forecast to grow 6.4% annually, versus the industry’s 3.1%.
In plain language:
Top line grows slightly faster than peers, driven by Permian volumes and NGL exports.
Bottom line growth is slightly slower than the market because ET is more mature and capital-intensive.
Management has signalled a pivot from “growth at all costs” toward balanced capital allocation:
Moderating growth capex, many big projects are either complete or nearing completion.
Using incremental cash to deleverage, targeting lower debt/EBITDA.
Gradually increasing distributions and opportunistically returning capital (e.g., buybacks) when units are undervalued.
7. Translating this into Strategy
Information on the strategies is based on options pricing data from TradingView, assessed on 26 November 2025.
7.1. Best Income Play (High Probability)
SELL CASH-SECURED PUT - Strike: $16 (Dec 26 or Jan 2)
Delta: ~0.24
Premium: ~$0.22–$0.28
Probability of expiring OTM: ~76%
Implied return: 1.3–1.7% for 35–40 days
Annualised return ≈ 14–17%
Why it works
ET is fundamentally undervalued.
Strike is very close to support.
You get paid whether the price goes up or stays flat.
Best market condition
Sideways to slightly bullish.
7.2. Best Directional Trade (High Reward, Low Risk)
BULL CALL SPREAD — Buy $16.5 / Sell $17.5 (Jan 2)
Buy 16.5 call (~$0.34 ask)
Sell 17.5 call (~$0.18 ask)
Net debit ~ $0.16
Payoff
Max profit: $1.00 spread – $0.16 cost = $0.84 (525% return)
Breakeven: $16.66
Max loss: $0.16
Why is this optimal
ET expected to drift into $17–18 zone.
Liquidity is strong at 16.5 and 17.0/17.5 strikes (your images show thick volume).
Small debit, very convex profile.
Excellent theta efficiency.
7.3. Best Intermediate Strategy (Theta + Delta Blend)
DIAGONAL CALL SPREAD — Buy Jan 2 $17 call / Sell Dec 19 $17.5 call
This captures IV skew + slow grind upwards.
Long leg has more time (Jan 2).
Short leg burns faster (theta gain).
You roll the short call forward every week.
Why it’s powerful
ET moves slowly → diagonals exploit drip-up movement.
You earn time decay each week as your long call appreciates.
7.4. High Win-Rate Spread (Good for Small Accounts)
CREDIT PUT SPREAD — Sell $16 / Buy $15.5 (Dec 26)
Collect ~$0.08–0.10 credit
Max loss: $0.40
Win rate: ~74%
Probability of profit: ~70%+
Better risk-adjusted than naked puts for smaller capital.
7.5. Directional “Rerating + Breakout” Strategy
BROKEN-WING BUTTERFLY — 16.5 / 17.5 / 19 (Jan 2)
Cheap entry (~$0.05–0.10)
Max profit if ET closes near $17.50
Higher profit zone extended due to long wing at $19
This captures the slow drift and gives a huge reward if ET spikes.
Note, this is not financial or trading advice; the information represented in this article is for information and research purposes only. All graphic information and options data were sourced from TradingView and Simple Wall Street.
Equityanalysis
KFin Technologies LtdCompany Snapshot:
Sector: Financial Services (Mutual Fund Services, RTA)
Market Cap: ₹21,000 Cr
Current Price: ₹1,239.20
Debt-to-Equity: 0.06 (very low)
ROE: 39% | ROCE: 49%
Financial Highlights:
Revenue Growth (3Y CAGR): ~22%
Profit Growth (3Y CAGR): ~32%
EBITDA Margin: ~48%
P/E Ratio: ~35x (TTM)
Industry Avg P/E: ~30-32x
Recent Price Action:
Stock broke out sharply in April 2025.
Support: ₹1,180 | Resistance: ₹1,300
RSI near 70 (mildly overbought, but momentum strong).
Key Strengths:
Dominant RTA player with 70%+ MF asset share.
Consistent cash flows and expanding international footprint.
High operating leverage driving margin expansion.
Key Risks:
Regulatory changes (SEBI reforms) could pressure fees.
High client concentration risk with top AMCs.
Valuation & Recommendation:
DCF Estimated Fair Value: ₹1,280–₹1,350
Recommendation: BUY on Dips / Accumulate
12-month Target Price: ₹1,320
Investment Horizon: 1–2 years
📈 Verdict: Strong business fundamentals, steady growth, and low debt make KFin Technologies attractive for long-term investors. Minor corrections can offer better entry points.
For Education Purposes only

Necklace Pattern- DCMShriramIs this getting ready for some move?
DCM Shriram
Can this rally, take it up?
DCM Shriram is all set, isnt it?

Mahindra & Mahindra (M&M) 9.5% in 10 Days on RisologicalMahindra & Mahindra (M&M) 9.5% in 10 Days on Risological
Was able to catch a 9.5% trade in 10 days on the 15m time frame.
Currently, the Trailing stop loss is at 2,822 for safe traders.
People with patience make the most money in any market.

ASIAN PAINTS 15m chartAfter a nice upside rally, now short side is confirmed as per the Risological swing trader indicator.
Support and resistance levels are marked.
Good luck.

$NKE | Allocation | Market Exec & Buy Limit |Technical Confluences:
- Price action is at the 61% Retracement for Recent Lows to Highs and the beginning of Nike's time (Strong Support)
- Price action is also at a Demand Zone
- Stochastics is at Oversold levels on the Weekly & Monthly TF
Fundamental Confluences:
- Regardless of weak Earnings and Forward Projections, Nike is still considered as a market leader in various aspects (Fashion, Fitness, Sports, Status etc.); brand loyalty will be retained at least for the next few years
- Who doesn't love Nike; aside from Adidas?
________________________________
NYSE:NKE is the next in my basket of portfolio. Allocating the first 20% of single-stock into my Long-Term portfolio.
The Nike brand will not die off that easily. Definitely, a value buy; for me.
Remember, DYOR.
________________________________
Boosts 🚀, Follows ✌️, Shares 🙌 & Comments ✍️ are much appreciated!
If you have any ideas or charts, do share them in the 'Comments' section below and we can discuss our perspectives to improve or strengthen our strategies.
If you want something analyzed, do drop me a DM. :D
________________________________
Disclaimer: The above suggestion is an personal opinion in general and does not constitute as investment advice. Any decisions taken based on the above suggestion is purely your own risks. DYOR.

LONG TERM WEALTH IDEA - IMAGICAA WORLD ENT LTDLONG TERM WEALTH IDEA - IMAGICAA WORLD ENT LTD
Company has some issues, still I believe it's could be a turnaround story.
This is not a recommendation, just for educational purpose. DO NOT COPY this trade. Consult your financial advisor before investing!


NIFTY AND BANKNIFTY VIEWHello Traders,
Checkout the latest update on Nifty and BankNifty. Hope you all safe funds

S&P500 Valuation In Current Economic EnvirontmentHello everyone,
as title says, today I would like to speak about the S&P500 and its market valuation in the current economic environment.
Since I prefer to study and analyze markets on higher time frames rather than day-to-day, this Case Study is based on quarter outlook (3M chart), to capture most of the available information using metrics that have significant inputs and outputs on the economy e.g. Interest Rates, Employment Rates, company Bankcruptcies & others.
I decided to make this Case Study since I believe we may be on the verge of facing difficulties on micro and macro levels, which in history led into a downturn of equity markets for a prolonged period of time.
It may be argued that some of these Cases are not relevant since they don't include full data, and that would be fair. But at the same time, I would point out that these data and used Cases are the most relevant to this day, because of their similarities to today's economic environment even if not in a full manner.
For better understanding, you need to take a look at Pic1.
(Pic1.:S&P500 chart with color legend)
-Captured time windows consist of the US Unemployment rate moving from relatively low levels to higher values in times when Interest Rates are relatively High. To make a better educated guess I included US bankcrupcies as an overall business health indicator.
-Inflation Rate or Federal Reserve Balance could be used additionally.
Historically, I would argue that the most similar to this day looks Case Nr.4
In both, we have:
a, rallied to ATH in unfavorable market conditions (3to4, 5to6?)
b, unemployment rate curving up from the bottom
c, bankcruptcies curving up from the bottom
d, interest rates are high (and cuts are around horizont)
Why is that important?
Because as Pic2. shows:
(Pic2.:S&P500 drawdown from top)
-In all of these cases market bled and did not start turning around BEFORE FED found the bottom rate.
And they have not even started cutting yet..
That in my view is a huge red flag and it brings attention to "Not IF we are about to go lower, but WHEN we are about to start going lower."
It may be a month, two or three... but if we take a look at what the chart and those economic metrics suggest, it's most likely will not be a pretty ride until all of those are resolved in favorable manner for markets, which may take year or longer as historical cases shown..
Unless they decide to print NEW TRILLION$$$
Hopefully, this case study was helpful for some of you in further market navigation.
If YES, please consider liking or sharing this post, it would mean a lot to me.
Also, if you are interested in more updates or you would like to receive personal analysis with lower time frame updates daily, let me know in the comments or DM.
Best Regards,
Joe

20% Upside Potential idea 🔥 - SAREGAMA🔥 20% Upside Potential idea - NSE:SAREGAMA
This Trade Ideas is a type of Equity Investment which is designed to give you 10% to 20% return in short-term via #Equity #Investment.
✅ Stock Name - NSE:SAREGAMA
Trade Process :-
✅ - Buy only at Buy Level as recommended in the chart. Use GTT feature available with all online brokers
✅ - On successful purchase, immediately create a SL GTT (Stop Loss level asper chart).
✅ - Once Stock Price is at Target 1 level, move your SL to Cost Price or 3% down from Target 1.
✅ - Keep Trailing the SL as Stock Price moves to next Targets.
Thanks

Necklace Pattern Breakout- Omaz Auto LtdNecklace Pattern Breakout- Omaz Auto Ltd
Looks like multi year range is ready for a breakout after repeated failed attempts. Let's see how market reacts to this attempt.
This is not a Buy/Sell Call. Chart shared for educational purpose only.

Maharashtra Seamless LimitedThe co. has a market share of 55% in the seamless pipes segment and a market share of 18% in the API-certified, high-frequency ERW pipes segment.
Revenue as FY22
Steel Pipes and Tubes: 95%
Clientele
Some esteemed clients of the Co include Indian Oil Corporation Ltd, BHEL, Reliance Industries Ltd, ISGEC, NTPC, Larsen & Toubro, and more, and Infrastructure clients are Adani, DLF, GAAR, IGL, Unitech etc.
On installation of finishing facilities at Telangana in FY24, existing capacity of 100,000 MTPA will be activated (seamless pipes segment)

Kelly Criterion and other common position-sizing methodsWhat is position sizing & why is it important?
Position size refers to the amount of risk - money, contracts, equity, etc. - that a trader uses when entering a position on the financial market.
We assume, for ease, that traders expect a 100% profit or loss as a result of the profit lost.
Common ways to size positions are:
Using a set amount of capital per trade . A trader enters with $100 for example, every time. This means that no matter what the position is, the maximum risk of it will be that set capital.
It is the most straight-forward way to size positions, and it aims at producing linear growth in their portfolio.
Using a set amount of contracts per trade . A trader enters with 1 contract of the given asset per trade. When trading Bitcoin, for example, this would mean 1 contract is equal to 1 Bitcoin.
This approach can be tricky to backtest and analyse, since the contract’s dollar value changes over time. A trade that has been placed at a given time when the dollar price is high may show as a bigger win or loss, and a trade at a time when the dollar price of the contract is less, can be shown as a smaller win or loss.
Percentage of total equity - this method is used by traders who decide to enter with a given percentage of their total equity on each position.
It is commonly used in an attempt to achieve ‘exponential growth’ of the portfolio size.
However, the following fictional scenario will show how luck plays a major role in the outcome of such a sizing method.
Let’s assume that the trader has chosen to enter with 50% of their total capital per position.
This would mean that with an equity of $1000, a trader would enter with $500 the first time.
This could lead to two situations for the first trade:
- The position is profitable, and the total equity now is $1500
- The position is losing, and the total equity now is $500.
When we look at these two cases, we can then go deeper into the trading process, looking at the second and third positions they enter.
If the first trade is losing, and we assume that the second two are winning:
a) 500 * 0.5 = 250 entry, total capital when profitable is 750
b) 750 * 0.5 = 375 entry, total capital when profitable is $1125
On the other hand, If the first trade is winning, and we assume that the second two are winning too:
a) 1500 * 0.5 = 750 entry, total capital when profitable is $2250
b) 2250 * 0.5 = 1125 entry, total capital when profitable is $3375
Let’s recap: The trader enters with 50% of the capital and, based on the outcome of the first trade, even if the following two trades are profitable, the difference between the final equity is:
a) First trade lost: $1125
b) First trade won: $3375
This extreme difference of $2250 comes from the single first trade, and whether it’s profitable or not. This goes to show that luck is extremely important when trading with percentage of equity, since that first trade can go any way.
Traders often do not take into account the luck factor that they need to have to reach exponential growth . This leads to very unrealistic expectations of performance of their trading strategy.
What is the Kelly Criterion?
The percentage of equity strategy, as we saw, is dependent on luck and is very tricky. The Kelly Criterion builds on top of that method, however it takes into account factors of the trader’s strategy and historical performance to create a new way of sizing positions.
This mathematical formula is employed by investors seeking to enhance their capital growth objectives. It presupposes that investors are willing to reinvest their profits and expose them to potential risks in subsequent trades. The primary aim of this formula is to ascertain the optimal allocation of capital for each individual trade.
The Kelly criterion encompasses two pivotal components:
Winning Probability Factor (W) : This factor represents the likelihood of a trade yielding a positive return. In the context of TradingView strategies, this refers to the Percent Profitable.
Win/Loss Ratio (R) : This ratio is calculated by the maximum winning potential divided by the maximum loss potential. It could be taken as the Take Profit / Stop-Loss ratio. It can also be taken as the Largest Winning Trade / Largest Losing Trade ratio from the backtesting tab.
The outcome of this formula furnishes investors with guidance on the proportion of their total capital to allocate to each investment endeavour.
Commonly referred to as the Kelly strategy, Kelly formula, or Kelly bet, the formula can be expressed as follows:
Kelly % = W - (1 - W) / R
Where:
Kelly % = Percent of equity that the trader should put in a single trade
W = Winning Probability Factor
R = Win/Loss Ratio
This Kelly % is the suggested percentage of equity a trader should put into their position, based on this sizing formula. With the change of Winning Probability and Win/Loss ratio, traders are able to re-apply the formula to adjust their position size.
Let’s see an example of this formula.
Let’s assume our Win/Loss Ration (R) is the Ratio Avg Win / Avg Loss from the TradingView backtesting statistics. Let’s say the Win/Loss ratio is 0.965.
Also, let’s assume that the Winning Probability Factor is the Percent Profitable statistics from TradingView’s backtesting window. Let’s assume that it is 70%.
With this data, our Kelly % would be:
Kelly % = 0.7 - (1 - 0.7) / 0.965 = 0.38912 = 38.9%
Therefore, based on this fictional example, the trader should allocate around 38.9% of their equity and not more, in order to have an optimal position size according to the Kelly Criterion.
The Kelly formula, in essence, aims to answer the question of “What percent of my equity should I use in a trade, so that it will be optimal”. While any method it is not perfect, it is widely used in the industry as a way to more accurately size positions that use percent of equity for entries.
Caution disclaimer
Although adherents of the Kelly Criterion may choose to apply the formula in its conventional manner, it is essential to acknowledge the potential downsides associated with allocating an excessively substantial portion of one's portfolio into a solitary asset. In the pursuit of diversification, investors would be prudent to exercise caution when considering investments that surpass 20% of their overall equity, even if the Kelly Criterion advocates a more substantial allocation.
Source about information on Kelly Criterion
www.investopedia.com

POSITIONAL EQUITY TRADE FOR REWARD : RISK 5:1
Price has changed the Trend upwards and has a buying confirmation, hence expecting an Impulsive Move Upward till the Opposite Quarterly Supply.
ENJOY THE RIDE !!!

Stock-bond correlation and 60/40 portfolio are at crossroadsIn 2022 the diversification between stocks and bonds within a "60/40" portfolio was an ineffective strategy that yielded negative returns and, as a result, did not safeguard the investment.
The reason was that both equities and bonds plummeted in lockstep as a result of the Federal Reserve's interest rate rises, with the correlation reaching its highest level in a decade. The blue area in chart above shows the 60-day rolling correlation coefficient between the S&P 500 index ( SPX ) and the Vanguard Total Bond Market ( BND ) ETF, which currently stands at 0.89.
The positive stock-bond correlation had typically worked when the two assets climbed upward together in the post-GFC decade, but in this new environment, it did the opposite and for a longer time than in 2008 and 2020.
Similar to 2008-2009, a 60/40 portfolio of global equities and bonds saw a maximum drawdown of 25% this year, but lasted more.
The fall from peak to trough of the 60/40 portfolio lasted 252 days between June 2008 and March 2009, just 35 days between February and March 2020, and 336 days in 2022, making it the longest 60/40 bear market in the past two decades.
60/40 portfolio and its drawdowns – 60% Vanguard Total Stock Market ETF ( VTI ) & 40% Vanguard Total Bond Market ETF ( BND )
As we approach the final FOMC meeting of 2022, the future of bonds and stocks is at a crossroads, and a decoupling between the two assets may occur, making the 60/40 portfolio diversification plan more effective moving into 2023.
If the Fed signals that the end of the hike cycle is nearing and adopts a more dovish stance on inflation, both stocks and bonds will benefit from here.
If the Fed indicates that interest rates will continue to increase and that the window for a soft landing is narrowing, bonds will outperform stocks. However, equities will receive a boost when the recession comes and the Fed is pressured to cut interest rates.
The downside risk of this approach is an excessive tightening of interest rates by the Fed, which might increase bond yields even more (and cause prices to drop) and further devalue equity markets, extending the bear market for the 60/40 portfolio.

Mahindra cie after making a new 52 week high Mahindra cie now giving a small retracement one can add at 300 -308 sl 285
Tgt 350 385 400
Ask your financial advisor before taking any action based on my view
Only for educational purposes

#DXY - WIN or LOSS Hello my Fellow TraderZ,
Currently this is the most important chart most of the traders eyeing upon - #DXY.
#DXY - an index containing the graphical representation of the strength of $USD against major currencies of the World.
We can see the #DXY is enjoying the Parabolic Blow off phase after making DOUBLE BOTTOM in JUNE 2021.
Now , after breaking certain important levels, it is approaching towards MONTHLY level of 120 after Dotcom Bubble in 2001.
As I can see we could possibly have two scenarios to play in the coming days :
1. GREEN - here #DXY will continue its path to 120 giving more pain to Equity markets.
2. RED - here I'm assuming this one to play (anticipating FED's soft behavior towards Rates' Hike), then we could see a retracement towards the 102 allowing Equities to enjoy relief rally in 3-5 months following a major crash globally which could possibly lead to mark the Cycle BOTTOM.
NOTE : - Not a Financial Advice, just my speculation.
CHEERS!!!

SPX Daily TA Neutral BearishSPXUSD daily guidance is neutral with a bearish bias. Recommended ratio: 40% SPX, 60% Cash.
* BOUNCE WATCH . The Employment Situation was released this morning and 263k nonfarm workers were added to the economy in September while Unemployment edged back down to 3.5% from 3.7% in August. The 17th GDPNow US Q3 GDP estimate came in at 2.9% today compared to 2.7% on 10/05 . Cleveland Fed President Mester tried to warn us of rising Unemployment yesterday and it came down today instead, maybe the Federal Reserve is hiring thousands of nonfarm workers to get together and figure out how to bring down inflation. NY Fed President Williams said today that he envisions another aggressive rate hike in November (likely 75bps) and that he too sees a slowdown in job markets in 2023 accompanied by higher interest rates and lower inflation . In response to the oil production cut by OPEC+, The White House Admin tapped into the SPR yet again, bringing its total emergency oil reserves down to the lowest they've been in forty years . With midterm elections coming up in the USA, it's hard not to see this move by the White House as politically motivated. Key Upcoming Dates: FOMC Minutes at 2pm EST 10/12; September US CPI at 830am EST 10/13; September US Retails Sales at 830am EST 10/14; 18th GDPNow US Q3 GDP Estimate 10/14; UofM October Consumer Sentiment Index at 10am EST 10/15.*
Price is currently testing $3658 minor support + the weak descending trendline from July 2021 at ~$3633 as support after being rejected by the lower trendline of the descending channel from August 2021 at ~$3800. Volume remains High (low) and has favored sellers in the past two sessions. Parabolic SAR flips bearish at $3605, this margin is bearish at the moment. RSI is currently testing 38 support after breaking below the uptrend line from January 2022 at ~41. Stochastic crossed over bearish today and is trending down at 78 as it approaches 76.29 support with no signs of trough formation. MACD is currently trending down at -81 after being rejected by -76.22 minor resistance and is on the verge of crossing over bearish if it gets below -86; it's still technically testing the uptrend line from March 2020 at ~-80 as support. ADX is currently completing a trough and beginning to trend up slightly at 28 as Price is rejected by the descending channel from August 2021 at ~$3800.
If Price is able to bounce here at the weak descending trendline from July 2021 (~$3633) then it will have to close above $3658 minor support in order to be able to retest the lower trendline of the descending channel from August 2021 at ~$3800 as resistance . However, if Price continues to break down here, it will likely test $3517 minor support for the first time since November 2020. Mental Stop Loss: (two consecutive closes above) $3658.

SPX Daily TA Neutral BearishSPXUSD Daily neutral with a bearish bias. Recommended ratio: 47% SPX, 53% Cash .
*I incorrectly mentioned that PCE numbers would be released today, they are scheduled for release tomorrow at 830am EST. The 2nd US Q2 GDP estimate was reported today at -0.6% compared to the previous Advanced estimate of -0.9% , the third and final Q2 estimate will be reported on 09/29/22. Equities, Cryptos and Energy are up while VIX, DXY, US Treasuries and Commodities (aside from Energy) are all down or flat. St. Louis Fed President James Bullard made a pitch for more frontloading to bring down inflation and mentioned that he'd like to see EOY FFR at 3.75%-4%. Bullard isn't a voting member on the rates but his view could gain momentum depending on tomorrow's July PCE report and August's Jobs + CPI numbers. The Risk-On appetite seems to be growing ahead of the anticipated speech by Jerome Powell at Jackson Hole tomorrow. Market consensus is that Powell will remain hawkish but tomorrow's PCE numbers may inspire a more dovish tone regarding end of year expectations. Key Upcoming Dates: US July PCE at 830am EST 08/26 ; UofM Final August Sentiment Survey Index at 10am EST 08/26 ; Jackson Hole Economic Symposium on 08/25-08/27 (Fed Chair Jerome Powell scheduled to speak at 10am EST on 08/26).*
Price is currently trending up at $4199 and is still technically testing $4175 support. Volume remains Moderate (high) and has favored buyers in both of the last two sessions as Price tests $4175 support. Parabolic SAR flips bullish at $4290, this margin is neutral at the moment. RSI is currently trending up at 56.73 after forming a trough at, and bouncing off of, 52.68 support. Stochastic crossed over bullish in today's session and is currently trending up at 12 as it approaches 18.32 resistance. MACD remains bearish and is currently beginning to form a trough at 55.35 minor support. ADX is currently beginning to form a trough at 25 as Price is pushing higher, this is mildly bullish at the moment.
If Price is able to close above $4175 in tomorrow's session, it will likely retest $4254 minor resistance before potentially retesting the upper trendline of the descending channel from November 2021 at ~$4300 as resistance . However, if Price breaks down here, the next likely target would be a retest of the uptrend line from 06/16/22 at ~$4100 as support . Mental Stop Loss: (two b2b closes above) $4175.

SPX Daily TA Cautiously BearishSPXUSD Daily cautiously bearish. Recommended ratio: 10% SPX, 90% Cash.
*Equities and Cryptos are getting smashed as DXY and US Treasuries rally higher. Quite simply this is a response to global recessionary fears (amplified by last week's disappointing global economic data) and a commitment by the Fed to continue FFR hikes for the rest of the year. It seems as though investors are preparing for more hawkishness from Jerome Powell's upcoming speech in Jackson Hole on 08/26; which leaves tremendous surprise upside to markets if he gives any hints of dovishness. Key Upcoming Dates: S&P US August PMI at 945am EST 08/23 ; US Q2 Final GDP Estimate at 830am EST 08/25; US July PCE at 830am EST 08/26; UofM Final August Sentiment Survey Index at 10am EST 08/26; Jackson Hole Economic Symposium on 08/25-08/27.*
Price is currently trending down at $4138 and is still technically hanging on to $4175 support. Volume remains Moderate (high) and has favored sellers for two consecutive sessions; Price is currently trading in the second largest medium-term supply/demand zone on the chart. Parabolic SAR flips bullish at $4323 (this coincides with the 200 MA + the upper trendline of the descending channel from November 2021), this margin is neutral at the moment. RSI is currently trending down at 51 with no signs of trough formation and is technically testing 52.68 support; the next support is the uptrend line from 01/27/22 which coincides with 38 support. Stochastic remains bearish and is currently testing 18.32 support with no sign of trough formation. MACD finally crossed over bearish today after 56 days being bullish and is currently trending down at 74; the next support (minor) is at 55.35. ADX is currently trending down at 29 as Price continues to fall, this is neutral at the moment.
If Price is able to bounce here it will have to close above $4175 resistance to flip it back to support before it can attempt to retest $4254 minor resistance . However, if Price continues to break down here, it will likely retest the uptrend line from 06/16/22 at ~$4k psychological support . Mental Stop Loss: (two b2b closes above) $4175.

Intraday & swing trade:- DeepakfertScalping Deepakfert
sell Deepakfert below 606
Target 600,594.
SL 607 (risk is 1 point)
If it falls it will touch the target within few minutes. so go with the momentum.
As on the chart, there is superb trendline support on the 1-hour chart. so, buy Deepakfert if it takes support above 608 for the target of 615, 625, 640,650 (Swing Trading).
For buying, you need to know price action & Candlestick analysis. If you find a proper set-up like hammer or dozi then take entry. It would be a significant risk: reward set up

US500/SPX enters into a bear market The last time this happened was in 2018 but the market some how management to rally which resulted in a false breakout.
In 2020 the market came back to this level and spiked around this area before turning into an almost 2 year rally.
2007 was a different story as market broke structure and the result was a sell of that lasted one year.
What will happen in 2022? Will the bulls take control and result in the SPX hitting another all time high.
Or will we see similar events of what happened in 2007 which resulted in a huge sell off that one year.
