When Indexes Stop Agreeing, Markets Start TalkingEver notice how markets can look strong… yet feel a little off?
That’s usually when indexes stop marching in sync — and right now, that’s exactly what’s happening.
Let’s break it down, no jargon overload, no crystal balls.
Four Indexes, Four Different Stories
Here’s the current lineup in US equity index futures:
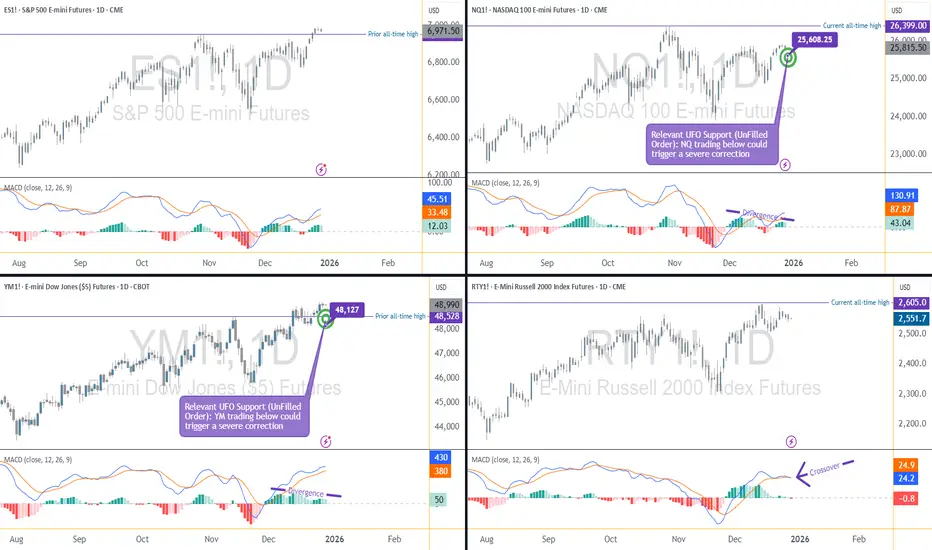
S&P 500 (ES) → Pushing to fresh all-time highs
Dow Jones (YM) → Also holding above prior highs
NASDAQ 100 (NQ) → Lagging below its peak
Russell 2000 (RTY) → Still stuck under its highs
When all four move together, trends tend to behave.
When they don’t? Markets usually get… interesting.
Why This Disagreement Matters
The NASDAQ is packed with technology and AI-related names — the same group that carried much of the upside through 2025. Its failure to confirm new highs raises an eyebrow.
Meanwhile:
The Dow (YM) is strong, despite being less tech-heavy
Small caps (RTY) aren’t joining the party
Leadership is narrowing, not expanding
That’s not a signal by itself — but it is a clue.
Momentum Is Whispering (Not Shouting)
Momentum indicators aren’t screaming danger, but they are quietly tapping the mic:
NASDAQ shows a bearish divergence
Dow also shows a bearish divergence (yes, even while strong)
Russell goes a step further with a divergence and a momentum crossover
The S&P 500? Still holding up — but increasingly alone.
When momentum fades while price stays elevated, markets often shift from trending to fragile.
The Levels That Actually Matter
Here’s where structure comes in.
Two UFO (UnFilled Orders) support zones sit right below price:
NASDAQ (NQ): ~25,608
Dow (YM): ~48,127
Above these levels, structure is intact.
Below them? That’s when momentum warnings could start turning into price action.
Think of these zones as market tripwires — nothing happens until they’re crossed.
Condition-Based Thinking (No Guessing Required)
Instead of asking “Will the market drop?”, a better question is:
What would need to happen for risk to expand?
A simple framework:
NQ below support + YM below support
Weakest and strongest indexes failing together
Divergences resolving through price, not time
That’s when downside scenarios become more relevant — not before.
Quick Note on Contract Specs & Margin
All four index futures discussed are available in E-mini and Micro E-mini versions, moving tick-for-tick with the same underlying index.
At a glance:
Micro contracts = 1/10 the tick value of E-minis
Typical tick values:
ES / MES: $12.50 vs. $1.25
NQ / MNQ: $5.00 vs. $0.50
YM / MYM: $5.00 vs. $0.50
RTY / M2K: $5.00 vs. $0.50
Margin context (approximate):
ES / MES: $22,500 vs. $2,250
NQ / MNQ: $33,500 vs. $3,350
YM / MYM: $14,250 vs. $1,425
RTY / M2K: $9,500 vs. $950
Same market, same analysis — just different risk granularity. This becomes especially useful when markets are hovering near key structural levels.
The Big Takeaway
Markets don’t usually turn when everyone expects them to.
They turn when participation fades, leadership narrows, and structure starts cracking.
Right now:
Some indexes are strong
Others are lagging
Momentum is diverging
Key levels are close
No conclusions. No assumptions.
Just evidence — and levels worth paying attention to as 2026 approaches.
Want More Depth?
If you’d like to go deeper into the building blocks of trading, check out our From Mystery to Mastery trilogy, three cornerstone articles that complement this one:
🔗 From Mystery to Mastery: Trading Essentials
🔗 From Mystery to Mastery: Futures Explained
🔗 From Mystery to Mastery: Options Explained
When charting futures, the data provided could be delayed. Traders working with the ticker symbols discussed in this idea may prefer to use CME Group real-time data plan on TradingView: www.tradingview.com - This consideration is particularly important for shorter-term traders, whereas it may be less critical for those focused on longer-term trading strategies.
General Disclaimer:
The trade ideas presented herein are solely for illustrative purposes forming a part of a case study intended to demonstrate key principles in risk management within the context of the specific market scenarios discussed. These ideas are not to be interpreted as investment recommendations or financial advice. They do not endorse or promote any specific trading strategies, financial products, or services. The information provided is based on data believed to be reliable; however, its accuracy or completeness cannot be guaranteed. Trading in financial markets involves risks, including the potential loss of principal. Each individual should conduct their own research and consult with professional financial advisors before making any investment decisions. The author or publisher of this content bears no responsibility for any actions taken based on the information provided or for any resultant financial or other losses.
Equityindex

When Indexes Disagree: Evidence-Based Clues Heading Into 2026Market Context: Why Futures-Based Index Analysis Matters
When equity markets approach historical extremes, surface-level price action often hides important structural information. This is especially true when analyzing cash indices alone. Futures markets, by contrast, provide continuous pricing across all trading sessions, including the Globex (Extended Trading Hours) session, offering a more complete picture of participation, liquidity, and risk transfer.
By focusing on US equity index futures rather than cash indices, traders gain visibility into how markets behave outside regular trading hours — often where meaningful positioning occurs. This becomes particularly important when markets are near all-time highs and internal alignment begins to fracture.
In this analysis, attention is placed on the four most relevant US equity index futures:
E-mini S&P 500 Index Futures (ES)
E-mini NASDAQ 100 Index Futures (NQ)
E-mini Dow Jones Index Futures (YM)
E-mini Russell 2000 Index Futures (RTY)
Together, these markets represent large-cap growth, broad market exposure, industrial and value-oriented components, and small-cap participation. When these indexes move in harmony, trends tend to persist. When they diverge, conditions often become more fragile.
All-Time Highs in Focus: Who Is Leading and Who Is Lagging
A defining characteristic of the current environment is disagreement among indexes, despite elevated price levels.
The E-mini S&P 500 Index Futures (ES) has recently pushed to a new all-time high. This reflects ongoing strength in the broader market and confirms that headline risk appetite remains intact.
In contrast, the E-mini NASDAQ 100 Index Futures (NQ) has failed to confirm this strength. Despite previous leadership, NQ is currently trading below its all-time high. This matters because the NASDAQ is heavily weighted toward technology and growth-related stocks, including those linked to artificial intelligence (AI) — sectors that provided a significant portion of upside momentum throughout 2025.
Meanwhile, the E-mini Dow Jones Index Futures (YM) is trading above its prior all-time high. This is notable because the Dow has a more diversified sector composition and is less concentrated in high-growth technology names. Its relative strength suggests that current market resilience may be coming from areas outside of the technology complex.
Finally, the E-mini Russell 2000 Index Futures (RTY) remains below its all-time high. Small- and mid-cap stocks often act as a confirmation layer for broader economic participation. When large-cap indexes make new highs while small caps lag, it can signal uneven economic traction and rising internal imbalance.
This combination — ES and YM showing strength, while NQ and RTY lag — forms the foundation of the current intermarket tension.
Momentum Evidence: What MACD Is Revealing Across Indexes
Price alone rarely tells the full story near extremes. Momentum indicators, when used correctly, help evaluate the quality of participation behind price movement.
In this case, the MACD indicator reveals important divergences across multiple indexes.
The NQ is displaying a bearish momentum divergence, where price remains elevated but momentum fails to confirm. This suggests that upside participation is narrowing rather than expanding.
The YM — despite being one of the strongest indexes — is also showing a bearish divergence on MACD. This is particularly important because divergences forming in strong markets often precede broader shifts, not because price must reverse immediately, but because momentum strength is no longer accelerating.
The RTY presents the most advanced signal set. It is not only showing a bearish divergence, but also a MACD crossover, which can be interpreted as early-stage downside momentum attempting to assert itself.
The ES, while not currently exhibiting the same degree of momentum weakness, stands increasingly isolated. When leadership narrows to one index, risk becomes asymmetric rather than evenly distributed.
Structural Risk Zones: Interpreting UFO (UnFilled Orders) Support
Momentum divergences alone do not constitute actionable signals. They require structural confirmation.
This is where UFO support and resistance levels (UnFilled Orders) become relevant. UFO zones represent areas where liquidity previously failed to transact fully, often acting as structural support or resistance when revisited.
In the current structure, two UFO support zones stand out due to their proximity to price and their relevance to both the strongest and weakest markets:
NQ: UFO support ending near 25,608.25
YM: UFO support ending near 48,127
These levels are significant because they sit directly beneath current price action. As long as price remains above these zones, structure remains intact despite momentum warnings.
However, a violation of such UFO supports would represent a meaningful shift. It would indicate that buyers previously willing to defend these levels are no longer present, allowing momentum divergences to express themselves more fully.
Conditional Scenarios: What Would Confirm a Broader Risk Shift
Rather than anticipating outcomes, evidence-based analysis focuses on conditions.
From a structural standpoint, bearish scenarios would gain credibility if:
NQ trades below 25,608.25, violating its nearby UFO support
YM trades below 48,127, removing structural support from the strongest index
Weakness emerging simultaneously in both the weakest and strongest indexes would suggest that divergence is resolving through price rather than consolidation. In such a case, broader downside expansion could develop, potentially manifesting as a sharp corrective phase.
Importantly, this framework does not assume that such a move must occur. It simply defines what conditions would matter if they do.
Illustrative Trade Framework (Educational Example Only)
For traders studying downside scenarios, a hypothetical bearish framework could be structured as follows:
Trigger: Confirmed daily close below relevant UFO support
Risk Definition: Invalidation above reclaimed structure
Objective: Next lower structural liquidity zone
Reward-to-Risk: Favorable only if structure breaks decisively
This framework is illustrative and intended solely to demonstrate how structure, momentum, and confirmation can align. It does not imply expectations or outcomes.
E-mini vs. Micro E-mini Contracts
All four equity index futures discussed — ES, NQ, YM, and RTY — are available in both E-mini and Micro E-mini formats. Both versions track the same underlying index and move tick-for-tick together. The difference lies in how risk is expressed.
ES / MES Tick size: 0.25 index points = $12.50 (ES) | $1.25 (MES)
NQ / MNQ Tick size: 0.25 index points = $5.00 (NQ) | $0.50 (MNQ)
YM / MYM Tick size: 1 index point = $5.00 (YM) | $0.50 (MYM)
RTY / M2K Tick size: 0.10 index points = $5.00 (RTY) | $0.50 (M2K)
Across all four indexes, Micro E-mini contracts represent one-tenth of the tick value of their E-mini counterparts.
Margin requirements vary by broker and market conditions. From a structural perspective:
ES / MES required margin = ~$22,500 (ES) | ~$2,250 (MES)
NQ / MNQ required margin = ~$33,500 (NQ) | ~$3,350 (MNQ)
YM / MYM required margin = ~$14,250 (YM) | ~$1,425 (MYM)
RTY / M2K required margin = ~$9,500 (RTY) | ~$950 (M2K)
This difference allows traders to express the same market thesis with far greater precision, especially when working around tight structural levels or conditional triggers.
With momentum divergences developing and key structural zones nearby, position sizing flexibility becomes critical. Micro E-mini contracts make it possible to:
Scale exposure gradually
Reduce concentration risk
Align risk more closely with invalidation levels
The analysis remains identical across E-minis and Micros — only the risk calibration changes.
Risk Management Considerations
Divergences can persist longer than expected, especially in strong trends. Acting without confirmation often leads to premature positioning.
Key principles include:
Waiting for structural validation
Defining risk before engaging
Managing exposure across correlated instruments
Avoiding overconfidence near historical extremes
Markets rarely turn because of opinion. They turn when structure and participation change.
Final Takeaway: Evidence Over Assumptions
As 2025 comes to a close, US equity index futures present a market that is strong on the surface but fractured underneath. Leadership is narrowing, momentum is diverging, and structural levels are increasingly relevant.
Whether these signals resolve through consolidation or correction remains unknown. What matters is that the evidence is now visible — and futures markets provide the clarity needed to observe it.
Data Consideration
When charting futures, the data provided could be delayed. Traders working with the ticker symbols discussed in this idea may prefer to use CME Group real-time data plan on TradingView: www.tradingview.com - This consideration is particularly important for shorter-term traders, whereas it may be less critical for those focused on longer-term trading strategies.
General Disclaimer
The trade ideas presented herein are solely for illustrative purposes forming a part of a case study intended to demonstrate key principles in risk management within the context of the specific market scenarios discussed. These ideas are not to be interpreted as investment recommendations or financial advice. They do not endorse or promote any specific trading strategies, financial products, or services. The information provided is based on data believed to be reliable; however, its accuracy or completeness cannot be guaranteed. Trading in financial markets involves risks, including the potential loss of principal. Each individual should conduct their own research and consult with professional financial advisors before making any investment decisions. The author or publisher of this content bears no responsibility for any actions taken based on the information provided or for any resultant financial or other losses.
AI Stocks Weakness Could Spoil this Year’s Santa RallyAs December begins, traders worldwide are dusting off the same old question: Will we get a Santa Claus rally this year?
But 2025’s setup looks a little different. The market’s cheer seems to depend heavily on whether AI-related stocks can keep delivering miracles—and lately, the charts are suggesting they may be running out of steam.
When Tech Sneezes, the Market Catches a Cold
A quick look across U.S. equity futures shows a revealing pattern.
The E-mini NASDAQ 100 Futures (NQ), home to most AI and semiconductor giants, has posted a significantly lower monthly low compared to the prior month.
Meanwhile, the E-mini S&P 500 Futures (ES) declined much less, hinting at relative resilience, but also possible lagging weakness.
This divergence—NQ leading down while ES holds up—is a subtle warning. When the market’s growth engine (tech) loses traction, broader indices often follow with a delay. That’s the tension December traders are staring at: are we seeing the early signs of exhaustion before the holidays, or just a healthy pause?
Bearish Divergences Whisper “Caution”
The technicals are backing that cautious tone.
On the ES chart, the Commodity Channel Index (CCI) has been carving lower highs even as prices printed higher highs. This is a textbook bearish divergence, often an early sign that bullish momentum is fading.
The MACD histogram echoes the same message: momentum has been contracting through November despite new price highs, suggesting that underlying strength is eroding. Such divergences don’t predict direction on their own, but they do raise the probability of a short-term correction—or at least a choppy path into year-end.
The Price Map: Three Levels that Could Define December
Let’s outline the key technical zones traders are watching:
6,525.00: the prior monthly low—this is the first line of defense for the Santa Rally narrative. A break below this level would likely shift sentiment fast, especially if NQ continues under pressure.
6,239.50: the floor of a relevant UFO (UnFilled Orders) support zone. If ES dips below the prior low, this zone may become a “bear trap.” Many traders might short aggressively once 6,525.00 gives way, but those unfilled buy orders could absorb supply and trigger a sharp bounce. If the rally emerges from here, Santa might still make his visit.
4,430.50: a deeper UFO support cluster roughly 35% below current prices. If price were to cut through 6,239.50 and stay below it, the market would be entering a different regime altogether—likely accompanied by broken trendlines, volatility spikes, and a more defensive tone.
Reading Between the Lines: What the Divergence Means
Historically, the Santa Rally is powered by optimism, lighter volumes, and portfolio rebalancing. But this time, AI and semiconductor names—the champions of the current bull leg—are leading weakness.
That doesn’t mean doom; it means fragility.
The ES market may still rebound, but it’s doing so under reduced participation from the very sectors that drove prior gains.
Sizing the Trade Without Crossing the Line
For traders eyeing this setup through ES (E-mini S&P 500 futures) or MES (Micro E-mini S&P 500) futures, here’s a compliant, educational way to think about risk and position sizing:
Identify the Setup Zone: e.g., around 6,525.00 as potential demand, or below 6,239.50 as short-term breakdown.
Define Your Stop: the level where the technical picture is invalidated.
Set a Dollar Risk Limit: for instance, risking 1% of total account equity.
Derive Position Size: Divide your dollar risk by the price distance between entry and stop (converted into points). Then choose between the standard E-mini (ES) or Micro E-mini (MES) to match your risk tolerance and account size.
This framework lets traders adapt leverage responsibly—without needing the specific contract specs or margin figures, which vary by broker and time.
Risk Management: December Can Be a Trap
December is famous for emotional trading. The combination of holiday expectations, thinner liquidity, and year-end positioning can turn routine pullbacks into exaggerated moves.
That’s why focusing on risk before reward is critical.
The UFO support levels serve as reference zones where institutional activity might reappear, but they’re not guarantees. Managing stops, scaling out partial profits, and staying flexible matters more than trying to guess the market’s next headline.
ES and MES: Same Story, Different Scale
The Micro E-mini (MES) contract is a smaller version of the E-mini (ES), designed for traders who want the same price exposure but with lower notional size.
Both track the same index, tick for tick.
For traders exploring this December setup, the MES allows participation while controlling exposure more granularly—especially useful if volatility picks up and margin requirements shift.
Key Contracts Specs and Margins:
E-mini S&P 500 Futures (ES) with a point value = $50 per point.
Micro E-mini S&P 500 Futures (MES) with a point value = $5 per point.
As of the current date, the margin requirements for E-mini S&P 500 Futures and for the Micro E-mini S&P 500 Futures are approximately $22,400 and $2,240 per contract respectively.
Always verify the latest margin schedules and specifications directly with your broker or the exchange before entering trades, as those details update regularly and depend on market conditions.
Santa’s Setup: Scenarios to Watch
Scenario A — Santa Delivers: Price tests or slightly breaks the 6,525.00 low, finds support near 6,239.5, and rebounds into late December. Bearish divergences resolve sideways, and risk assets stabilize.
Scenario B — The Grinch Arrives: The 6,239.50 zone fails to hold, breaking trendline supports. The market slides toward 4,430.50, shaking off complacent longs and erasing part of the 2024-5 rally.
Both paths are technically valid. The difference will come from whether AI-heavy sectors regain strength—or confirm that this bull leg has indeed lost its engine.
Educational Takeaway
Divergences (CCI and MACD) highlight when momentum and price disagree—a sign of fatigue.
Intermarket analysis (ES vs. NQ) reveals where weakness may originate.
UFO levels identify potential institutional footprints—where traps or reversals often occur.
Discipline and risk control matter more than predicting whether Santa shows up.
Final Thought
Whether December brings gifts or grief may depend less on seasonal hope and more on how traders interpret these divergences.
If AI stocks can find footing again, the rally could revive. But if they keep sliding, this might be the year Santa takes a break.
When charting futures, the data provided could be delayed. Traders working with the ticker symbols discussed in this idea may prefer to use CME Group real-time data plan on TradingView: www.tradingview.com - This consideration is particularly important for shorter-term traders, whereas it may be less critical for those focused on longer-term trading strategies.
General Disclaimer:
The trade ideas presented herein are solely for illustrative purposes forming a part of a case study intended to demonstrate key principles in risk management within the context of the specific market scenarios discussed. These ideas are not to be interpreted as investment recommendations or financial advice. They do not endorse or promote any specific trading strategies, financial products, or services. The information provided is based on data believed to be reliable; however, its accuracy or completeness cannot be guaranteed. Trading in financial markets involves risks, including the potential loss of principal. Each individual should conduct their own research and consult with professional financial advisors before making any investment decisions. The author or publisher of this content bears no responsibility for any actions taken based on the information provided or for any resultant financial or other losses.

Generals Charge, Soldiers Stall: Reading Bearish Divergence1. Context: The Battle Line Between Large and Small Caps
This week’s futures landscape paints a striking contrast between leadership and hesitation. In the CME equity index universe, the large caps — ES (E-mini S&P 500), NQ (E-mini NASDAQ 100), and YM (E-mini Dow Jones) — advanced as a united front, all opening above their prior week’s highs. The market generals were charging confidently uphill.
Yet, on the same battlefield, the RTY (E-mini Russell 2000) lagged behind. The small caps failed to take out the prior week’s high and opened below the aggressive gaps that marked their larger counterparts. In trader terms, breadth was narrowing. In storyteller terms, the generals were calling “forward!” — but the soldiers weren’t following.
Such divergences in participation often mark transition zones in market psychology. When large caps push while small caps stall, it doesn’t necessarily mean the campaign is lost — but it does mean confidence among the broader troops is weakening.
2. Reading the Divergence: When Breadth Narrows
The relationship between large-cap and small-cap indices often reveals more than just price action — it exposes the structure of conviction. In sustained bullish environments, small caps tend to lead or at least confirm the move. Their participation signals that risk appetite is healthy across the field, not confined to the biggest names.
When that breadth fades, the advance becomes fragile. A rally driven only by mega-cap components (the generals) can stretch further, but with decreasing participation, it becomes increasingly vulnerable to shocks. Traders who watch intermarket behavior know this phenomenon as bearish divergence — higher highs in the generals, lower or flat highs in the soldiers.
From a practical standpoint, narrowing breadth implies that fewer sectors are carrying the index higher. In other words, the market’s engine is running on fewer cylinders. This is not a timing trigger on its own, but it is a powerful contextual clue suggesting that volatility could expand when the leadership stumbles.
3. Quantifying the Risk: Supports and Market Depth
Looking beneath price, Order Flow (UnFilled Orders) provides a sense of where liquidity may reside once the current rally pauses. Key UFO support zones, acting as potential demand clusters, reveal how far the market might travel before encountering fresh buy interest.
From this week’s open:
ES shows its next support roughly 5.26% below current levels.
NQ sits around 6.25% below.
YM’s cushion lies approximately 9.39% beneath.
RTY, however, faces a much deeper air pocket — the next notable UFO support sits nearly 13.99% lower.
This asymmetry is critical. If markets retreat, small caps have the most unprotected downside terrain before reaching meaningful support. In other words, the generals may fall back a few miles, but the soldiers could tumble down the hill.
These percentages don’t guarantee a move — they outline the potential amplitude of correction if risk-off flows accelerate. The deeper the distance to support, the larger the volatility zone beneath.
4. Strategic View: Large Caps Lead, but Are They Overextended?
The current setup puts traders in a classic tactical dilemma:
Are the generals inspiring a new advance, or are they overextended and exposed?
Two plausible scenarios emerge:
Continuation scenario: If the small caps (RTY) regain strength and take out their prior week’s high, the breadth gap could close. This would validate the generals’ move and reestablish a broad-based advance.
Correction scenario: If RTY continues to stall while ES, NQ, and YM fail to sustain their gaps, it would confirm a divergence-led weakening. A close back below prior week’s highs could trigger a retreat toward the support zones identified earlier.
The idea is not to predict a reversal, but to prepare a framework in case weakness unfolds.
5. Contract Overview: E-mini and Micro Versions
To analyze or engage these markets, traders can study both E-mini and Micro E-mini contracts listed on the CME. These contracts represent standardized ways to participate in U.S. equity index movements, but at different notional sizes.
E-mini contracts (ES, NQ, YM, RTY) are the long-standing institutional benchmark instruments that track major U.S. equity indices with efficient liquidity and tight spreads.
Micro E-mini contracts (MES, MNQ, MYM, M2K) provide the same exposure pattern at one-tenth the size, offering more granularity in risk management and flexibility for smaller accounts or precise hedging.
It’s important to understand that these futures allow directional and hedging applications without requiring ownership of the underlying equities. However, as with any leveraged product, margin requirements can amplify both gains and losses. Traders should familiarize themselves with margin-to-equity ratios and maintenance requirements before participation.
S&P 500 – ES / MES
Minimum tick: 0.25 points
Tick value: $12.50 (E-mini) | $1.25 (Micro)
Typical margin: ≈ $21K (E-mini) | ≈ $2.1K (Micro)
NASDAQ 100 – NQ / MNQ
Minimum tick: 0.25 points
Tick value: $5.00 (E-mini) | $0.50 (Micro)
Typical margin: ≈ $30K (E-mini) | ≈ $3.0K (Micro)
Dow Jones – YM / MYM
Minimum tick: 1 point
Tick value: $5.00 (E-mini) | $0.50 (Micro)
Typical margin: ≈ $13K (E-mini) | ≈ $1.3K (Micro)
Russell 2000 – RTY / M2K
Minimum tick: 0.10 points
Tick value: $5.00 (E-mini) | $0.50 (Micro)
Typical margin: ≈ $9K (E-mini) | ≈ $0.9K (Micro)
Please note that all margin requirements are approximate and may be adjusted.
6. Risk Management Spotlight
Breadth divergences can test patience and positioning discipline. Managing exposure becomes as important as analyzing the signal itself.
Here are three core reminders:
Position Sizing: Adjust to volatility. If the distance to the nearest support is wide, scale down accordingly to maintain a consistent risk percentage per trade.
Stop-Loss Discipline: Predetermine exit points based on technical invalidation, not emotion.
Capital Preservation: Capital is ammunition; running out of it limits participation when true opportunity returns.
In the end, risk management isn’t about avoiding loss; it’s about surviving long enough to thrive when clarity returns. When markets are divided between generals and soldiers, maintaining balance becomes a trader’s greatest edge.
7. Educational Takeaway
The “generals vs. soldiers” analogy reminds us that market structure is not just about price—it’s about participation. When large caps surge but small caps lag, it signals a potential exhaustion point in the broader advance. The healthiest rallies are those in which all troops move in sync.
For traders and investors, breadth divergences serve as an early-warning system, not a countdown clock. They encourage a review of exposure, tighter stop placement, and a shift toward risk-awareness rather than return-chasing.
At this stage, the technical setup across U.S. index futures reads like a fragile truce: ES, NQ, and YM maintain their gains above prior-week highs, while RTY still lingers below. Should the soldiers eventually follow, confidence could rebuild. But if the generals start retreating first, the path toward their UFO supports could unfold quickly.
The core takeaway: breadth divergences don’t predict timing—they illuminate imbalance. Recognizing that imbalance early allows traders to respond intelligently instead of react emotionally when volatility expands.
When charting futures, the data provided could be delayed. Traders working with the ticker symbols discussed in this idea may prefer to use CME Group real-time data plan on TradingView: www.tradingview.com - This consideration is particularly important for shorter-term traders, whereas it may be less critical for those focused on longer-term trading strategies.
General Disclaimer:
The trade ideas presented herein are solely for illustrative purposes forming a part of a case study intended to demonstrate key principles in risk management within the context of the specific market scenarios discussed. These ideas are not to be interpreted as investment recommendations or financial advice. They do not endorse or promote any specific trading strategies, financial products, or services. The information provided is based on data believed to be reliable; however, its accuracy or completeness cannot be guaranteed. Trading in financial markets involves risks, including the potential loss of principal. Each individual should conduct their own research and consult with professional financial advisors before making any investment decisions. The author or publisher of this content bears no responsibility for any actions taken based on the information provided or for any resultant financial or other losses.

Condor in the Clouds: When the S&P 500 Takes a Nap1 – The Setup Nobody Expected
The S&P 500 just pulled a classic “I’m tired” move. After that big drop, it stopped running and started hovering between 6,437 and 6,873 — a cozy sideways zone filled with Fibonacci levels, Floor Trader Pivots, and UFOs (yep, UnFilled Orders, not flying saucers).
Markets do that sometimes — they sprint, then nap. And when they nap, option sellers quietly collect theta while everyone else wonders when the action will come back.
2 – The Play: Short Iron Condor
When the market’s stuck in the middle, the Short Iron Condor is like putting walls on both sides of the price. Here’s the idea — you get paid if ES stays in between.
How it’s built:
Sell a Call above resistance
Buy a Call a little higher (that’s your safety net)
Sell a Put below support
Buy a Put a little lower (another safety net)
Boom — now you’ve boxed the market. If it behaves, you earn. If it doesn’t, your risk is capped.
3 – Why It Works Right Now
The Condor thrives when volatility chills out. That’s exactly what ES is doing — taking a breath after chaos.
Theta decay: your invisible ally, eating away at option value day by day.
Range stability: resistance ≈ 6,873, support ≈ 6,437.
Low Vega: volatility tantrums matter less.
You don’t need fireworks — you need patience. This trade doesn’t scream, it hums.
4 – The Fine Print (a.k.a. Risk Management)
Keep it real:
Size positions by max risk, not by excitement level.
Don’t wait for expiration — grab 50–60% profit and fly away.
When the market is calm, the Condor glides. When storms build, fold your wings.
5 – For the Data Nerds
If you love precision:
ES tick = $12.50
MES tick = $1.25
Margins ≈ $21k and $2.1k respectively (subject to volatility).
And yes — theta doesn’t care which one you trade; it just wants time to pass.
6 – The Takeaway
Markets don’t always trend. Sometimes they just drift — and that’s okay.
In those moments, the Short Iron Condor turns boredom into strategy.
So, if the S&P 500 keeps “floating in the clouds,” don’t chase it — collect from it.
Want More Depth?
If you’d like to go deeper into the building blocks of trading, check out our From Mystery to Mastery trilogy, three cornerstone articles that complement this one:
🔗 From Mystery to Mastery: Trading Essentials
🔗 From Mystery to Mastery: Futures Explained
🔗 From Mystery to Mastery: Options Explained
When charting futures, the data provided could be delayed. Traders working with the ticker symbols discussed in this idea may prefer to use CME Group real-time data plan on TradingView: www.tradingview.com - This consideration is particularly important for shorter-term traders, whereas it may be less critical for those focused on longer-term trading strategies.
General Disclaimer:
The trade ideas presented herein are solely for illustrative purposes forming a part of a case study intended to demonstrate key principles in risk management within the context of the specific market scenarios discussed. These ideas are not to be interpreted as investment recommendations or financial advice. They do not endorse or promote any specific trading strategies, financial products, or services. The information provided is based on data believed to be reliable; however, its accuracy or completeness cannot be guaranteed. Trading in financial markets involves risks, including the potential loss of principal. Each individual should conduct their own research and consult with professional financial advisors before making any investment decisions. The author or publisher of this content bears no responsibility for any actions taken based on the information provided or for any resultant financial or other losses.

From Tokyo with Love: Key Opportunities with Japan's Top Index1. Introduction
The Nikkei 225 is Japan's premier stock market index and one of the most widely followed indexes in the world. As the representative of Japan's economy, the Nikkei 225 includes many of the country’s most influential companies across various industries, such as Toyota, Sony, and SoftBank. With Japan being the third-largest economy globally, traders who seek exposure to the Asian market find the Nikkei 225 to be a crucial addition to their portfolios.
Now is an opportune time to study and potentially add the Nikkei 225 to your watchlist, as Micro contracts are set to launch later this year, offering greater accessibility to both institutional and retail traders. These micro contracts will allow traders to manage their positions with more precision, capital efficiency, and reduced exposure. With the futures contracts denominated in both US Dollars and Japanese Yen, traders can select their currency exposure based on market preferences.
Contract Specifications:
# Nikkei/USD Futures:
Contract size: $5 USD per index point
Tick size: 5 points = $25 USD per contract
Margin: USD $12,000 per contract at the time of producing this article
Trading hours: Almost 24-hour trading, covering Asian, European, and US sessions
# Nikkei/YEN Futures:
Contract size: ¥500 per index point
Tick size: 5 points = ¥2,500 per contract
Margin: JPY ¥1,200,000 per contract at the time of producing this article
Trading hours: Mirrors the USD futures trading hours for global reach
For traders looking for exposure to Japan’s economy, these contracts offer versatile trading opportunities with sufficient liquidity, price movement, and round-the-clock accessibility. You can access real-time data on these contracts through TradingView - view the data package at www.tradingview.com
2. Global Market Diversification
The Nikkei 225 Index offers more than just exposure to the Japanese market; it’s a portal into Asia’s largest and most developed economy. With Japan being an export-driven economy, exposure to the Nikkei 225 allows traders to capitalize on trends in global manufacturing, technology, and industrials.
Additionally, during periods of macroeconomic divergence—where the economic performance of regions like the US and Asia deviate—the Nikkei 225 can provide a non-correlated trading opportunity.
3. Correlation and Hedge Against US Equities
While Japan is a developed economy like the United States, its market dynamics differ substantially. The Nikkei 225 often shows a lower correlation with US equity markets, meaning that the index tends to react differently to global and local economic events compared to indices like the S&P 500.
This graph illustrates the rolling 30-day correlation between the Nikkei 225 and the S&P 500, highlighting the fluctuating relationship between the two indices and how they decouple at times, especially during periods of heightened market volatility.
4. Japanese Yen and US Dollar Denominated Contracts
One of the unique aspects of the Nikkei futures is the ability to trade the index in either US Dollars or Japanese Yen. This flexibility allows traders to choose the contract that best suits their currency exposure preferences, providing a powerful tool for those who also wish to hedge or capitalize on currency movements.
Nikkei/USD Futures: These contracts are settled in US dollars.
Nikkei/YEN Futures: Conversely, for traders who want to factor in currency risk, the Yen-denominated futures offer exposure not just to the Nikkei 225’s price movements but also to the Yen's fluctuations against the US dollar or other currencies.
As the introduction of Micro contracts approaches, this will add even more flexibility for traders, particularly retail traders who prefer smaller contract sizes and more precise risk management. These contracts will enable traders to adjust their positions with greater capital efficiency, allowing for a wider range of strategies—from short-term speculative trades to long-term hedging positions.
5. Monetary Policy Divergence
Japan's monetary policy, led by the Bank of Japan (BoJ), has been historically distinct from the policies of the US Federal Reserve and European Central Bank (ECB).
Understanding Japan's monetary policy divergence allows traders to better time their entry and exit points in the Nikkei 225, especially as the Bank of Japan navigates its unique approach to economic stimulus and potential shifts in strategy.
6. Sector Opportunities
The Nikkei 225 is heavily weighted towards key sectors that represent the backbone of Japan’s economy, offering traders exposure to industries that may be underrepresented in other global indices. Some of the most prominent sectors within the Nikkei 225 include:
Technology: Japan is a leader in technology and innovation, with major companies such as SoftBank and Sony leading the charge.
Automotive: Japan’s automotive sector is world-renowned, with giants like Toyota, Honda and Nissan among the top constituents of the index. As global trends shift toward electric vehicles and sustainable manufacturing, Japan’s automotive industry stands to benefit.
Manufacturing: As a global manufacturing powerhouse, Japan's output is closely tied to global demand.
The Nikkei futures provide traders with a way to express their views on these industries, capitalizing on global demand trends in high-tech products, automobiles, and industrial manufacturing.
7. Volatility Trading
One of the key attractions of the Nikkei 225 futures is the index's volatility, which is often higher than that of its Western counterparts, such as the S&P 500. Traders who thrive in volatile environments will find the Nikkei 225 particularly appealing, as it presents more frequent and larger price swings. This heightened volatility is especially noticeable during global economic shocks or shifts in local economic policy.
Additionally, since Japan's market opens several hours before European and US markets, traders can use the Nikkei 225 to capture early momentum shifts that may influence sentiment in Western markets as they open.
This graph highlights the elevated volatility of the Nikkei 225 compared to the S&P 500.
8. Japan’s Political and Economic Landscape
Japan has been taking proactive steps toward economic reform in recent years. With initiatives aimed at corporate governance improvements, stimulus packages, and structural reforms. Several factors make Japan's political and economic landscape appealing for traders:
Corporate governance reforms: Japan has been improving its corporate governance structure, making its market more attractive to both domestic and foreign investors.
Economic stimulus packages: These government-led initiatives have provided a tailwind for many sectors within the Nikkei 225.
Weakening Yen: Japan’s export-driven economy has benefited from a weaker Yen, which boosts the competitiveness of Japanese goods on the global stage.
The potential for long-term growth makes the Nikkei 225 an appealing market for those who follow macro-driven opportunities.
9. Geopolitical Events and Trade Dynamics
Japan remains one of the world’s largest exporters, and as such, the Nikkei 225 is heavily influenced by global trade relations, particularly with the US and China. Traders can use the Nikkei 225 to take positions based on their views of the global geopolitical landscape. For example:
US-China trade tensions: Japan, being a major exporter to both countries, finds itself deeply connected to global trade trends.
Global demand for Japanese exports: Changes in global trade agreements or tariff structures could either boost or harm the performance of these industries.
10. Liquidity
Liquidity remains an important consideration, as the S&P 500 contracts offer greater liquidity, but the growing interest in the Nikkei 225 has resulted in increased volumes in recent months. As Micro contracts are introduced, the liquidity of the Nikkei 225 is likely to improve, making it an even more attractive trading instrument for all types of traders.
This graph highlights the trading volumes for both Nikkei 225 and S&P 500 futures.
11. Cumulative Returns Comparison
When comparing cumulative returns over time, the Nikkei 225 has demonstrated significant growth. However, this growth has come with a higher level of volatility than the S&P 500.
The Nikkei 225's higher risk-reward profile makes it an attractive option for traders looking to capture short- to medium-term gains during periods of economic growth or policy shifts in Japan.
This graph shows the cumulative returns of the Nikkei 225 versus the S&P 500.
12. Price Range Opportunities
The average daily price range of the Nikkei 225 is another compelling factor for active traders. The Nikkei 225 frequently exhibits larger daily price movements than the S&P 500, especially during periods of high volatility. This makes it an ideal market for short-term traders looking to capitalize on intraday price swings.
The graph, where daily price ranges have been multiplied by their corresponding point values, demonstrates how the Nikkei 225 has exhibited wider price ranges.
13. Conclusion
The Nikkei futures offer a unique set of opportunities for traders looking to diversify their portfolios, capitalize on volatility, and gain exposure to Japan’s leading industries. It is a powerful tool for both short-term traders and those with longer-term macro views.
In addition, the forthcoming Micro contracts will make the Nikkei 225 accessible to a wider range of traders, allowing for more precise risk management and exposure adjustments.
Key takeaways for traders considering the Nikkei futures include:
Global diversification beyond US and European markets.
The ability to hedge against US equity volatility.
Opportunities in high-growth sectors such as technology and automotive.
The potential for higher volatility, offering both risk and reward.
Flexible contract options in both USD and Yen, allowing for currency risk management.
For traders looking to add a new dynamic instrument to their watchlist, the Nikkei/USD and the Nikkei/YEN futures are a potentially ideal candidate, combining diversification, volatility, and sectoral exposure into a powerful trading product.
When charting futures, the data provided could be delayed. Traders working with the ticker symbols discussed in this idea may prefer to use CME Group real-time data plan on TradingView: www.tradingview.com - This consideration is particularly important for shorter-term traders, whereas it may be less critical for those focused on longer-term trading strategies.
General Disclaimer:
The trade ideas presented herein are solely for illustrative purposes forming a part of a case study intended to demonstrate key principles in risk management within the context of the specific market scenarios discussed. These ideas are not to be interpreted as investment recommendations or financial advice. They do not endorse or promote any specific trading strategies, financial products, or services. The information provided is based on data believed to be reliable; however, its accuracy or completeness cannot be guaranteed. Trading in financial markets involves risks, including the potential loss of principal. Each individual should conduct their own research and consult with professional financial advisors before making any investment decisions. The author or publisher of this content bears no responsibility for any actions taken based on the information provided or for any resultant financial or other losses.

... and as this bubble bursts; When and just how bad? ... (II.)... Feel free to come up with your own preferred narrative.
Here is the the Original Post;
This current post;
is generally just a cleaned up version of the original.

LONG - Dow Jones Industrial Average (DJI)Hi there!
This idea/trade is pretty simple and it comes up few and far between. It is strictly based on price and nothing else. Human nature never changes and it's interesting that the two times this has happened in the past were also during "panics". These trades typically last a few months so just keep that in mind. The details are below.
All the best,
Andre
CHART INTERVAL
2W (2 Weeks)
THE SIGNAL
When the close is more than -3 standard deviations below the 20 period linear regression on this time frame, it indicates an amazing long opportunity. The exit is a 2W close above a 10 period simple moving average.
THE RESULTS
This has only ever happened twice:
First Time
Entry: November 11 1929 @ the open (220.39)
Draw down: -11.36%
Run up: +24.78%
Exit: February 2 1930 @ the open (270.54 +22.76%)
Second Time
Entry: October 26 1987 @ the open (1839)
Draw down: -5.72%
Run up: +13.00%
Exit: February 29 1988 @ the open (2032.20 +10.51%)
THE RISK
As you can see from the trade draw downs the maximum is -11.36%, of course it is absolutely possible to exceed that.
**Important: Remember that leverage increases the draw down number... i.e -11.36% with 3x leverage is -34.08%***

Weekly Rounded Top vs. +30% From the Low: look to long lower?Bullish: Every week since the low has closed green except this week.
Bearish: The last week of each month have been particularly bearish since January.
The overwhelming bull trend that's taken place over the past few weeks have been disorienting. My bias is now leaning neutral. I will consider the downtrend on hold if the monthly closes above the 17th of April high.
Will switch bullish wiith a swiftness once issues with global oil pricing and the pandemic are resolved. Keeping an eye on the China/U.S. trade squabble.
Black lines at the top/bottom are based on support/resistance levels and volume gaps. I should note that I am preferring the futures contract to chart for its longer session vs. the regular SPY chart or index.
Recent oil news:
Lack of available storage, due to it being so darn cheap to stock up on now, led to the dump of the front month futures contract. Oil also expires which explains why months further out are not as affected.
www.bloomberg.com
www.aljazeera.com
www.wsj.com
Recent coronavirus/COVID-19 news (only what could possibly be related to the markets' pricing):
Possible vaccine, mRNA-1273, currently in human trials and stocks such as MRNA and GILD megapumped. Vaccines require time for trials/mass production, so it would be interesting to see how price would react the next time when a solid date on vaccine delivery is announced for...every country? I don't believe there's a globally accepted guideline on vaccine distribution.
www.nasdaq.com
time.com
www.who.int
Recent China/U.S. e-fight news:
TBD
There's a lot of articles out there without any proper coverage. Repeating old news in new publishments and talks related to the virus. The latter is important but oftentimes involves too much speculation and journalist bias.

SHORT Dow Jones Carves A Lower High at 24860!The Dow Jones index has made yet another high at 24860 levels before pulling back, which could be a potential top for the down trend to resume further. Please note that Dow Jones pulled back close to the down trend line passing through around 25150 levels and just ahead of fibonacci 0.786 resistance at 25100 levels respectively. This might not be a confirmed bearish reversal though but potential remains for bears to take control from here. Looking at the wave structure, after having produced an impulse wave lower Wave (1), followed by a flat corrective Wave (2), the Dow Jones might be unfolding Wave (3) lower and might have completed waves i and ii at 21800 and 24860 levels respectively. If the above structure holds, we could see much lower levels going forward. Please note that 26000 levels needs to hold for bearish structure to build on from here.
Disclaimer:
This written/visual material is comprised of personal opinions and ideas. The content should not be construed as containing any type of investment advice and/or a solicitation for any transactions. It does not imply an obligation to purchase investment services, nor does it guarantee or predict future performance. FXTM, its affiliates, agents, directors, officers or employees do not guarantee the accuracy, validity, timeliness or completeness of any information or data made available and assume no liability for any loss arising from any investment based on the same.
