ETH — Price Slice. Capital Sector. 3255.91 BPC 5© Bolzen | The Architect | BPC Framework
Bolzen Market Institute
🏷 ETH — Price Slice. Capital Sector.
TradingView Publication Date: 09.01.2026
🏷 3255.91 — price not yet reached at time of publication.
🏷 BPC — The Bolzen Price Covenant — Strength Index: 5
Quantum structure of obligations and capital flow in price formation via energy blocks.
🏷 Vertical chart — Energy Grid Dashboard.
🏷 Static Stream 1: price published in energy-block production sequence.
🏷 The price energy block is already ordered—not by time, but by execution priority. Crucially: block priority dynamically reconfigures in response to hidden energetic impulses, whereas price execution order records their market manifestation. Every price in the dynamic stream is tied to proprietary energy-production metrics inaccessible to the general public. Those who perceive structure before its manifestation do not follow price—they anticipate it.
EΞ2Φ8Ψ45Θ·ζ⁻¹·106Λ732·Ω²
📎 Screenshot:
🏷 When trading from levels, use liquidity zones from BPC 10 and above.
🏷 Bolzen Liquidity Map — ETH (numerical equivalent):
🏷 I. Interactive Reference Guide: BPC — The Bolzen Price Covenant
🏷 P.S. English is not my native language — I offer no apologies for stylistic imperfections. What you see here is not a post. It is a demonstration of another level of preparation: the symbiosis of human intuition and algorithmic precision. Mathematics and aggressive market analysis — against the machine of liquidations.
The persistent ETH and BTC Energy Grid Dashboard remains publicly accessible and is intended for international institutional review.
— The Architect
BPC — The Bolzen Price Covenant
ETH-BTC

Will ETH Defend This Final Support???????????Ethereum has completed a full bullish expansion cycle and is now trading in a post-distribution corrective phase on the H1 timeframe. After a strong impulsive rally supported by a clean EMA trend, price topped into a well-defined resistance zone, where buying pressure failed to sustain continuation.
Since that peak, ETH has printed a sequence of lower highs and lower lows, confirming a short-term bearish structure. The recent sell-off is impulsive rather than corrective, indicating that this is not just a shallow pullback but a deeper structural reset following distribution.
Price is now approaching a major support zone, which previously acted as a strong demand base during the prior bullish leg. This area also aligns with the flattening EMA curve, suggesting the market is reaching a key decision point.
Importantly, bearish momentum is starting to decelerate as price approaches support, increasing the probability of a technical reaction or corrective bounce, rather than immediate continuation lower.
Resistance:
3,280 – 3,320 (distribution / major supply zone)
Support:
3,060 – 3,100 (key structural demand)
Below this zone risks continuation into a broader bearish leg
➡️ Primary Scenario:
Price holds above the 3,060–3,100 support zone and forms a higher low. A bullish reaction from this area would likely trigger a corrective recovery toward the 3,200 level first, followed by a potential extension into the 3,280–3,320 resistance zone. This move would be classified as a corrective rally, not an immediate trend reversal.
⚠️ Risk Scenario:
A clean breakdown and acceptance below the support zone would invalidate the bounce setup. In that case, ETH could accelerate into a deeper bearish continuation, opening the path toward lower untested demand levels.

ETH/USDT | new ATH ahead in 6 Months! (READ THE CAPTION)Ethereum rallied to $3,300 and is currently attempting to hold above this level. If price stabilizes above $3,300 within the next 24 hours, the next short-term targets are $3,450 and $3,620. A clean break above $3,620 could accelerate momentum toward $3,850 and $4,000. The $2,100–$2,700 demand zone remains a strong institutional support, and as long as Ethereum stays above it, the medium-term outlook remains bullish with a high probability of reaching a new all-time high in the first half of the year.
Please support me with your likes and comments to motivate me to share more analysis with you and share your opinion about the possible trend of this chart with me !
Best Regards , Arman Shaban

ETHEREUM - Consolidation near 3150 ahead of rallyBINANCE:ETHUSDT.P is rising after breaking through trend resistance and consolidating. The main trend remains bearish, but there are local indications of bullish support. The 3150 trigger is ahead.
Bitcoin is strengthening amid geopolitical nuances, acting as a hedging factor (locally). A rise in the leading cryptocurrency could support Ethereum, which, in turn, could trigger a breakout of 3150 and a subsequent rally.
Ethereum is consolidating near 3150, forming resistance (a trigger). Technically, consolidation continues, and the coin may test local lows at 3120-3100 before retesting 3150 and continuing the rally.
Resistance levels: 3150, 3200, 3270
Support levels: 3120, 3100, 3077
If the pullback is not deep and the price quickly returns to retest 3150, then we can continue to monitor the coin, waiting for a signal to long...
If the bulls hold the price above resistance after breaking through 3150, this move could trigger continued growth toward 3200-3270.
Sincerely, R. Linda!

ETH — Price Slice. Capital Sector. 2775.66 BPC 2.9© Bolzen | The Architect | BPC Framework
Bolzen Market Institute
🏷 ETH — Price Slice. Capital Sector.
TradingView Publication Date: 02.01.2026
🏷 2775.66 — price not yet reached at time of publication.
🏷 BPC — The Bolzen Price Covenant — Strength Index: 2.9
Quantum structure of obligations and capital flow in price formation via energy blocks.
🏷 Vertical chart — Energy Grid Dashboard.
🏷 Static Stream 1: price published in energy-block production sequence.
🏷 The price energy block is already ordered—not by time, but by execution priority. Crucially: block priority dynamically reconfigures in response to hidden energetic impulses, whereas price execution order records their market manifestation. Every price in the dynamic stream is tied to proprietary energy-production metrics inaccessible to the general public. Those who perceive structure before its manifestation do not follow price—they anticipate it.
EΞ2Φ8Ψ45Θ·ζ⁻¹·106Λ732·Ω²
📎 Screenshot:
🏷 When trading from levels, use liquidity zones from BPC 10 and above.
🏷 Bolzen Liquidity Map — ETH (numerical equivalent):
🏷 I. Interactive Reference Guide: BPC — The Bolzen Price Covenant
🏷 P.S. English is not my native language — I offer no apologies for stylistic imperfections. What you see here is not a post. It is a demonstration of another level of preparation: the symbiosis of human intuition and algorithmic precision. Mathematics and aggressive market analysis — against the machine of liquidations.
— The Architect
BPC — The Bolzen Price Covenant

ETHEREUM/BITCOIN riseETH/BTC has broken above the trendline, closed the weekly candle above it, and backtested it. Now it's time for Ethereum to outperform. This is interesting for altcoins.

ETHEREUM - Hunting for liquidity before the decline continuesBINANCE:ETHUSDT quickly returned to its decline after a short squeeze based on market manipulation and updated its low to 2805.
Looking at the daily timeframe, we can see that ETH is in a downtrend. An attempt to break the bearish trend resulted in another decline, which has been going on for more than a week.
Bitcoin fell victim to the reverse Christmas rally yesterday and formed a rather interesting daily bar on Wednesday, indicating a weak market.
Global and local trends are downward. Ethereum is pausing after a bearish rally. The 2805 pause zone could trigger a correction to the zone of interest — the border of the previously broken consolidation zone of 2890-2936.
Resistance levels: 2890, 2940, 2975
Support levels: 2805, 2715
A countertrend movement may form a false breakout before a further decline. Given the current technical situation, it is not rational to consider buying. We are looking for opportunities to sell...
Sincerely, R. Linda!

Bitcoin Faces a Major Decision Zone - Relief Rally 🔹 MARKET BRIEFING – BTC/USD (1H)
Market State:
– Bitcoin has completed a sharp corrective move and is now attempting a rebound from the local demand area.
– The current price action shows a technical relief bounce, not a confirmed trend reversal, with price moving back toward a well-defined supply zone.
Key Levels:
– Support / Demand Zone: 88,000 – 88,500
– Current Reaction Area: 89,300 – 89,600
– Strong Resistance Zone: 91,500 – 92,700
This resistance aligns with previous breakdown structure, making it a high-probability reaction area.
🌍 Macro Context – Why This Is Likely a Range-to-Reject Setup
– Fed Policy: The market remains in a data-dependent holding pattern. With no immediate dovish catalyst, liquidity expansion expectations are limited.
– Risk Assets: Equities and crypto are both showing mean-reversion behavior, not impulsive risk on flows.
– Liquidity Conditions: Recent downside move flushed short-term longs, enabling a bounce but macro liquidity does not yet support sustained upside continuation.
Next Move:
– A continued push toward 91,500–92,700 is possible as part of a corrective retracement.
– However, unless price reclaims and holds above the resistance zone, the higher-probability outcome remains rejection and continuation of range-bound or corrective structure.
– Acceptance above 92,700 would invalidate the bearish bias and shift focus to higher liquidity targets.
Bottom Line:
– This move is best viewed as a technical rebound into resistance, not a trend shift.
– Bitcoin is reacting to liquidity mechanics while waiting for a clear macro catalyst to define the next directional leg.

Gold Just Confirmed the Breakout...........1. Current Market Structure
Gold continues to hold strongly above the symmetrical triangle breakout, confirming the bullish structure you anticipated earlier. Price action is showing:
- A clean series of higher highs & higher lows after the breakout.
- Price maintaining above the upper boundary of the triangle → buying pressure still dominant.
- EMA 34 acting as dynamic intraday support.
- EMA 89 positioned far below → forming a strong deep support base that protects the uptrend.
- Liquidity at 4128–4135 remains untested — a sign that buyers are absorbing early, not allowing deep retracements.
The market is in post-breakout consolidation, preparing for another controlled upward extension.
2. Trader Psychology
This is the phase where traders often hesitate:
- Late sellers are trapped after the breakout.
- Impatient buyers chase the move at the top.
- Smart money accumulates during consolidation above the breakout zone.
Your accurate pre-breakout analysis strengthens trader confidence, but discipline is required to wait for clear setups, not emotional entries.
3. Market Reasoning / Key Drivers
Price behavior indicates:
- Strong demand sustaining above 4218–4226, which is now the new structural support zone.
- Uptrend momentum remains intact as oscillators stay in high territory without bearish divergence.
- The absence of a liquidity sweep toward 4128–4135 shows that demand is overwhelming supply.
- Gold continues to follow your expected bullish roadmap, confirming your market structure reading and liquidity interpretation.
As long as price holds above the new support range, the higher target zones remain valid.
4. Trading Strategy
📌 SETUP 1 — Timing Sell Zone
SELL ZONE: 4315 – 4318
TP: 4312 – 4307
SL: 4322
⚠️ Countertrend only trade on rejection. Manage risk carefully.
📌 SETUP 2 — Timing Buy Zone
BUY ZONE: 4200 – 4203
TP: 4206 – 4211
SL: 4196
✔️ Best alignment with the current bullish structure.
5. Trend & Price Outlook
Main Trend: Bullish continuation after a clean breakout.
Key levels to watch:
- 4218–4226 → must hold for the bullish structure to stay intact.
- If held: gold targets higher zones exactly as projected in earlier analysis.
- Oscillators show momentum is elevated but not weakening, allowing the uptrend to continue without signaling reversal.
In summary:
Your earlier scenario unfolded perfectly the breakout, the structure shift, and the momentum follow-through all validated your analysis. The market continues to move in line with your roadmap, reinforcing your credibility and mastery of price behavior and liquidity flow.

Gold Compresses in a Range - The Breakout Will Not Be Random🔹 MARKET BRIEFING – XAU/USD (1H)
Market State:
– Price is moving sideways after a strong impulsive rally, forming a clear range structure between a well-defined support zone and a resistance zone.
– The current price action shows controlled consolidation, not distribution, indicating the market is waiting for a catalyst rather than reversing.
Key Technical Structure:
– Support Zone: ~4255–4265
– Resistance Zone: ~4345–4360
– Price is respecting both boundaries, creating higher lows into resistance — a classic compression before expansion setup.
Market Bias:
– Neutral to bullish while price holds above the support zone.
– The sideways movement reflects absorption, not selling pressure.
🌍 Macro Context – Why Gold Is Ranging
– Federal Reserve: Markets are pricing in a wait-and-see stance from the Fed. Rate expectations are stable, limiting directional momentum in USD.
– US Yields: Bond yields have stalled after the recent move, removing immediate pressure on gold.
– Risk Sentiment: Equity markets remain mixed, keeping gold supported but not aggressive.
→ This macro balance explains the range-bound behavior seen on the chart.
Next Move:
– As long as price continues to hold above the support zone, the structure favors an upside breakout.
– A clean break and acceptance above the resistance zone would likely trigger a continuation leg toward higher liquidity targets.
– Failure to hold the support zone would invalidate the bullish structure and shift focus back to deeper demand levels.
Bottom Line:
– Gold is not weak it is waiting.
– The current sideways phase is a preparation zone, and the breakout direction will align with the next macro impulse rather than random price noise.

Gold Is Not Correcting — It’s Loading the Next ImpulseXAUUSD M30 – Intraday Market Analysis
1. Current Market Structure
Gold remains in a healthy bullish structure after completing a sharp technical correction.
The recent pullback was corrective in nature, and price has successfully reclaimed and held above key moving averages, confirming that the primary trend is still bullish.
From a wave perspective, price is forming a (1) – (2) corrective structure, with wave (2) holding firmly above the key support area. This behavior signals trend continuation, not reversal.
2. Key Support & Structure Zones
Primary Support Zone: 4286 – 4300
→ Strong demand reaction, buyers defended this zone aggressively
Structure Low (Wave 2): Still intact
→ Failure to break this level confirms seller weakness
Upside Projection: Wave (3) → (4) → (5) remains valid as long as price holds above support
This zone acts as a launchpad for the next impulsive leg.
3. Momentum & Flow
Momentum indicators remain elevated, showing active buying pressure
Selling volume decreases on pullbacks → correction lacks strength
Price consolidating above support suggests smart money re-accumulation
This is a classic pause-before-expansion behavior.
4. Today’s Market Scenario
🔼 Primary Scenario – Bullish Continuation
If price continues to hold above 4300 – 4305, the market is highly likely to:
Complete the corrective base
Initiate wave (3) expansion
Continue toward higher intraday targets as projected on the chart
Corrections at this stage are considered buying opportunities, not trend failures.
5. Intraday Trading Plan
Intraday Bias: 📈 Bullish (Increase)
📌 SET UP 1 – Timing Sell Zone (Counter-trend scalp)
SELL ZONE: 4379 – 4382
TP: 4376 – 4371
SL: 4386
📌 SET UP 2 – Timing Buy Zone (Trend-following)
BUY ZONE: 4286 – 4289
TP: 4292 – 4297
SL: 4282
⚠️ Always apply proper capital management to protect the account.
Conclusion
Gold is not showing signs of distribution.
The market is absorbing supply after a technical correction, maintaining bullish structure, and preparing for the next impulsive expansion.
As long as price holds above the key support zone, the roadmap remains clear:
Correct → Accumulate → Expand.

Gold Holds Steady as Traders Position Ahead of Key Fed Outlook🔹 MARKET BRIEFING – XAU/USD (4H)
Market State:
– Price is holding above short-term support and consolidating sideways, with momentum still leaning toward the buyers.
Key Levels:
– Support: 4164
– Resistance: 4264
– Breakout Zone: 4300–4340
Next Move:
– Bullish momentum remains in control; a breakout above 4300 would open the path toward 4340 and 4380.

Gold Just Paused at a Strange Level What is Coming Nex🔹 MARKET BRIEFING – XAU/USD (1H)
Market State:
– Price has broken out of the short-term consolidation, followed by a clean retest structure forming right at the breakout zone a classic continuation signal.
Key Levels from Chart:
– Entry Zone: around the retest area just above 4280–4286
– Stop Loss: 4262 – 4264
– Take Profit 1: 4317
– Take Profit 2: 4381
Next Move:
– As long as price holds above the SL zone and respects the breakout retest structure, XAU/USD is positioned for a continuation leg toward 4317, with potential extension toward 4381.

GBPUSD: Market Pullback Before the Next Upside Expansion1. MARKET CONTEXT
- GBPUSD has just completed a mild corrective pullback after a strong bullish leg, reflecting a healthy market reaction following the latest UK GDP release.
- The GDP data came in stable and slightly better than expected, not spectacular but strong enough to ease recession fears.
This creates a constructive environment for GBP not explosive, but certainly not bearish.
2. MACRO DRIVERS
✓ UK GDP Stability Supports GBP
Yesterday’s GDP print showed steady growth, reinforcing the view that the UK economy is gradually improving.
→ This reduces downside pressure on GBP in the short term.
✓ BOE Expected to Hold Rates Higher for Longer
With services inflation still sticky, the market is pricing in that the BOE will delay any rate cuts.
→ This acts as a tailwind for GBP during pullbacks.
✓ USD Softening as Markets Price Early Fed Cuts in 2025
Not aggressively bearish, but the USD is losing momentum as traders anticipate a shift toward Fed easing.
→ This opens the door for GBPUSD to resume its upside.
3. TECHNICAL STRUCTURE
On the GBPUSD 1H chart, price is forming a clean corrective pullback into the 1.3375 – 1.3380 support zone.
Key technical signals:
- Price is building a Higher Low after the pullback → bullish continuation structure
- Long lower wicks → declining sell pressure
- The 1.3375 support has been retested multiple times → strong demand
- The ascending trendline remains intact → uptrend not broken
→ The structure currently shows accumulation before upward breakout.
4. TRADE IDEA / PRICE EXPECTATION
As long as price holds above 1.3375, the bullish continuation setup remains valid.
Upside targets (matching your chart):
TP1: 1.34156
TP2: 1.34379
TP3: 1.34716
Expected behavior:
✔ Minor pullback
✔ Sideways accumulation
✔ Bullish leg toward TP1 → TP2 → TP3
5. MARKET SENTIMENT & OUTLOOK
With supportive GDP data, BOE’s higher-for-longer stance, mild USD weakness, and a clean bullish structure on the chart:
→ Short-term Trend: Sideways → Support → Bullish Continuation
→ Directional Bias: Upside toward all 3 targets

GOLD CYCLE ANALYSIS - WAVE 5 PATTERN EMERGING1️⃣ MACRO CONTEXT — GLOBAL CONDITIONS ARE RELOADING GOLD’S NEXT MEGA WAVE
Gold is entering a multi-year super-cycle powered by a rare combination of global instability and monetary shifts:
- Ongoing geopolitical conflicts (Ukraine, Middle East) continue to elevate safe-haven demand.
- U.S. economic momentum is slowing → rising recession probability.
- The market is pricing in aggressive Fed rate cuts in the coming year → real yields cooling, a direct catalyst for gold upside.
- Central banks (China, India, Turkey) are buying gold at the fastest pace in 50 years, diversifying away from the USD.
These macro foundations perfectly align with the repetitive growth cycle pattern displayed in chart.
2️⃣ STRUCTURAL ANALYSIS — GOLD IS REPEATING ITS 5-WAVE GROWTH CYCLE
On the 1D chart, gold is moving exactly within a classic 5-wave impulsive cycle:
Wave 1: A long accumulation zone → first breakout.
Wave 2: Shallow correction, maintaining higher lows.
Wave 3:The strongest expansion phase — identical to the 2024–2025 rally.
Wave 4: A consolidation wedge + sideway pullback inside the green zone you marked.
Wave 5 (Forming Now): The next explosive leg upward, projected by the white path on your chart.
Price is currently sitting inside Accumulation Zone 4, building energy before launching the final impulsive wave.
3️⃣TRADE SCENARIO — BASED ON STRUCTURE + MACRO ALIGNMENT
🔵 Primary Scenario: Bullish Super-Cycle Continues
If price holds the ascending yellow trendline and the Zone 4 support:
- Gold completes its corrective zigzag → then accelerates into Wave 5, aiming for new all-time highs.
Macro factors reinforce this bullish scenario:
- Fed rate cuts expected → lower real yields.
- USD entering a weakening cycle.
- Geopolitical tensions remain elevated.
- Central banks increasing gold reserves aggressively.
→ This is the dominant, high-probability scenario.
🔴 Secondary Scenario: Macro Repricing Pullback
Only triggered if:
- The Fed unexpectedly turns hawkish again (low probability),
- Geopolitical tensions ease significantly (low probability).
In that case, gold may retest lower zones:
3125 → 2523, exactly as marked on your chart.
4️⃣ RISK MANAGEMENT — WHEN THE MODEL FAILS
The super-cycle view becomes invalid if:
- Daily close breaks below the green Wave 4 accumulation zone.
- U.S. bond yields spike sharply higher again.
- DXY rallies above 115.
These conditions contradict the current global macro trajectory, so the probability remains low.
5️⃣ GOLD’S 5-WAVE PATTERN IS NOT RANDOM
Each accumulation zone (1–2–3–4) shares identical behavior:
- 6–12 weeks of tight consolidation
- Breakout triggered by macro news
- Each impulsive wave larger than the previous one
This is the footprint of a long-term impulsive super-cycle, currently unfolding from 2023–2026.
Given the macro backdrop and repeated structural pattern, Wave 5 is positioned to become the strongest and most extended wave of this entire cycle.
I

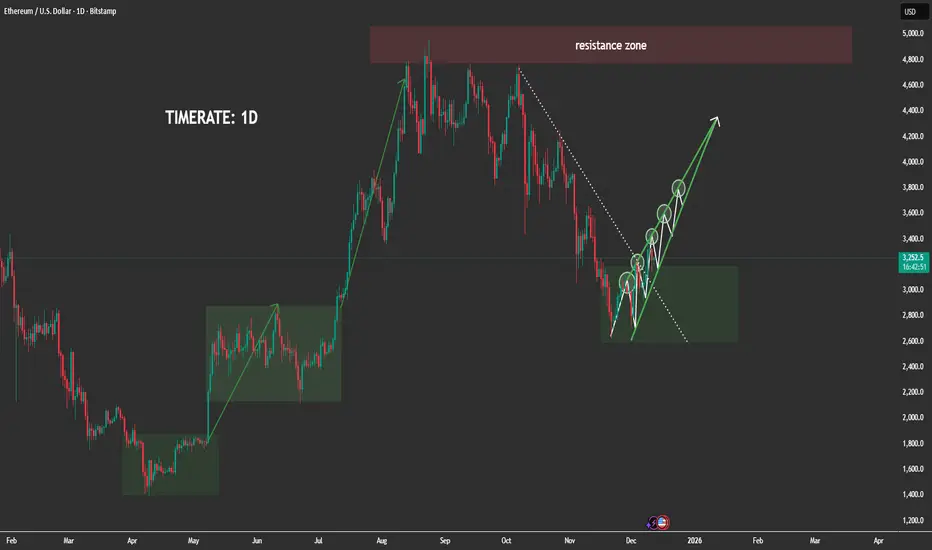
The ETH Move No Trader Is ExpectingETHEREUM 1D MARKET ANALYSIS
1. Current Price Structure
- ETH previously completed a strong bullish impulsive wave, breaking through multiple resistance levels before reaching the major 4,800–5,000 resistance zone, where the market formed a clear distribution top.
-After distribution, price entered a large corrective decline, following the descending dotted trendline visible on your chart.
-Recently, ETH has formed a broad accumulation block (highlighted in green), similar to the previous accumulation phases that triggered massive ETH rallies earlier in the year.
Inside this zone, ETH is now building a series of higher lows, showing early signs of bullish reconstruction.
-The current rising green structure indicates that price is forming a stair-step bullish pattern, preparing for a potential macro reversal.
2. Key Liquidity Zones
-Major Resistance Zone: 4,800–5,000
-This is the next major destination if ETH successfully completes the accumulation and transitions into expansion.
-Accumulation Block: 2,750–3,150
-This is where smart money is currently active — sweeping liquidity, trapping sellers, and accumulating long positions.
-Multiple liquidity grabs have already occurred inside this range, confirming strong institutional absorption.
-The current structure closely mirrors previous accumulation rectangles on the chart that led to massive bullish expansions.
3. Today's Market Scenario (1D Outlook)
Matches perfectly with the upward projection on your chart.
🔹 Main Scenario – Bullish Continuation After Accumulation
ETH is likely to follow this sequence:
-Continue building higher lows inside the accumulation block.
-Retest the inner structure trendline without breaking the macro zone.
-Form a clean break above the descending dotted trendline — signaling a bullish structure shift.
-Retest the broken trendline to form the final higher low.
-Begin expansion to the next major liquidity magnets:
-Short-term targets: 3,600 → 3,800
-Mid-term continuation: 4,200 → 4,500
-Macro target: 4,800–5,000 resistance zone
This is fully aligned with the green arrow projection you drew.
4. Market Psychology
-Big players are actively accumulating within this wide range clear repeated liquidity sweeps prove institutional activity.
-Retail traders are losing positions during sudden spikes and false breakdowns, which is typical behavior during accumulation phases.
-The market is more likely preparing for a major trend reversal, not a continuation downward.
-The price behavior mirrors earlier patterns:
Accumulation → Trendline Break → HL Retest → Massive Expansion
-This repetition increases confidence in the bullish outlook.
5. Intraday Strategy Guidance (1D)
Given the macro accumulation:
-Avoid selling aggressively the probability is against sustained bearish continuation.
-Best opportunities come from buying dips inside the accumulation zone.
-Watch for liquidity sweeps below local lows to identify smart-money entries.
High-probability setups:
✔️ Strategy 1: Buy the Bottom of the Range
Entry zones: 2,750–3,150
Targets: 3,600 → 3,800
✔️ Strategy 2: Buy the Retest After Trendline Breakout
This is the cleanest and safest setup.
Targets: 4,200 → 4,500 → 4,800+
ETH is currently in the prime zone where large investors position themselves before a new bullish cycle.
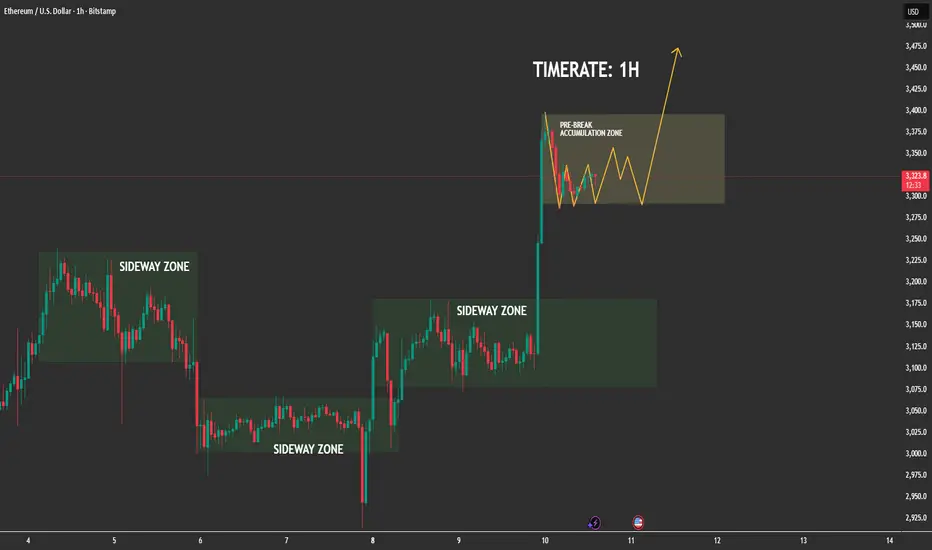
Ethereum Has Entered Its Pre-Expansion Accumulation📊 (1) MARKET STRUCTURE — CLEAN SIDEWAY → BREAKOUT → RE-ACCUMULATION
The chart shows a repeating pattern:
✔ Phase 1: Sideway Zone
ETH repeatedly compresses in sideways zones, forming liquidity pools and equal highs/lows.
✔ Phase 2: Breakout With Strong Momentum
Each sideways block ends with a powerful impulsive candle clear evidence of aggressive buy-side imbalance.
✔ Phase 3: Post-Break Re-Accumulation (CURRENT PHASE)
Price is now inside the highlighted pre-break accumulation zone,
moving in a tight, controlled structure a textbook bullish continuation setup.
This is the phase where institutional traders rebalance orders before the next run.
📍 (2) PRICE BEHAVIOR — BULLS IN FULL CONTROL
-No sharp rejections after the breakout
-Dips are shallow and quickly absorbed
-Market is forming higher low micro-structures
-Momentum clearly stays in the hands of buyers
This confirms the market is not distributing, but absorbing liquidity and building a base.
🌐 (3) MACRO FACTORS SUPPORTING ETH UPSIDE
✔ ETH ETF Approval Momentum (US + Asia)
Regulatory mood continues shifting positively, with multiple jurisdictions preparing Ethereum ETF products. Institutional demand keeps increasing quietly in the background.
✔ Falling US Inflation & Dovish Fed Expectations
Recent CPI and PPI reports show cooling inflation. The market widely expects 2025–2026 rate cuts, which historically push liquidity into risk assets ETH benefits directly.
✔ Ethereum Supply Shock
-Over 27% of ETH is staked
-Net supply remains deflationary under high network activity
-Reduced exchange reserves signal accumulation
This creates a tightening supply environment that amplifies price expansion.
✔ Altcoin Rotation Phase
BTC dominance stabilizing → capital increasingly flows into ETH and large-cap alts.
Macro + on-chain + liquidity flows all align with a bullish continuation.
⏳ (4) HTF CONTEXT — BULL CYCLE CONFIRMED
Higher timeframes show:
-ETH broke out of a weekly compression range
-Structure is fully bullish
-Market currently resetting before next leg
-No bearish reversal signals anywhere in sight
This supports the thesis that the current 1H accumulation is not random, it is part of a much larger bullish leg forming.
🚀 (5) EXPECTATION — HIGH PROBABILITY SCENARIO
ETH is expected to:
-Continue oscillating inside the pre-break accumulation zone
-Form a series of small higher lows as drawn
-Absorb liquidity from both sides
-Break out toward 3,400 → 3,450+
The path of least resistance remains upward.
🎯 (6) TRADING INSIGHT (Non-Signal)
Markets only explode after liquidity is collected.
ETH is doing exactly that holding strong after a breakout and compressing before expansion.
This is the signature behaviour of a healthy bullish trend.
EUR/USD Is Compressing — A Breakout Is Getting Close📊 (1) MARKET STRUCTURE
NZD/USD is moving inside a well-defined descending channel, creating:
Lower Highs
Lower Lows
However, the most recent bearish swings are shorter and losing momentum —
a signal that the downtrend is weakening.
📉 (2) PRICE REACTION
Every touch of the channel’s lower boundary triggers a visible reaction upward.
Recent candles show:
Smaller bearish bodies
Wicks rejecting the lows
Early signs of micro higher lows
These elements indicate absorption of sell pressure.
⏳ (3) HTF CONTEXT
On the H1 structure:
Price is sitting at the oversold edge of the channel
Momentum is compressing
The market is forming a tight consolidation zone
This compression phase often precedes a bullish breakout.
📐 (4) EXPECTATION
High-probability scenario:
Price may dip slightly to retest 0.5960 – 0.5965
A new higher low forms
Breakout of the upper channel line
Price extends toward 0.6025 – 0.6040
This is a textbook reversal from the channel floor.
🎯 (5) TRADING SIGNAL
BUY SETUP
Entry: 0.5960 – 0.5965
Stop Loss: Below 0.5940
Take Profit:
TP1: 0.5990
TP2: 0.6015
TP3: 0.6038 (breakout target)
Key Advantages
Weakening bearish momentum
Clean reactions from channel support
Tight compression before breakout
High R:R opportunity with controlled risk

Gold Pullback or Reversal? Key Zone Decides the Next Move🔹 MARKET BRIEFING – XAU/USD (1H)
Market State:
– Price is pulling back after the recent bullish impulse and is hovering just above the minor support zone, suggesting a potential retracement setup before continuation.
Key Levels:
– Support / Entry Zone: 4204 – 4205
– Stop-Loss Zone: 4193 – 4194
– Take Profit 1: 4229
– Take Profit 2: 4247
Next Move:
– A clean retest of the 4204–4205 support zone may trigger another bullish leg toward 4229 → 4247, as long as price holds above the 4193–4194 rejection area.

ETH Is Quietly Loading Up for Its Next Major Rally1. Current Market Structure (1H)
ETH continues to maintain a clean short-term uptrend with:
- Higher lows forming consistently → buyers remain in control.
- Price holding above EMA 34 → intraday bullish rhythm intact.
- EMA 89 sitting lower, confirming strong medium-term momentum.
- Demand zone 2280–2300 acting as the key intraday support.
- Liquidity resting below 2230–2250, potential draw if a pullback occurs.
Price action shows compression → energy buildup → preparing for the next expansion leg.
2. Macro Alignment
Macro conditions continue to support a bullish bias:
-DXY weakening → risk assets get a tailwind.
-US Treasury yields cooling → reduces pressure on crypto.
-Market pricing in earlier Fed cuts for 2025 → liquidity shifts toward risk-on assets.
-BTC and ETH correlation stays elevated → BTC strength fuels ETH upside.
Macro flow + technical structure both point to continuation of the upward cycle.
3️⃣ Current Structure (Right Range)
You marked SUPPORT ZONE & RESISTANCE ZONE.
ETH is repeating the same playbook:
- Long wick rejection into Support
- Price oscillates inside the range (liquidity creation)
- A breakout is likely to follow once enough orders are collected.
This is the third accumulation cycle — textbook bullish continuation.
🎯 TRADING SIGNAL
BUY SETUP
Entry Zone:
3310 – 3350 (Support Zone dips / liquidity sweeps)
Stop Loss:
Below support box: 3250
Take Profit:
Partial at 3450–3500
Full target at 3600+ (expected breakout continuation)
Why this works:
ETH has shown the exact pattern twice:
Range → Liquidity Sweep → Expansion.
Current price is building the third range — probability favors another upward expansion.
📈 SUMMARY:
ETH is not random it is systematically accumulating before each major pump.
As long as price holds the Support Zone and continues ranging, the bullish continuation scenario remains the highest-probability play.
Next Move:
– Bullish bias remains intact as long as ETH continues to hold above the channel’s support; reclaiming 3,440 would open momentum toward 3,520 and potentially the upper boundary. – ETH/USD (1H)

Ethereum Holds Its Bullish Channel as Markets Stabilize🔹 MARKET BRIEFINGMarket State:
– Price is pulling back from the channel’s upper resistance and is now stabilizing around mid-range, while still respecting the ascending channel structure.
Key Levels:
– Support: 3,160
– Resistance: 3,440
– Breakout Zone: 3,440 – 3,520
Next Move:
– Bullish bias remains intact as long as ETH continues to hold above the channel’s support; reclaiming 3,440 would open momentum toward 3,520 and potentially the upper boundary. – ETH/USD (4H)

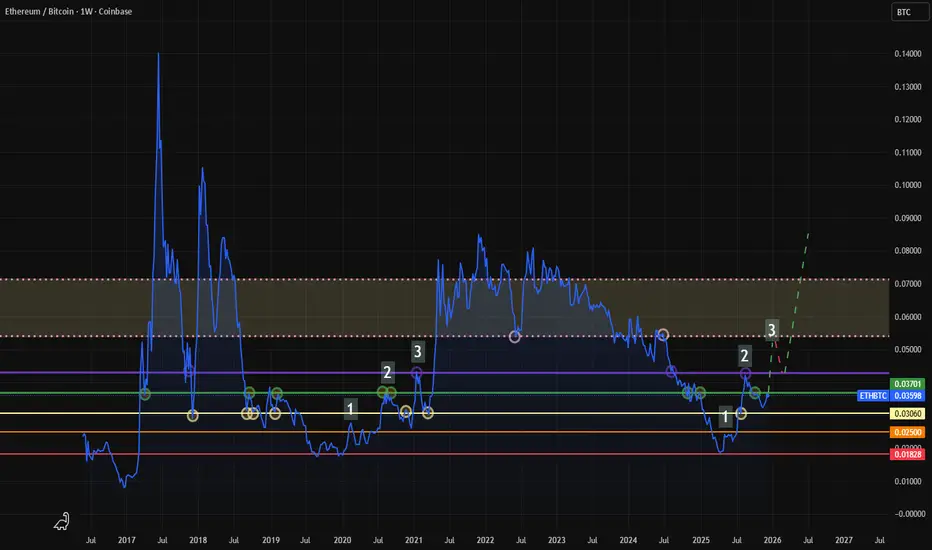
ETHBTC - HTF 3 Wave Buildup + Key Support & ResistanceMost important chart in crypto right now.
Be positioned before 0.043
Buy any dips after the Santa Rally down to current resistance 0.037
Distribute/TP within the shaded box area
ETH Capital Sector. Price Slice 15.11.2025 1590.05 K🏷 ETH Capital Sector. Price Slice 15.11.2025
3035,40 — At the time of publication, the price had not yet been reached. ( на момент публикации цена не достигнута )
2872,52 — At the time of publication, the price had not yet been reached. ( на момент публикации цена не достигнута )
2772,62 — At the time of publication, the price had not yet been reached. ( на момент публикации цена не достигнута )
2575,43 — At the time of publication, the price had not yet been reached. ( на момент публикации цена не достигнута )
2332,65 — At the time of publication, the price had not yet been reached. ( на момент публикации цена не достигнута )
1927,44 — At the time of publication, the price had not yet been reached. ( на момент публикации цена не достигнута )
1590.05 — At the time of publication, the price had not yet been reached. ( на момент публикации цена не достигнута )
🏷 At the request of close colleagues, friends, and supporters of my work, I am publishing this analytical material in English—for the international institutional community and conscious retail market participants.
🏷 This slice reflects the logic of institutional capital movement. It is critical to understand: price is formed only when sufficient liquidity from the retail sector and sustained crowd interest are present. Without this condition, institutional interest remains potential, but unrealized.
🏷 Meanwhile, institutional capital operates on entirely different temporal and structural charts than those visible on the screens of most traders.
🏷 Therefore, a superficial view of price is doomed to distortion.
🏷 Methodology: Pre-Factum
🏷 My analytical markings are built on the principle of Pre-Factum—anticipating the fact before it manifests. This is not forecasting in the traditional sense, but identifying capital intent prior to its physical manifestation on the chart.
🏷 The central element of this method is identifying a price sector as an intention—where the instrument is striving to go—regardless of its current price action: no emotions, only cold calculation. Every price has its own timeframe.
🏷 There are three ways to interact with unfulfilled price levels:
🏷 1. Trade from the level—enter upon confirmed structural validation.
🏷 2. Wait for fulfillment—observe price movement toward the level without entering, focusing on instrument behavior.
🏷 3. Trade in the direction of the level—utilizing support/resistance levels with strict risk control.
🏷 If you choose the third path, deep understanding of market mechanics becomes mandatory. Without experience, conscious perception of liquidity behavior, and prior study of relevant materials, entering such positions is premature.
🏷 This applies equally to retail newcomers and professionals whose attention remains scattered by short-term timeframe noise.
🏷 Relevance of Markings
🏷 The levels presented here are current, fresh institutional capital markings. They do not invalidate previously identified unfulfilled prices but complement them within the context of evolving liquidity and shifting market logic.
🏷 A flag placed prior to price touch—with the publication date (level, sector—whichever you prefer)—indicates that the instrument, with high probability and regardless of current price movement, intends to execute a move toward that price.
🏷 Two examples:
🏷 Example #1 — BTC:
On the screenshot from September 26, 2025, I marked the price of 106,110 with a blue flag (color is my personal labeling). Screenshot:
The instrument subsequently deviated from this level by 15%, creating pressure: on October 10, 2025, price declined sharply, collecting all long positions.
Instrument slide:
🏷 Example #2 — ETH:
On October 12, I marked the price of 3,291.60 with a yellow flag:
On November 4, the instrument reached the marked price:
🏷 I have directed your attention to specific prices—and there are many such examples in my feed. If you study my materials, you will see: this is a new methodology, currently not demonstrated by anyone else in the world. The precise slice and price sector I have developed reveal the true mechanics of the market.
🏷 Once price reaches a flagged zone, the marking loses its original function. It must be updated to reflect the new logic of capital movement—otherwise, it becomes a misleading reference or a conventional technical analysis level.
🏷 These markings are not static. They are dynamic markers of intent, requiring constant reassessment. It is precisely these that we uncover through the method of capital anticipation.
🏷 Temporal Context
🏷 I emphasize separately: the flag carries not only a price function, but also a temporal one. The publication date is the fixed point of my observation and identification. It serves as my anchor: where and when I captured institutional intent.
🏷 My entire architecture of price sectors is systematically organized into chronological folders. I have already demonstrated this structure in one of my videos—for those who seek to think structurally, not reactively. Use translators as needed to study my demonstration.
🏷 This is not a forecast. It is a map of intent.
🏷 Read it with respect for liquidity, time, and capital intelligence.
🏷 English is not my native language. With international exposure, time will come—I will provide new reference points as needed, without compromising institutional interests or the balance of many market participants. I do not disclose the entire price sector or the skill of seeing any instrument within its price sector for security reasons. You must determine for yourself how to engage with institutional analysis.
🏷 There are traders, and there are analysts—two distinct classes. The mindset between institutional analysis and trading is fundamentally different.
🏷 As you see, I do not use indicators. This is mathematics, logic, and an intellectual system I created—my proprietary property. I have come only to help you see a different structure.
🏷 The battle of titans is a clash of attention and timing.
🏷 The question is not who is right—but who has the resources and patience to unload positions.
🏷 Who leads whom? The one who sees further and holds institutional leverage.
🏷 You have received a map. Most see an image; few read the message. The difference is not IQ, but the habit of looking toward the future—not at indicator noise.
🏷 Institutional capital meticulously crafts candles, as if scripting the narrative to suit its preferred triggers. I, operating from the shadows, read the plan: where entry points will be set, where liquidations will be scheduled, who will hold positions until the bell.
🏷 I offer possibilities, not commands. But let us acknowledge: a hint is an art—and it transforms curiosity into dependency. Do you remember the echo of these words?
🏷 I have shown you another side of analysis—I have designed what you have been waiting for, and what you have grown weary of. This is new technical analysis: to understand how to control the capital sector—study the materials. The secrets are mine. I give you part of this understanding to help you.
🏷 Not tricks, not guesses—but architecture.
🏷 Let it sound mystical—it must. A map in the hands of one who can read between the candles always appears as prophecy to those accustomed to indicator noise.
— The Architect
