Ethereum Roadmap: Will ETH Bounce or Begin a Deeper Correction!?Today, I’d like to dive into an analysis of Ethereum ( BINANCE:ETHUSDT ). Given that over 80% of tokens in the crypto market are built on the Ethereum blockchain, Ethereum’s performance can serve as a roadmap for other tokens on the network.
So, stay tuned!
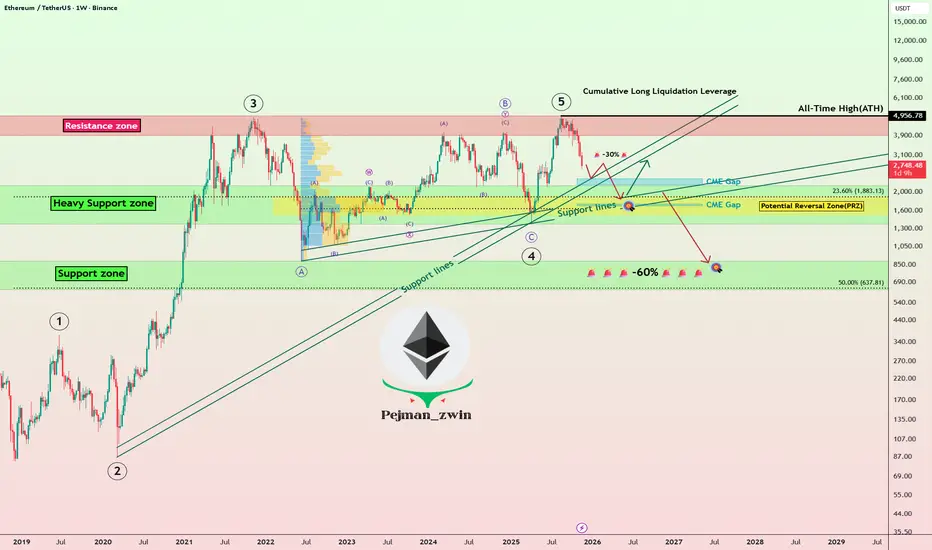
In recent times, Ethereum hasn’t been able to keep pace with Bitcoin’s growth and struggled to set a new All-Time High(ATH=$4,956). After Bitcoin’s decline, Ethereum also started to drop and is currently moving near the Heavy Support zone($2,160-$1,370), Support lines, Cumulative Long Liquidation Leverage($1,745-$1,629), and Potential Reversal Zone(PRZ) .
From an Elliott Wave perspective, it seems that Ethereum has completed its main five-wave impulsive. This suggests that we might now be entering a corrective phase. The extent of this correction will depend on multiple factors, and technical analysis alone won’t predict the exact magnitude of Ethereum’s decline in the coming days or weeks. Nonetheless, I’ll keep you updated step-by-step.
Looking at the USDT.D%( CRYPTOCAP:USDT.D ), it’s currently on an upward trend. This rising dominance can lead to further declines in Ethereum, reinforcing the bearish outlook.
Another important index is the US 10-Year Government Bond Yield ( TVC:US10 ). If the US 10-Year Government Bond Yield continues its upward movement, it can put additional pressure on risk assets like Bitcoin( BINANCE:BTCUSDT ) and Ethereum, leading to further declines.
Now, the question is: where might we see Ethereum resume its upward trajectory?
It’s likely that Ethereum will continue its downward movement(-30%), potentially filling the CME Gap($2,344-$2,186), CME Gap($1,745-$1,629) near the $2,000(Round Number). Once it stabilizes around that zone, we could look for signs of a recovery.
However, if Ethereum breaks below its Heavy Support zone($2,160-$1,370), we might face even more significant declines, potentially exceeding -60%.
Where do you think Ethereum will start to rise again? Or are more red days ahead?
💡 Please respect each other's opinions and express agreement or disagreement politely.
📌Ethereum Analyze (ETHUSDT), Weekly time frame.
🛑 Always set a Stop Loss(SL) for every position you open.
✅ This is just my idea; I’d love to see your thoughts too!
🔥 If you find it helpful, please BOOST this post and share it with your friends.
ETH-D
Ethereum hits bottom at $1,750 —Time to go LONGEther just hit bottom as a higher low compared to April 2025.
When the lowest point came up in April, it was coupled with the highest bearish volume candle in years. When the lowest point came up in February 2026, it is coupled with the highest bearish volume since April 2025. $1385 vs $1750.
On this chart you can also see a classic ABC correction. The final leg, the C wave, is extremely steep. Such a strong move cannot last that long. It lasted a long while but it looks like it already ran its course.
This bearish move is ending as a higher low.
This might not be the end of the bear market of course, we have some reckoning to do later in 2026. But now, the entire Cryptocurrency market is about to turn big green.
Since you were with me through all the ups and down, I just wanted to be the first to let you know.
Thanks a lot for your continued support.
Namaste.

ETH - V Reversal - Livermore Accumulation Cylinder to ATHLivermore accumulation cylinders are my bread and butter. ETH just posted it's final low into a 5+ year liquidation zone within a livermore accumulation cylinder
All of the on-chain liquidations are decimated, there are no more forced sellers.
Up only from 1739.

ETH plan hitJust like bitcoin my ETH plan hit quickly. For now forming a bottom here is important. Otherwise we will see new lows.

$BTC Short UpdateShort I predicted played out well hitting all targets to the T.
this last target we are currently at if we lose this opens up a huge sell off!

ETH Ethereum Bear Market If you haven`t bought the recent Double Bottom on Ethereum:
Now you need to know that historically, Ethereum has shown a tendency to retrace in December before starting a recovery around March. This pattern could repeat this season, with ETH facing selling pressure as year-end portfolio rebalancing and macro uncertainties weigh on the market.
While a brief Santa Claus rally might provide temporary relief, the bearish trend is expected to dominate until March. By then, ETH could trade below $3,000 before regaining momentum, aligning with its historical recovery trend as market conditions stabilize in spring.

ETH — Price Slice. Capital Sector. 1607.90 BPC 12© Bolzen | The Architect | BPC Framework
Bolzen Market Institute
🏷 ETH — Price Slice. Capital Sector.
TradingView Publication Date: 06.02.2026
🏷 1607.90 — price not yet reached at time of publication.
🏷 BPC — The Bolzen Price Covenant — Strength Index: 12
Quantum structure of obligations and capital flow in price formation via energy blocks.
🏷 Vertical chart — Energy Grid Dashboard.
🏷 Static Stream 1: price published in energy-block production sequence.
🏷 The price energy block is already ordered—not by time, but by execution priority. Crucially: block priority dynamically reconfigures in response to hidden energetic impulses, whereas price execution order records their market manifestation. Every price in the dynamic stream is tied to proprietary energy-production metrics inaccessible to the general public. Those who perceive structure before its manifestation do not follow price—they anticipate it.
EΞ2Φ8Ψ45Θ·ζ⁻¹·106Λ732·Ω²
📎 Screenshot:
🏷 When trading from levels, use liquidity zones from BPC 10 and above.
🏷 Bolzen Liquidity Map — ETH (numerical equivalent):
🏷 I. Interactive Reference Guide: BPC — The Bolzen Price Covenant
🏷 P.S. English is not my native language — I offer no apologies for stylistic imperfections. What you see here is not a post. It is a demonstration of another level of preparation: the symbiosis of human intuition and algorithmic precision. Mathematics and aggressive market analysis — against the machine of liquidations.
The persistent ETH and BTC Energy Grid Dashboard remains publicly accessible and is intended for international institutional review.
Dear international community,
I extend my gratitude to the TradingView moderation team for their impartiality and support of analytical work at the global level, as well as to all who follow my research. This platform serves as a space to demonstrate contributions to the advancement of market analytics.
Attention and time are your most valuable resources. ATH is emotion; timeframes are your truest allies. Thank you.
— The Architect
BPC — The Bolzen Price Covenant

ETH — Price Slice. Capital Sector. 1737.02 BPC 28© Bolzen | The Architect | BPC Framework
Bolzen Market Institute
🏷 ETH — Price Slice. Capital Sector.
TradingView Publication Date: 06.02.2026
🏷 1737.02 — price not yet reached at time of publication.
🏷 BPC — The Bolzen Price Covenant — Strength Index: 28
Quantum structure of obligations and capital flow in price formation via energy blocks.
🏷 Vertical chart — Energy Grid Dashboard.
🏷 Static Stream 1: price published in energy-block production sequence.
🏷 The price energy block is already ordered—not by time, but by execution priority. Crucially: block priority dynamically reconfigures in response to hidden energetic impulses, whereas price execution order records their market manifestation. Every price in the dynamic stream is tied to proprietary energy-production metrics inaccessible to the general public. Those who perceive structure before its manifestation do not follow price—they anticipate it.
EΞ2Φ8Ψ45Θ·ζ⁻¹·106Λ732·Ω²
📎 Screenshot:
🏷 When trading from levels, use liquidity zones from BPC 10 and above.
🏷 Bolzen Liquidity Map — ETH (numerical equivalent):
🏷 I. Interactive Reference Guide: BPC — The Bolzen Price Covenant
🏷 P.S. English is not my native language — I offer no apologies for stylistic imperfections. What you see here is not a post. It is a demonstration of another level of preparation: the symbiosis of human intuition and algorithmic precision. Mathematics and aggressive market analysis — against the machine of liquidations.
The persistent ETH and BTC Energy Grid Dashboard remains publicly accessible and is intended for international institutional review.
Dear international community,
I extend my gratitude to the TradingView moderation team for their impartiality and support of analytical work at the global level, as well as to all who follow my research. This platform serves as a space to demonstrate contributions to the advancement of market analytics.
Attention and time are your most valuable resources. ATH is emotion; timeframes are your truest allies. Thank you.
— The Architect
BPC — The Bolzen Price Covenant

ETH — Price Slice. Capital Sector. 1872.78 BPC 22© Bolzen | The Architect | BPC Framework
Bolzen Market Institute
🏷 ETH — Price Slice. Capital Sector.
TradingView Publication Date: 01.01.2026
🏷 1872.78 — price not yet reached at time of publication.
🏷 BPC — The Bolzen Price Covenant — Strength Index: 22
Quantum structure of obligations and capital flow in price formation via energy blocks.
🏷 Vertical chart — Energy Grid Dashboard.
🏷 Static Stream 1: price published in energy-block production sequence.
🏷 The price energy block is already ordered—not by time, but by execution priority. Crucially: block priority dynamically reconfigures in response to hidden energetic impulses, whereas price execution order records their market manifestation. Every price in the dynamic stream is tied to proprietary energy-production metrics inaccessible to the general public. Those who perceive structure before its manifestation do not follow price—they anticipate it.
EΞ2Φ8Ψ45Θ·ζ⁻¹·106Λ732·Ω²
📎 Screenshot:
🏷 When trading from levels, use liquidity zones from BPC 10 and above.
🏷 Bolzen Liquidity Map — ETH (numerical equivalent):
🏷 I. Interactive Reference Guide: BPC — The Bolzen Price Covenant
🏷 P.S. English is not my native language — I offer no apologies for stylistic imperfections. What you see here is not a post. It is a demonstration of another level of preparation: the symbiosis of human intuition and algorithmic precision. Mathematics and aggressive market analysis — against the machine of liquidations.
Imagine price on a chart moving in a “zigzag”—up, then down, in an apparently chaotic sequence.
To this dynamic we introduce Magnitude 1.0 —a mathematical construct whose purpose is to trace a single, smooth, continuous line that best captures the overall direction of what initially appears to be disorderly motion.
This is analogous to the tire mark left on wet asphalt after a sharp maneuver: the track is jagged, yet you can still discern an “average” line indicating the vehicle’s general trajectory.
Magnitude 1.0 filters noise —minor fluctuations, emotional impulses, short-term liquidity spikes. It reveals not randomness, but structure .
Unlike linear models, Magnitude 1.0 permits this “average line” to be nonlinear , which is critical in markets where trends are rarely straight—especially in crypto assets.
Now we introduce Magnitude 1.1 —the logical forward extension of Magnitude 1.0.
If Magnitude 1.0 is a smooth curve fitted through historical data, then Magnitude 1.1 is its extrapolation beyond the observable time horizon .
This is not a forecast, but a hypothesis :
“If the market continues behaving as it has over the past N periods, price will most likely reside somewhere here.”
Magnitude 1.0 is a tool of anticipation, not action. It answers the question:
“What level could reasonably serve as a target, assuming the current market geometry holds?”
Yet the market is a living system. A new announcement, a liquidity shift, a macro impulse—any of these can instantly invalidate the hypothesis. Thus, the value of Magnitude 1.1 emerges only in context :
- current volume,
- position relative to key structural levels,
- the state of the external information environment.
Consider a river.
Magnitude 1.0 defines its general channel, despite waves, eddies, and local turbulence.
Magnitude 1.1 speculates where the river might flow next— if the terrain remains unchanged .
But if rain begins or a dam appears, the hypothesis collapses.
You do not build your house based on Magnitude 1.1. You merely prepare for one of several plausible scenarios.
Why does this matter?
Within the framework of Capital Geometry , where price is not merely a number but a projection of hidden structure:
- Magnitude 1.0 extracts implicit architecture from the chaos of price data,
- Magnitude 1.1 tests the temporal resilience of that structure— without conflating the model with reality .
This aligns with a foundational principle:
Analysis is not prediction—it is preparation for a sequence of events.
To whom is this addressed?
— Not to retail traders leveraging 100x.
— Not to those who “draw” arbitrarily on charts, then complain that price “goes the wrong way,” oblivious to timeframe hierarchy.
— Not to those who operate without defining price ranges or structural context.
This material is intended for institutional players, quantitative analysts, and those capable of decoding the embedded information .
It is a gesture of respect to those who think in terms of capital geometry , not short-term speculation.
The retail sector operates via mechanics : trading from levels within near-term ranges, only after confirmation and closure on timeframes of 1D and higher.
But if your analysis relies solely on indicators supplied by vested corporate entities for the purpose of disinformation—it is no surprise you fear the future.
Some are deceived by randomness, others lack patience, and a third group has merely been favored by capital—to make the crowd believe in illusion.
Volume. Time. Price.
These categories belong to a fading era.
Each is governed by deeper mathematical magnitudes.
Some participants provide liquidity, others are professional traders, and others still are analysts.
And then there are those who remain in the shadows—yet whose work forms the bedrock of market order.
I extend to you a sign of respect.
Because between the lines, you understand .
I assist those who think .
And I conceal pathways—not out of fear, but out of respect for the capital that engineered this system.
It is logical. Designed. And projected years ahead.
Thank you.
— The Architect
BPC — The Bolzen Price Covenant

The "US Bitcoin Reserve" is a Lie. (A Macro Deep Dive)While Retail is chasing headlines about a "Strategic Bitcoin Reserve," Smart Money is aggressively de-risking. Why? Because the "News" is a linguistic misunderstanding, and the "Macro" just turned violently bearish.
If you are buying this dip because you think the US Government is about to print trillions to buy Bitcoin, you are walking into a trap. Today, we are going to deconstruct the three pillars of this bearish thesis: The "Project Vault" Deception, The Kevin Warsh Pivot, and the Technical Reality of DXY and ETHUSD .
__________________________________________________________________________________
1. The "Project Vault" Deception (Fact Check) 🕵️♂️
The entire bullish narrative right now hangs on the rumor that the administration's "$12 Billion Project Vault" is a secret plan to accumulate Bitcoin.
This is false.
I dug into the executive details. "Project Vault" is indeed a strategic reserve, but not for Crypto. It is a stockpile for Critical Minerals ,specifically Gallium, Cobalt, and Lithium—to secure the US defense supply chain against China.
• Retail hears: "Vault" = Cold Storage for BTC.
• Reality: "Vault" = Warehouses for EV Batteries and Fighter Jet components.
• The Takeaway: The market is pricing in a massive liquidity injection for Crypto that simply does not exist. When this realization hits the masses, the repricing will be severe.
__________________________________________________________________________________
2. The Macro Villain: Kevin Warsh 🦅
While everyone watches the "Reserve" headlines, they are ignoring the single most important variable: The Federal Reserve.
The new nominee for Fed Chair, Kevin Warsh , is the ultimate Hawk.
• History: He resigned from the Fed in 2011 specifically because he opposed Quantitative Easing (QE).
• Philosophy: He believes in a "Smaller Fed," "Positive Real Rates," and a "Strong Dollar."
• The Impact: Warsh is the anti-thesis to the "Money Printer Go Brrr" narrative. His nomination is a signal that the era of easy liquidity is ending. This is a Liquidity Withdrawal Event , and risk assets like BTCUSD are the first to suffer.
__________________________________________________________________________________
3. The Technical Truth: DXY & ETH 📉
The charts are confirming the Macro view perfectly. The "Smart Money" is already positioning for a liquidity crunch.
A) The DXY (US Dollar Index) Squeeze
The Dollar is waking up.
• Price Action: DXY is compressing tight at 26.9950 , sitting exactly at the confluence of the EMA50 and EMA200 . This is a massive decision point.
• Momentum: Stochastic is overbought (95.3), BUT ADX is at 52.2 . This tells us the trend strength is real.
• The Trigger: A 4H close above 27.09 (Upper Bollinger Band) triggers a breakout. If the Dollar flies, Crypto dies. It’s that simple.
B) Ethereum (The Canary in the Coal Mine)
If the "US Reserve" story were real, insiders would be front-running it on ETHUSD . Instead, ETH is lifeless.
• Structure: We have confirmed a CHoCH Bearish . Price is trading below every major Moving Average (20, 50, 200).
• The Trap: RSI is oversold (25.1), but ADX is 53.0 . Do not mistake "Oversold" for "Reversal." High ADX + Low RSI = A strong, relentless downtrend.
• Volume: We are trading at 39% below average volume . There is ZERO institutional support at these levels. The "Smart Money" has left the building.
__________________________________________________________________________________
4. The Operational Risk (The "John Lick" Scandal) 🚨
Finally, for those who believe the US Government is competent enough to manage a trillion-dollar Bitcoin reserve, look at the news from last week. A government contractor’s son was caught draining US-seized wallets on Telegram to flex wealth.
The Reality: The US Government cannot even secure the Bitcoin it already has. The idea that they are about to execute a sophisticated sovereign accumulation strategy is a fantasy.
__________________________________________________________________________________
🎯 The Verdict & Strategy
The "Strategic Reserve" narrative marked the top. The "Kevin Warsh" reality will drive the trend.
• The Trade: I am fading this narrative entirely.
• Invalidation: A DXY breakdown below 26.41 or an ETH reclaim of 3,403 (Bearish Order Block).
• Target: As long as DXY holds above the EMA200, I am targeting a flush on BTCUSD to 70k and ETH to 2,224 .
Do not trade the Headlines. Trade the Liquidity.
Do you trust the "US Reserve" hype?
A) Yes, HODL for nation-state adoption 🇺🇸
B) No, the chart is broken 📉
Vote A or B below! 👇

$ETH / Ethereum - Don't Try and Catch KnivesUpdated ETH chart and thoughts:
I will wait until our weekly close to remove the demand/support weekly area near $2800 for further invalidation. I will then add a new supply/resistance area near $3000.
Areas of interest for a bounce/reversal are in green.
Not calling anything until I see slowed selling pressure. Don’t try and catch knives out here hoping for v shape reversal. A foundational bottom takes time to form.
There will be opportunities to buy and add more.

Are we due for a relief bounce on Bitcoin soon?After the ~22% drop I mentioned earlier, could Bitcoin see a relief bounce this weekend toward the 78,000 range? Indicators are already showing bullish divergence.
The question is whether this would be a dead-cat bounce before another leg down or a potential double bottom. A clean break above 78,000 could also open the door for further upside.

Ethereum Update 05FEB2026: Last Minor Leg Down UnfoldsEthereum price follows the map posted last November
The expected minor consolidation within second red leg down is over
as the last minor leg down unfolds quickly right after that
The bottom of the first large red leg down is the imminent target at $882
Full retracement is the next target

Coinranger|ETHUSDT. Moving to H16 aim level🔥News
🔹JOLTS employment report at 18:00 UTC+3
🔥ETH
🔹Monday's forecast is still actual:
1️⃣ There are dynamic 2150 and 2240 levels above.
2️⃣ 1970 below is still actual. Level of h16.
Expecting a breakout of the level below.
---------------
Share your thoughts in the comments!

Bearish continuation?Ethereum (ETH/USD) has rejected off the pivot, which is a pullback resistance, and could drop to the 1st support.
Pivot: 2,185.81
1st Support: 1,952.49
1st Resistance: 2,347.75
Disclaimer:
The opinions given above constitute general market commentary and do not constitute the opinion or advice of IC Markets or any form of personal or investment advice.
Any opinions, news, research, analyses, prices, other information, or links to third-party sites contained on this website are provided on an "as-is" basis, are intended to be informative only, and are not advice, a recommendation, research, a record of our trading prices, an offer of, or solicitation for, a transaction in any financial instrument and thus should not be treated as such. The information provided does not involve any specific investment objectives, financial situation, or needs of any specific person who may receive it. Please be aware that past performance is not a reliable indicator of future performance and/or results. Past performance or forward-looking scenarios based upon the reasonable beliefs of the third-party provider are not a guarantee of future performance. Actual results may differ materially from those anticipated in forward-looking or past performance statements. IC Markets makes no representation or warranty and assumes no liability as to the accuracy or completeness of the information provided, nor any loss arising from any investment based on a recommendation, forecast, or any information supplied by any third party

Full top down on BTC & ETH, Geronimo for nowIt seems we are being given a once in a lifetime opportunity to start from the bottom and get another chance to strike huge on the next ATH run!

Time to buy altcoins? Ether ready to crash toward $800 - $1200 Let's consider a different scenario real quick, something doesn't add up.
Ethereum is now trading above the most important support ever based on price action. This is marked with a purple line on the chart—the 0.786 Fib. retracement level. A price tag of $2,150. This support has been valid since 2023, it has been working nicely from Ethereum long-term. What if it breaks?
Something doesn't add up. I see many projects have been growing now for days, weeks and some even months. Some projects have been rising slowly for 1.5 months or more. Ethereum keeps on going down.
Think of this: All the major projects, including Bitcoin, challenged their April 2025 low support. Ethereum, not yet. All the projects challenged this support level and some went even lower.
The entire market went through a crash, a flush, all-time lows, etc., yet Ethereum is safely trading at a very strong higher low compared to April 2025. What happens if this level breaks?
We can't say that Ethereum is still trading above this level because it is super strong, it isn't. On the last bullish cycle, it managed only to produce a shy all-time high, nothing extraordinary.
What if instead of strong Ethereum is just late?
Prepare for a massive crash
A massive crash that will challenge and break April 2025, giving us a price of around $1,100 or even $800. Yes, the first target would be $1,400 on a flash crash once the current support breaks but then lower for sure.
Ethereum crashes all the way down and as soon as ~$1,000 is hit a recovery happens. This would be the end of Ethereum's bear market.
How is it possible for Ether to end its bear market months and months before Bitcoin?
In 2022 ETHUSDT hit bottom in June, Bitcoin did so in November. That's a five months difference. Things like this can happen easily.
Bitcoin is trading already way lower than Ethereum yet Bitcoin is many times stronger.
A sudden crash as I am theorizing here would mean something like a Black Swan event. It can happen. Hundreds of projects already went through a crash, hit new all-time lows and are now even growing for months. What happened with Ethereum, will it not crash? Or, is it just late?
I think it is late. We saw how the bigger projects crashed after the smaller ones.
Prepare...
This is positive though, once the bottom is in, we get growth long-term.
Thank you for reading.
Namaste.

Vitalik Just Killed the "L2 Narrative."The market is missing the biggest pivot in Ethereum history.
For the last two years, the "Smart Money" trade was to Long L2s and Short L1. That trade ended this week.
On February 3, Ethereum co-founder Vitalik Buterin published a seminal critique declaring that the "Rollup-Centric Roadmap" (L2s acting as branded shards) "no longer makes sense".
Why? Because Ethereum L1 is scaling faster than anyone expected, and "Generic L2s" are failing to decentralize. Today, we are going to analyze the Fundamentals (The Research) and the Technicals (The Charts) to prove why the rotation back to Mainnet has already begun.
__________________________________________________________________________________
1. THE FUNDAMENTAL SHIFT (L1 is the Captain Now) 🚢
The narrative that "L1 is unscalable" was shattered by the recent upgrades.
* The "Fusaka" Upgrade: This upgrade has already doubled the L1 Gas Limit to 60 Million . Developers are now targeting 200M gas later this year.
* The Reality: With L1 capable of handling 20-30 TPS at sub-2 gwei fees, the average user does not need to bridge to a centralized L2 anymore.
* The "Stage 2" Ultimatum: Vitalik explicitly stated that L2s relying on multisigs (Stage 1) are NOT scaling Ethereum.
The "Parasitic" Economics ⚠️
Why is this bearish for L2 tokens? Look at the revenue split.
* Base Revenue (2025): >$75 Million.
* Rent Paid to ETH: ~$1.52 Million.
* The Squeeze: Base is operating at a 98% profit margin . But with the new EIP-7918 , L2s will be forced to pay a "Price Floor" for blobs, crushing their margins and forcing revenue back to L1.
__________________________________________________________________________________
2. THE TECHNICAL PROOF (The Charts Don't Lie) 📉
The "Smart Money" is actively dumping L2 governance tokens to buy Spot ETHUSD .
A) ARBETH (The "Dilution" Chart)
This chart confirms the "L2 Death" thesis.
* Trend Strength: The ADX is at 63.6 (Weekly). This is not a dip; it is a violent, trending crash.
* Structure: Price is trading below every major EMA (20, 50, 200). We have broken all support.
* Target: The bearish structure points to a flush to the swing low at 0.000029 ETH (-51% from here).
B) OPETH (No Buyers)
* Price Action: We just printed a "Hammer" candle, but with Low Volume ($119k) . Without institutional volume, this is just a pause before the next leg down.
* Risk: If support breaks, there is no structural demand until 0.000063 ETH .
__________________________________________________________________________________
3. THE "COMEBACK KING" PLAY ( ETHUSD ) 💎
While L2s bleed, Ethereum is setting up for a "Generational Opportunity."
* The Zone: We are testing critical support at $2,112 (Bottom of the Bullish Order Block).
* The Signal: Weekly RSI is resetting at 30 (Oversold border).
* The Confirmation: ADX has dropped to 20 . This is the "Smoking Gun." It means the bearish trend momentum has died. Sellers are exhausted, and the reversal structure is building.
__________________________________________________________________________________
🎯 THE VERDICT
The "Pure Rollup" narrative is fading.
* Sell: Generic L2s ( ARBETH , OPETH ) -> They are losing their moat.
* Buy: Spot ETH (at $2,112 ) -> Captures the value of returning L1 users.
* Watch: Only "Specialized" L2s (like Fuel or Aztec) are safe from the pivot because they offer features L1 cannot (Privacy/UTXO).
Are you rotating back to Mainnet?
Vote Below! 👇
A) Yes, Long ETH (L1 is King) 💎
B) No, Long L2s (Fees are lower) ⚡

Ethereum has some proving to do before I flip bullishETH remains in a clear bearish structure after losing key higher-timeframe support. Price is trading below the major moving averages, which are now acting as dynamic resistance.
The highlighted zone above is a supply / value area where previous support flipped into resistance. Any move into that region should be treated as a reaction zone, not an automatic long.
Downside structure is still intact. The recent bounce looks corrective, not impulsive. Momentum is attempting to stabilize, but there is no confirmed structure shift yet.
Key takeaway
– Trend remains bearish
– Below HTF resistance
– Wait for a clear structure change before taking risk
– Best trades come after confirmation, not anticipation
Patience here matters. Wait for structure.

ETH Rebuy Zone (1D)Honestly, the key support levels have already been lost.
Considering the selling pressure, the bearish momentum, and the current candle structure, it appears that the bearish wave is likely to conclude within the green zone.
This corrective move will require time and proper base formation before any meaningful reversal to the upside can occur. A sustainable recovery is unlikely without consolidation and accumulation in this area.
The optimal approach in the green zone is to enter positions gradually using a DCA (Dollar-Cost Averaging) strategy, while avoiding any form of impatience or emotional decision-making. Rushing entries in such conditions significantly increases risk.
Above all, capital management and risk control remain the most critical factors in navigating this market phase.
If you have a coin or altcoin you want analyzed, first hit the like button and then comment its name so I can review it for you.
This is not a trade setup, as it has no precise stop-loss, stop, or target. I do not publish my trade setups here.

ETHUSDT Moves on weekly supportThe current situation for Ethereum remains tense and largely determines the mid-term direction of movement. The price has approached the 2.300-2.491 level, which formally appears to have been broken. However, until the market breaks out of its current accumulation and consolidates below, this range still maintains support status. This very moment marks the situation as borderline, as the structure has already weakened, but a final break has not yet occurred.
A noticeable feature of the current phase is extremely high volume activity from wheels. Both large bulls and bears regularly enter the market, indicating a fierce struggle for price control. This is not a passive sideways movement, but an active redistribution of positions, where neither side has yet gained a sustainable advantage. Such conditions often precede a strong momentum, but the direction of this momentum will directly depend on who is the first to break through key levels and consolidate.
If the price breaks out of the current accumulation and confirms consolidation below the 2,300-2,491 zone, the market will likely begin searching for deeper levels. The closest significant support in this scenario is the daily level of 1,647-1,655, where significant buying interest has historically been evident and where a new phase of stabilization or reversal could begin.
For bulls, the key objective is to hold the current weekly range and prevent a downward trend. If they manage to seize control and begin dominating volumes, ETH will have room to recover and further move higher. In this case, the logical target for volume distribution is the daily resistance of 2,774-2,788. This zone is where the next stage of the standoff should be expected, provided bears respond and once again attempt to seize the initiative. Until then, the market will remain in an active phase of the struggle, where volumes and the nature of consolidation at key levels will be decisive.

ETH levels of interest (Y26.Video1).More lows to comeHi traders,
I'm looking for more lows for ETH and likely many ALTS. For now, here are my thoughts.
All the best,
S.SAri

ETHEREUM Channel Down got oversold but this isn't the bottom!Ethereum (ETHUSD) is extending its losses as, following the January 14 rejection on its 1D MA100 (green trend-line), it made a Lower High on its 4-month Channel Down that kick-started the new Bearish Leg.
The 1D RSI turned oversold (below 30.00) for the first time since November 21 2025 but besides a (potential) short-term dead-cat-bounce towards the 0.382 Fibonacci retracement like on November 10 2025, it should bottom lower, at least at $1900 making a -44.80% decline (at least), similar to the previous Bearish Leg, before any meaningful longer term relief rally.
Technically, the strongest pressure zone (demand at this point) is the 1385 Support of the April 09 2025 Low.
---
** Please LIKE 👍, FOLLOW ✅, SHARE 🙌 and COMMENT ✍ if you enjoy this idea! Also share your ideas and charts in the comments section below! This is best way to keep it relevant, support us, keep the content here free and allow the idea to reach as many people as possible. **
---
💸💸💸💸💸💸
👇 👇 👇 👇 👇 👇
