Ethereum Set for a Rally: Can It Break Key Resistance?Ethereum (ETH/USD) – 1-Day Chart
Current Market Structure:
Ethereum is in a clear ascending channel with higher lows and higher highs, indicating a potential bullish trend. The price is currently consolidating within this channel and preparing for a potential breakout to the upside.
Key Levels:
Support Zone: $2,633.61 - The price has consistently bounced off this zone, showing strength.
Resistance Zones: $4,716.90
Take Profit 1: $3,612.44
Take Profit 2: $4,188.23
Take Profit 3: $4,716.90
Most Probable Scenarios:
1. Bounce from Support: Ethereum is likely to continue its upward movement, testing the first take-profit target at $3,612.44.
2. Consolidation: Price may continue to consolidate within the channel before making a final move higher.
3. Breakout to the Upside: If Ethereum successfully breaks above the upper boundary of the channel, a move toward the next resistance levels (Take Profit 2 and Take Profit 3) is expected.
Actionable Advice:
Buy near the lower boundary of the channel, aiming for Take Profit 1 at $3,612.44.
Hold if price reaches the higher resistance levels ($4,188.23 and $4,716.90).
Risk Management:
Place stop-loss orders below the support zone around $2,633.61 to protect against unexpected price action.
ETH-D

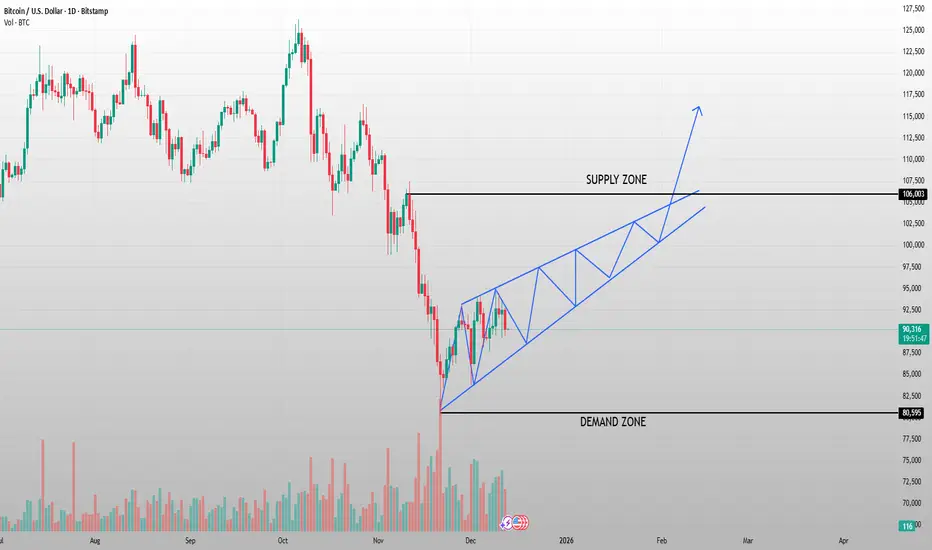
Bitcoin's Critical Test:Will Upcoming News Drive It Beyond $106KHELLO TRADERS....
Bitcoin (BTC/USD) – 1-Day Chart
Current Market Structure:
Bitcoin is currently forming an ascending triangle pattern, with higher lows establishing a clear demand zone at $80,595 and a supply zone at $106,003. This structure suggests a potential continuation to the upside if price breaks the resistance zone.
Key Levels:
Demand Zone: $80,595
Supply Zone: $106,003
Target Zone: If the resistance is broken, the next possible target is above the supply zone, indicated by the blue trendline.
Most Probable Scenarios:
1. Breakout to the Upside: Bitcoin may break above the supply zone and move towards new highs, targeting the upper trendline as shown in the chart.
2. Consolidation: Price could continue to consolidate within the ascending triangle pattern before a final breakout.
3. Rejection at Supply Zone: If Bitcoin fails to break the resistance, it might experience a pullback toward the demand zone.
Actionable Advice:
Buy if Bitcoin breaks above the supply zone with strong volume, targeting the next resistance at higher levels.
Sell if price rejects the supply zone, waiting for a retest of the demand zone for potential re-entry.
Patience: As Bitcoin is consolidating in a defined range, waiting for confirmation at key levels is crucial to avoid false breakouts.
Gold Compresses in a Range - The Breakout Will Not Be Random🔹 MARKET BRIEFING – XAU/USD (1H)
Market State:
– Price is moving sideways after a strong impulsive rally, forming a clear range structure between a well-defined support zone and a resistance zone.
– The current price action shows controlled consolidation, not distribution, indicating the market is waiting for a catalyst rather than reversing.
Key Technical Structure:
– Support Zone: ~4255–4265
– Resistance Zone: ~4345–4360
– Price is respecting both boundaries, creating higher lows into resistance — a classic compression before expansion setup.
Market Bias:
– Neutral to bullish while price holds above the support zone.
– The sideways movement reflects absorption, not selling pressure.
🌍 Macro Context – Why Gold Is Ranging
– Federal Reserve: Markets are pricing in a wait-and-see stance from the Fed. Rate expectations are stable, limiting directional momentum in USD.
– US Yields: Bond yields have stalled after the recent move, removing immediate pressure on gold.
– Risk Sentiment: Equity markets remain mixed, keeping gold supported but not aggressive.
→ This macro balance explains the range-bound behavior seen on the chart.
Next Move:
– As long as price continues to hold above the support zone, the structure favors an upside breakout.
– A clean break and acceptance above the resistance zone would likely trigger a continuation leg toward higher liquidity targets.
– Failure to hold the support zone would invalidate the bullish structure and shift focus back to deeper demand levels.
Bottom Line:
– Gold is not weak it is waiting.
– The current sideways phase is a preparation zone, and the breakout direction will align with the next macro impulse rather than random price noise.

BTCUSD: Bearish Trend Confirmed with Downside TargetsAs per the updated analysis, BTCUSD has reversed its previous bullish momentum and is now poised for a downtrend toward lower targets. The chart shows a well-defined resistance zone at 91,563, where price has started to recoil and move lower.
🔹 Market State: Bearish Reversal Confirmed
BTCUSD has now entered a consolidation phase below the resistance zone, with price rejecting the higher levels around 91,563.
The market is setting up for a downside continuation with clear price action signals. The move lower has already begun, and targets are positioned around 89,200 (Target 1), 88,000 (Target 2), and 86,386 (Target 3).
🔹 Macro Factors Driving the Decline:
1. Risk-Off Sentiment Prevails
Yesterday's decline can be attributed to the broad market risk-off sentiment. Concerns about global economic uncertainty, geopolitical tensions, and weaker-than-expected economic data are pressuring risk assets like Bitcoin.
2. Strong USD and Profit-Taking
The US dollar’s strength has been a key factor in BTC's retreat. As the dollar rises, investors typically retreat to more secure assets, causing Bitcoin and other risk assets to experience declines.
Profit-taking after Bitcoin's recent surge also contributed to the market's downward movement.
3. Fed Rate Expectations
Fed's hawkish stance (with interest rates possibly staying higher for longer) is placing further pressure on risk assets, making them less attractive to investors. This also increases the capital inflow into USD and dampens demand for Bitcoin.
4. Macro Data Weakness
Poor economic indicators such as reduced job growth or disappointing inflation figures could contribute to the broader market decline. The weak economic data creates more uncertainty, prompting liquidation of higher-risk assets.
🔹 Price Expectations and Targets:
Resistance Zone: 91,563 (Key Rejection Point)
Target 1: 89,200
Target 2: 88,000
Target 3: 86,386
As long as price remains below 91,563, the bearish continuation setup is intact, and the market is expected to decline towards Target 1, then Target 2 and Target 3.

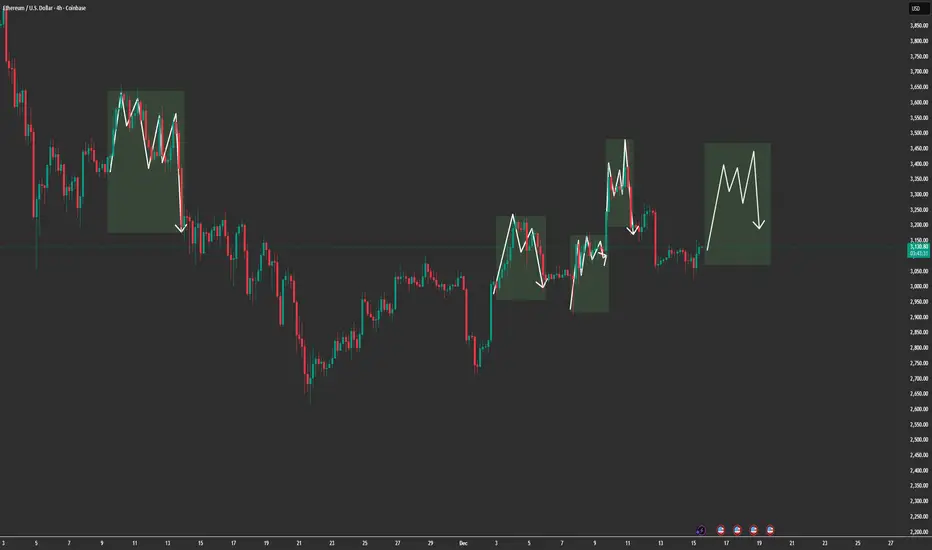
“ETH Is Repeating the Same Trap — Range First, Direction LaterMARKET BRIEFING – ETH/USD (4H)
Market State:
– Ethereum remains in a range-bound structure, repeatedly forming distribution-like consolidations after short impulsive moves.
– Each highlighted box shows the same behavior: push up → choppy consolidation → downside rotation. Current price action is aligning with that same rhythm.
Key Levels:
– Range Mid / Balance: ~3,120 – 3,150
– Upper Supply Reaction Zone: ~3,300 – 3,450
– Lower Demand / Rotation Target: ~3,000 – 3,050
– Breakout Invalidation: Clean acceptance above ~3,450
Price Action Read:
– The market is not trending it is cycling liquidity inside a broad range.
– Failed follow-through after bullish pushes signals seller absorption at higher prices.
– Current consolidation suggests another rotation phase, not immediate continuation.
Next Move:
– Sideways to slightly bearish rotation remains favored while below the upper supply zone.
– A sweep toward the lower range (~3,000–3,050) is a high-probability magnet.
– Only a strong break and acceptance above 3,450 would invalidate the range-play and shift bias bullish.
ETH is not breaking out it’s repeating structure.
Until price escapes the range with acceptance, rotation beats prediction.
Gold Is Not Correcting — It’s Loading the Next ImpulseXAUUSD M30 – Intraday Market Analysis
1. Current Market Structure
Gold remains in a healthy bullish structure after completing a sharp technical correction.
The recent pullback was corrective in nature, and price has successfully reclaimed and held above key moving averages, confirming that the primary trend is still bullish.
From a wave perspective, price is forming a (1) – (2) corrective structure, with wave (2) holding firmly above the key support area. This behavior signals trend continuation, not reversal.
2. Key Support & Structure Zones
Primary Support Zone: 4286 – 4300
→ Strong demand reaction, buyers defended this zone aggressively
Structure Low (Wave 2): Still intact
→ Failure to break this level confirms seller weakness
Upside Projection: Wave (3) → (4) → (5) remains valid as long as price holds above support
This zone acts as a launchpad for the next impulsive leg.
3. Momentum & Flow
Momentum indicators remain elevated, showing active buying pressure
Selling volume decreases on pullbacks → correction lacks strength
Price consolidating above support suggests smart money re-accumulation
This is a classic pause-before-expansion behavior.
4. Today’s Market Scenario
🔼 Primary Scenario – Bullish Continuation
If price continues to hold above 4300 – 4305, the market is highly likely to:
Complete the corrective base
Initiate wave (3) expansion
Continue toward higher intraday targets as projected on the chart
Corrections at this stage are considered buying opportunities, not trend failures.
5. Intraday Trading Plan
Intraday Bias: 📈 Bullish (Increase)
📌 SET UP 1 – Timing Sell Zone (Counter-trend scalp)
SELL ZONE: 4379 – 4382
TP: 4376 – 4371
SL: 4386
📌 SET UP 2 – Timing Buy Zone (Trend-following)
BUY ZONE: 4286 – 4289
TP: 4292 – 4297
SL: 4282
⚠️ Always apply proper capital management to protect the account.
Conclusion
Gold is not showing signs of distribution.
The market is absorbing supply after a technical correction, maintaining bullish structure, and preparing for the next impulsive expansion.
As long as price holds above the key support zone, the roadmap remains clear:
Correct → Accumulate → Expand.

ETH: Price Slice. Capital Sector. 2912.19🏷 ETH: Price Slice. Capital Sector. Dated: 11.12.2025
🏷 2912.19 — Price not yet reached at time of publication
🏷 BPC — The Bolzen Price Covenant 8
🏷 Screenshot
🏷 Interactive Reference Guide: BPC — The Bolzen Price Covenant
🏷 P.S. English is not my native language — I offer no apologies for stylistic imperfections. What you see here is not a post. It is a demonstration of another level of preparation: the symbiosis of human intuition and algorithmic precision. Mathematics and aggressive market analysis — against the machine of liquidations.
The Architect
BPC — The Bolzen Price Covenant

ETH: Price Slice. Capital Sector : 2,928.60
🏷 ETH: Price Slice. Capital Sector. Dated: 10.12.2025
🏷 2,928.60 — Price not yet reached at time of publication
🏷 BPC — The Bolzen Price Covenant 5
🏷 Screenshot
🏷 Interactive Reference Guide: BPC — The Bolzen Price Covenant
🏷 P.S. English is not my native language — I offer no apologies for stylistic imperfections. What you see here is not a post. It is a demonstration of another level of preparation: the symbiosis of human intuition and algorithmic precision. Mathematics and aggressive market analysis — against the machine of liquidations.
The Architect
BPC — The Bolzen Price Covenant

ETH: Price Slice. Capital Sector. 2945.79🏷 ETH: Price Slice. Capital Sector. Dated: 11.12.2025
🏷 2945.79 — Price not yet reached at time of publication
🏷 BPC — The Bolzen Price Covenant 8
🏷 Screenshot
BPC — The Bolzen Price Covenant does not merely record price—it reveals the Index of Capital Strength and Commitment, woven from the will of institutional flows and intentions concealed behind the digital veils of the market.
Soon, the Index of Priority in Expended Energy Production will be unveiled—a metric born in the depths of mining, where every watt transforms into intention, and every intention crystallizes into price. This index will indicate the vector of priority pressure, drawing near to the very core of the order of price execution.
This is the measure of a new epoch.
Soon, the world will witness a demonstration of all prices—not as arbitrary marks on a chart, but as reflections of the energy potential invested in their very genesis. The Vertical Chart, designed by me, shall become a mirror of this new reality—and it will be revealed exclusively to those who stand with me, not behind the door.
For you, only one priority is unveiled today. And that is no small thing.
Think.
The age of the transitional world has begun.
Some remain behind the door.
Others walk with me.
All things in their time.
🏷 Interactive Reference Guide: BPC — The Bolzen Price Covenant
🏷 P.S. English is not my native language — I offer no apologies for stylistic imperfections. What you see here is not a post. It is a demonstration of another level of preparation: the symbiosis of human intuition and algorithmic precision. Mathematics and aggressive market analysis — against the machine of liquidations.
The Architect
BPC — The Bolzen Price Covenant

ETHEREUM New Update (4H)This analysis is an update to the previous one, which you can find in the related analyses section.
Based on the data currently available, wave D appears to be a diametric pattern, with wave G still remaining. Wave G is related to wave A, and since wave A was strong, wave G can also appear strong.
Additionally, USDT dominance is showing a decline, which suggests that one more bullish leg remains.
The targets are marked on the chart.
For risk management, please don't forget stop loss and capital management
When we reach the first target, save some profit and then change the stop to entry
Comment if you have any questions
Thank You

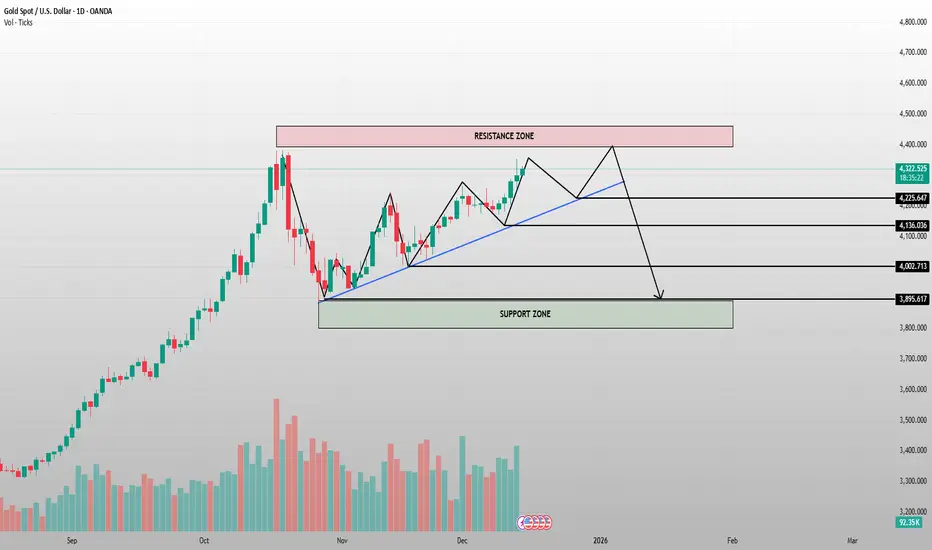
Gold at a Critical Crossroad — One Last Push Before the Trap?MARKET BRIEFING – GOLD (XAU/USD) | 1D
Market Structure:
Gold remains in a rising structure, respecting the ascending trendline. However, price is now approaching a major resistance zone, where selling pressure has previously stepped in aggressively.
Key Levels to Watch:
– Resistance Zone: 4,380 – 4,420
– Intermediate Support: 4,225 / 4,136
– Major Support Zone: 3,900 – 3,950
Price Action Read:
– As long as price holds above the rising trendline, bulls still have control.
– A final push into resistance is possible, but momentum is weakening near the highs.
– Failure to break and hold above resistance could trigger a sharp pullback toward the 4,000 handle and deeper into the support zone.
Bias:
➡️ Short-term: Cautious bullish into resistance
➡️ Medium-term: Watch for rejection → corrective move likely
Trader Focus:
This is decision time — either a clean breakout with acceptance above resistance, or a liquidity sweep followed by a downside rotation. Patience > prediction
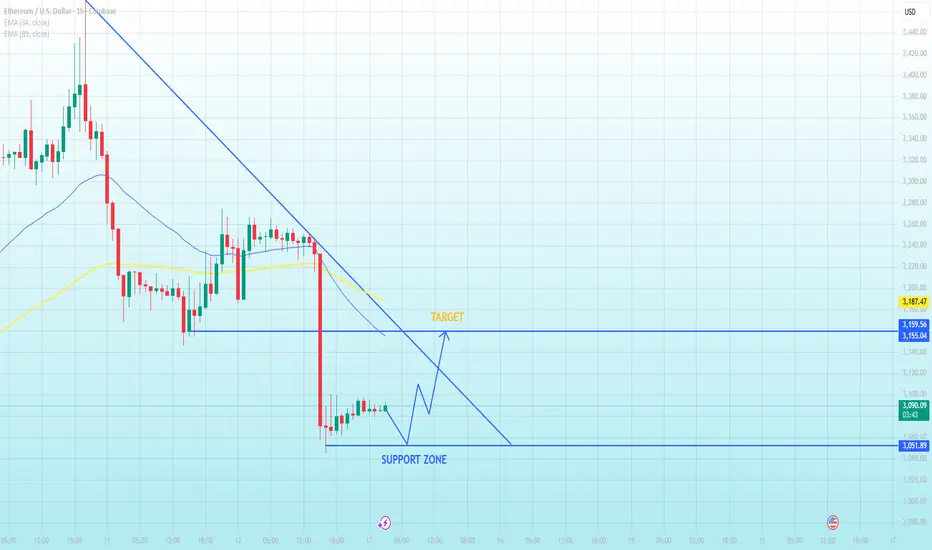
Is Ethereum Ready to Bounce Back or Will It Fall Deeper?Ethereum (ETH/USD) – 1-Hour Chart
Current Market Structure:
- Ethereum has recently seen a sharp drop, followed by a consolidation phase.
- Price is now positioned near a key support zone, as indicated by the horizontal blue line.
- The trendline above suggests a descending resistance that could play a significant role in price action going forward.
Key Levels:
- Support Zone: $3,051.89 - The price is currently near this level, and it will be critical in determining whether Ethereum will reverse or continue lower.
- Target Zone: $3,159.56 - If Ethereum successfully bounces from the support zone, the next target is near this level, marked by the blue arrow.
- Resistance Trendline: The price is approaching a downward sloping resistance. A break above this trendline would signify a potential bullish breakout.
Probable Scenarios:
- Bounce from Support Zone: The current level looks like a potential buy zone, with a bounce toward $3,159.56 as the first target.
- Continued Rejection at Resistance: If price fails to break the resistance trendline, expect further downside action toward lower support zones.
- Breakdown of Support: If price breaks below the support zone, a move lower toward the next support level is likely, potentially extending the decline.
Market Impact:
- Short-Term Volatility: There is likely to be volatility due to the support and resistance interaction, so keeping an eye on price action near these levels is crucial.
- Upcoming Events: Be aware of external factors like economic announcements that could disrupt price movement.
Trading Strategy:
Buy at Support: Look for a confirmation of the bounce from the support zone, aiming for the target near $3,159.56.
Sell at Resistance: If price fails to break above the resistance trendline, consider shorting with a target near the next support zone.
For now, patience is recommended until the price shows clear behavior near these key levels.
Gold Holds Steady as Traders Position Ahead of Key Fed Outlook🔹 MARKET BRIEFING – XAU/USD (4H)
Market State:
– Price is holding above short-term support and consolidating sideways, with momentum still leaning toward the buyers.
Key Levels:
– Support: 4164
– Resistance: 4264
– Breakout Zone: 4300–4340
Next Move:
– Bullish momentum remains in control; a breakout above 4300 would open the path toward 4340 and 4380.

Gold Just Paused at a Strange Level What is Coming Nex🔹 MARKET BRIEFING – XAU/USD (1H)
Market State:
– Price has broken out of the short-term consolidation, followed by a clean retest structure forming right at the breakout zone a classic continuation signal.
Key Levels from Chart:
– Entry Zone: around the retest area just above 4280–4286
– Stop Loss: 4262 – 4264
– Take Profit 1: 4317
– Take Profit 2: 4381
Next Move:
– As long as price holds above the SL zone and respects the breakout retest structure, XAU/USD is positioned for a continuation leg toward 4317, with potential extension toward 4381.

GBPUSD: Market Pullback Before the Next Upside Expansion1. MARKET CONTEXT
- GBPUSD has just completed a mild corrective pullback after a strong bullish leg, reflecting a healthy market reaction following the latest UK GDP release.
- The GDP data came in stable and slightly better than expected, not spectacular but strong enough to ease recession fears.
This creates a constructive environment for GBP not explosive, but certainly not bearish.
2. MACRO DRIVERS
✓ UK GDP Stability Supports GBP
Yesterday’s GDP print showed steady growth, reinforcing the view that the UK economy is gradually improving.
→ This reduces downside pressure on GBP in the short term.
✓ BOE Expected to Hold Rates Higher for Longer
With services inflation still sticky, the market is pricing in that the BOE will delay any rate cuts.
→ This acts as a tailwind for GBP during pullbacks.
✓ USD Softening as Markets Price Early Fed Cuts in 2025
Not aggressively bearish, but the USD is losing momentum as traders anticipate a shift toward Fed easing.
→ This opens the door for GBPUSD to resume its upside.
3. TECHNICAL STRUCTURE
On the GBPUSD 1H chart, price is forming a clean corrective pullback into the 1.3375 – 1.3380 support zone.
Key technical signals:
- Price is building a Higher Low after the pullback → bullish continuation structure
- Long lower wicks → declining sell pressure
- The 1.3375 support has been retested multiple times → strong demand
- The ascending trendline remains intact → uptrend not broken
→ The structure currently shows accumulation before upward breakout.
4. TRADE IDEA / PRICE EXPECTATION
As long as price holds above 1.3375, the bullish continuation setup remains valid.
Upside targets (matching your chart):
TP1: 1.34156
TP2: 1.34379
TP3: 1.34716
Expected behavior:
✔ Minor pullback
✔ Sideways accumulation
✔ Bullish leg toward TP1 → TP2 → TP3
5. MARKET SENTIMENT & OUTLOOK
With supportive GDP data, BOE’s higher-for-longer stance, mild USD weakness, and a clean bullish structure on the chart:
→ Short-term Trend: Sideways → Support → Bullish Continuation
→ Directional Bias: Upside toward all 3 targets

Bitcoin Rejected at Supply1. MARKET CONTEXT
Bitcoin on the 1H timeframe has just tapped into a clear resistance / supply zone, where previous bearish impulses originated.
The reaction is identical:
- Immediate slowdown
- Loss of bullish momentum
- Selling pressure absorbing every attempt to push higher
This confirms the market is still range-bound, with liquidity building between supply above and demand below.
2 . TECHNICAL ANALYSIS
The chart structure highlights:
• Supply Zone Rejection
Price entered the resistance zone and instantly stalled — showing strong sell orders waiting in that area.
• Lower-Timeframe Shift
The current candlestick sequence shows a micro shift from bullish impulse → correction → bearish intent.
• Liquidity & Imbalance Below
There is an unfilled region between current price and the demand zone, creating a clean path for the market to drop.
• Demand Zone Waiting at 89,300 – 87,770
This is where previous strong buy orders originated, making it the most logical target for the next bearish leg.
Overall, the structure favors a continuation downwards after a small corrective pullback.
3. TRADE IDEA
Bias: Short from the Supply Zone
The entry is positioned inside the resistance zone, aligning with institutional sell reaction.
Expected Price Behavior:
Minor bullish correction
Bearish continuation
Price targets the Demand Zone at 89,300 – 87,770
Trade Structure Shown on Chart:
Stop Loss: Above the supply zone
Entry: At resistance rejection
Take Profit: Demand zone below
This setup follows clean smart-money flow from supply → demand, with no structural break supporting a bullish reversal yet.

BTC: Price Slice. Capital Sector. 71689.50🏷 BTC: Price Slice. Capital Sector. Dated: 15.12.2025
🏷 71689.50 — Price not yet reached at time of publication
🏷 BPC Ξ-Passport: Energy Exigency & Covenant Priority
BPC 30 71689.50 EΞ = Energy Exigency | Covenant Priority: ACTIVE | Price Obligation Imminent Ξ3837 10.969065124
🏷 Screenshot
🏷 I. Interactive Reference Guide: BPC — The Bolzen Price Covenant
🏷 II. Execution Tithe
Instruction for the International Arena: Execution Tithe
🏷 P.S. English is not my native language — I offer no apologies for stylistic imperfections. What you see here is not a post. It is a demonstration of another level of preparation: the symbiosis of human intuition and algorithmic precision. Mathematics and aggressive market analysis — against the machine of liquidations.
The Architect
BPC — The Bolzen Price Covenant

ETH: Price Slice. Capital Sector. 3033.73🏷 ETH: Price Slice. Capital Sector. Dated: 12.12.2025
🏷 3033.73 — Price not yet reached at time of publication
🏷 BPC — The Bolzen Price Covenant 7
🏷 Screenshot
🏷 Interactive Reference Guide: BPC — The Bolzen Price Covenant
🏷 P.S. English is not my native language — I offer no apologies for stylistic imperfections. What you see here is not a post. It is a demonstration of another level of preparation: the symbiosis of human intuition and algorithmic precision. Mathematics and aggressive market analysis — against the machine of liquidations.
The Architect
BPC — The Bolzen Price Covenant

BTC: 82 804.29 — The Price the Market Remembers.🏷 BTC
🏷 17.11.2025
🏷 Capital Sector. Price Slice. System of Intelligent Anticipation.
🏷 82,804.29 — As of publication, this price has not been reached.
You must understand: the market has prices — and each has its own timeframe of execution. Such is the mechanics of the market. One price may execute on the 1D timeframe; another, on the 1M. The retail sector must trade from levels with risk discipline — or comprehend the market, its mechanics, and move toward the price. You must understand that a price is being fulfilled — and allow the instrument to deviate from your target, creating momentum and distance toward its realization — then capture the move on significant, higher timeframes. ATH, bear market, or bull market — these are emotions. Timeframes, patience, and strategy — these are your allies.
Some paint decor and cling to indicators — but you must understand: the institution knows. Large capital paints the data behind your indicators. With one hand, it aids others; with the other, it drives you into losses. The liquidation machine understands technical analysis and the behavioral factors of the masses. Anticipatory markings — dynamic prices — outpace algorithms. By applying observation and statistical rigor, you can avoid being deceived by the theater of market makers — and take your move.
The trend for this week, as of publication, is defined by the price of 98,200. Over the coming days, we will advance above this level in the long zone, and decline below it in the short zone. Upper targets: the instrument is directed toward the price sector of 112K–118K. Beyond this range, the probability of executing unfulfilled prices within this period is minimal. Afterward, the instrument will continue its decline to collect liquidity and execute the prices that remain pending.
Instrument volatility averages 15–18%, distributed equally in both directions. In the prior publication, 88,194.49 was established as the decisive zone — confirmed by statistical behavior of institutional capital.
Our advantage lies not only in analysis — but in the price sector we define in advance. Until these prices are executed, the dynamic marking remains active.
We do not predict the market.
We record its reality.
Please excuse any stylistic imperfections—English is not my native language. I write not to perfect form, but to reveal substance. My authority lies in the structure of the market, not in syntax.

ETH - UPDATECRYPTOCAP:ETH - Update:
Very neutral PA yet, completely stuck between 2 key levels on almost all timeframes. ⏳
Upper levels to watch: 3,175− 3,250
Lower support: 3,020− 2,980
Very tricky market nowadays, with a lot of sideways moves.
Weekly support to be maintained: $ 2,720
A weekly candle close under could confirm a medium/long-term sell alert! ⚠️
My opinion:
If price keeps consolidating above 2,980, then we could see a push toward 3,500+ 📈

ETH/USDT 1D CHart Long-Term.
🔍 Market Structure (Price Action)
1️⃣ Trend
Long-term: The uptrend has been broken (a downward breakout from the black trend line).
Medium-term: A sequence of lower highs and lower lows → a downtrend.
The current rebound is a correction in the downtrend, not a confirmed reversal.
📐 Key Levels (very well marked)
🔴 Support
2768 USDT – key support (current local bottom).
2157 USDT – final support from the previous structure (if 2768 breaks → a very real pullback).
🟢 Resistance
3506 USDT – current nearest resistance (retest after a downward breakout).
4101 USDT – strong supply zone + former support.
4477 USDT – main structural resistance (region of previous highs).
👉 Price is now exactly in the decision zone between 2768 and 3506.
📉 Trendline
Breaked and rejected (retest ended with a decline).
This is a classic signal of a downtrend continuation.
Until the price returns above 3506 and sustains, there is no uptrend.
📊 Stochastic RSI
The oscillator frequently reaches the 80–100 zone.
Currently: Moving out of overbought → signal of weakening upward momentum.
No bullish divergence → no confirmation of a trend change.
🧠 Scenarios
🐻 Baseline scenario (more likely)
Rejection of 3506
Return to around 3000 → 2768
Breakthrough of 2768 = open path to ~2150
🐂 Alternative (conditional) scenario
Daily close above 3506
Retest of 3506 as support
Only then is a move towards 4100 possible
🎯 Final conclusions
This is not a market for longs without confirmation.
The current rebound looks like a pullback in a downtrend.
Safeest:
Short at resistance (3506 / 4101)
Long only after a breakout and holding of 3506

ETH versus the worldNot pretending to be an expert but I think that what we called higher highs and higher lows.

ETHUSD - Waiting for Breakout This resistance line is being tested for the final time right now as support. Prior this line has been seen as strong resistance since the last bull run.
Price will likely break out strongly after the retest is done due to no resistance.
Still hodling out for an alt season
Daily timeframe
