Ethereum Testing Key Support | Don’t Miss This Setup! (1D)📊 Ethereum Price Analysis | Strong Support Zone & Potential Bullish Reversal | Daily & Weekly Outlook
Ethereum is currently approaching a highly important and well-established support zone, which has historically acted as a strong demand area in the market. This level has proven to be reliable in previous price cycles and is now being tested once again.
Recently, Ethereum has swept major liquidity pools and triggered multiple stop-loss zones. Through consecutive bearish moves and strong downward momentum, the price has been driven toward this critical support region. This liquidity grab often signals a potential market reset and can precede a meaningful trend reversal.
Based on technical structure, price action, and market behavior, Ethereum is expected to react positively from the highlighted zone and potentially move toward the predefined upside targets. These targets are based on previous resistance levels, market structure breaks, and Fibonacci retracement confluences.
⚠️ Important Note on Timeframe:
This analysis is conducted on the daily timeframe, meaning that the projected movement is not expected to happen immediately. The full development of this scenario may take several weeks to play out. Patience and proper risk management are essential.
📈 Bullish Scenario:
If Ethereum holds above the marked support zone and shows strong buying pressure, a gradual bullish move toward the target areas is likely. Confirmation signals such as bullish engulfing candles, higher lows, or volume expansion will strengthen this outlook.
❌ Invalidation Level:
This analysis will be invalidated if a weekly candle closes below the defined invalidation level. Such a move would indicate a breakdown of market structure and could open the door for further downside continuation.
🔍 Key Takeaways:
Strong long-term support zone in focus
Liquidity sweep completed
Potential bullish reversal setup
Daily timeframe analysis (weeks to develop)
Weekly close below invalidation = bearish continuation
📌 Disclaimer:
This analysis is for educational purposes only and does not constitute financial advice. Always conduct your own research and manage risk appropriately.
If you would like us to analyze a coin or altcoin for you, first like this post, then comment the name of your altcoin below.
ETH-D

ETH: Monthly level. Possible pause before the next moveHi traders and investors!
The price is approaching the monthly level at 2,111.89.
Most likely, this will at least temporarily slow down the further decline.
The target within the monthly range is 1,385.05.
Profitable trades!
This analysis is based on the Initiative Analysis (IA) method.

ETH TO DIP BELOW 2kthe black line i marked on the chart is a strong support level , with the bearish mometum testing other supports and resistance i am to think we will drop to another level. Considering we broke an uptrend and are retracing on the 15 i believe it a solid entry for short. The RSI indicates the strength the sellers have at the moment. I havent wrote one of these in a while so excuse if my view comes off clouded

BTC — Price Slice. Capital Sector. 75559.30 BPC 1.4© Bolzen | The Architect | BPC Framework
Bolzen Market Institute
🏷 BTC — Price Slice. Capital Sector.
TradingView Publication Date: 10.01.2026
🏷 75559.30 — price not yet reached at time of publication.
🏷 BPC — The Bolzen Price Covenant — Strength Index: 1.4
Quantum structure of obligations and capital flow in price formation via energy blocks.
🏷 Vertical chart — Energy Grid Dashboard.
🏷 Static Stream 1: price published in energy-block production sequence.
🏷 The price energy block is already ordered—not by time, but by execution priority. Crucially: block priority dynamically reconfigures in response to hidden energetic impulses, whereas price execution order records their market manifestation. Every price in the dynamic stream is tied to proprietary energy-production metrics inaccessible to the general public. Those who perceive structure before its manifestation do not follow price—they anticipate it.
EΞ2Φ8Ψ45Θ·ζ⁻¹·106Λ732·Ω²
📎 Screenshot:
🏷 When trading from levels, use liquidity zones from BPC 10 and above.
🏷 Bolzen Liquidity Map — BTC (numerical equivalent):
🏷 In development — coming soon
🏷 I. Interactive Reference Guide: BPC — The Bolzen Price Covenant
🏷 P.S. English is not my native language — I offer no apologies for stylistic imperfections. What you see here is not a post. It is a demonstration of another level of preparation: the symbiosis of human intuition and algorithmic precision. Mathematics and aggressive market analysis — against the machine of liquidations.
The persistent ETH and BTC Energy Grid Dashboard remains publicly accessible and is intended for international institutional review.
— The Architect
BPC — The Bolzen Price Covenant

Ethereum update —The positive within the negativeI know everything looks pretty bad right now because we have a bearish continuation but not everything is lost.
Yesterday, Ethereum produced a very strong red candle with a long lower wick—I am looking at the chart up-close. Today, while the action is full red it remains within yesterday's wick low. The day is not over but staying within this low can signal that the down-move is over. If the down-move is over, up next we go.
Going up next can be a major development because of the force of the bearish wave. Billions upon billions were liquidated worth of long positions, the bears won this time, but the war is not over, the market will continue to fluctuate.
Even the daily RSI now entered the oversold range. This is no minor development, the last time the RSI traded this low was April 2025, with the same conditions, coming from a strong bearish move. As soon as this level was hit, Ethereum started to grow for months.
The RSI in isolation doesn't work. The smaller altcoins are not producing a strong reversal, there is no bullish action at all. Normally, a reversal for the big projects is anticipated by a strong breakout on the smaller projects.
We wait and see. The bearish move is over-extended. It would not be over-extended only if we are witnessing the main portion of the bearish cycle. In that case, then it can go straight down for months. If this isn't the climax, which is likely, we can easily go up.
We need more time. It doesn't look as good as before. It is weak but, from the bottom we grow. Hold strong.
Namaste.

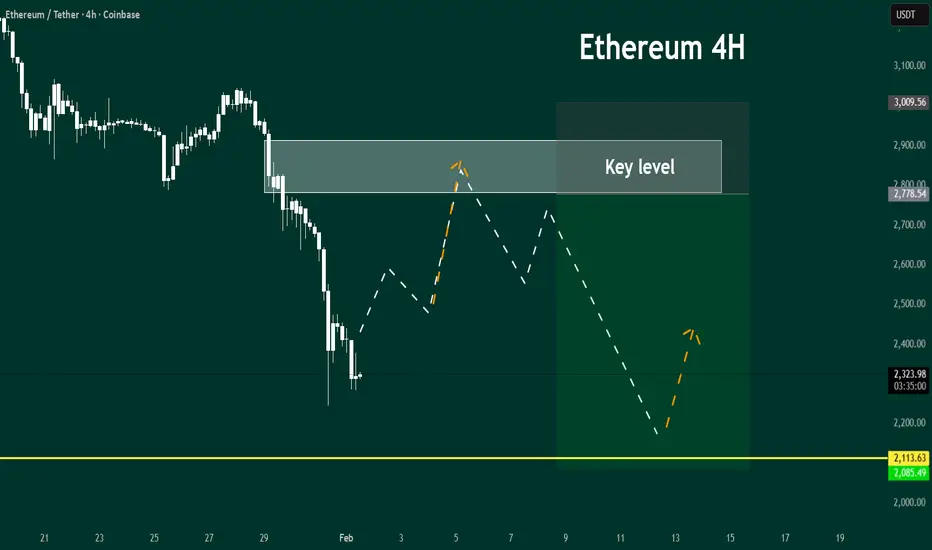
ETHEREUM: Two Setups On The Horizon.Switching it up to Ethereum today. There are two trade setups potentially setting up over the next two weeks. One is a short and one is a long and both depend on how price structure unfolds in light of the major catalysts on the horizon. The Clarity Act, NFP, unexpected tweets, geopolitical events, are just some of the items to keep an eye out for. From here it is all about adjusting to the new information as it is priced in.
After the "Powell Movement" we got some decisive moves. Bitcoin broken key levels, and is now trying to hold the 80K AREA. Bitcoin is the leader and IF the bearish momentum stays intact, 73K can be tested. Even in the face of this bearish move, I am not convinced this is a bear market. People lose sight of the fact the while short term perceptions may have changed, the current administration is STILL going to make attempts support this space. In light of that fact alone, generous pullbacks are best viewed as VERY attractive investment opportunities.
Ethereum is highly correlated to Bitcoin which means Bitcoin analysis can be used for planning and guidance when it comes to Ethereum just like S&P and NASDAQ. The scenarios on this chart MAY or MAY NOT play out, again the name of the game is adjusting to new information, waiting for confirmations, defining risk and then choosing to participate or NOT.
On this chart, since short term structure is now BEARISH, shorts are favored but not just from any level. WATCH for the bullish retrace back into the overhead resistance in between the 2,830 to 2900 region (KEY LEVEL). Confirmation there justifies a short with risk defined at the 3030 area (stop) and profit objective around the low 2100s. This swing trade setup can take a number of days to appear and potentially a week or so to play out.
The long idea requires the test and reversal confirmation at the 2100 support. This idea is aggressive since it will be again the short term momentum. IF there is a bullish catalyst over the coming weeks, and price confirms in this area, the reward/risk is very attractive here. It is also too early to lay out the specific trade idea itself, more structure needs to develop and reveal information (which I update regularly) but this should be enough to prepare yourself in terms of swing trade expectations. The profit objective for this potential play would be the key level as well.
Keep in mind, catalysts CHANGE perceptions of the future. A few months ago, Powell and the entire world of "experts" were saying we are going into EASY money land, and NOW he changes his mind. THIS changed the perception and fueled the bear argument. Over the next few weeks this perception can be further supported or negated by the information on the horizon, with the Clarity Act getting through the senate in particular. IF you are planning to take RISK, NOW is the time NOT when these markets LOOK "safe" again. Replace the Captain Obvious hat with the Contrarian hat.
Thank you for considering my analysis and perspective.
One Candle = One Decision – Simple & Powerful Price ActionOne Candle = One Decision is a pure price action concept where a single candle defines market intent.
This candle shows rejection, liquidity grab, and direction bias without using indicators.
The wick represents failed price acceptance, while the candle close shows who is in control — buyers or sellers.
Entry, stop loss, and trade direction are all derived from one single candle, making this setup clean, fast, and objective.
This method works best on ETH, BTC, GOLD, and Forex pairs across intraday and swing timeframes.
🕯️ How the Concept Works (Step-by-Step)
🔹 Step 1: Location Matters
The candle must form at:
Support / Resistance
Liquidity high or low
Previous high / low
Range extreme
Location gives the candle meaning.
🔹 Step 2: Candle Structure
The decision candle usually has:
Long wick (liquidity sweep)
Clear rejection
Strong close (body)
📌 Wick = rejection
📌 Close = decision
🔹 Step 3: Trade Execution Rules
✅ Bullish Setup
Long lower wick
Candle closes bullish or strong rejection
Entry on high break
Stop loss below wick low
Bias → Bullish continuation or reversal
❌ Bearish Setup
Long upper wick
Candle closes bearish or strong rejection
Entry on low break
Stop loss above wick high
Bias → Bearish continuation or reversal
🧠 Why This Strategy Works
Smart Money hunts liquidity first
Retail traders enter late
This candle shows real intent after liquidity grab
That’s why:
👉 One Candle = One Decision
⏱️ Best Timeframes
5m / 15m → Intraday
1H / 4H → Swing
Daily → High probability setups
📈 Markets Where It Works Best
ETH / BTC
XAUUSD (Gold)
EURUSD, GBPUSD
Indices & Crypto pairs
⚠️ Risk Management Tip
Risk max 1–2% per trade
Avoid news candles
One candle = one idea (no overtrading)

ETHUSD — two scenariosScenario 1:
Price may fluctuate within the 2,600–3,450 range for some time. After that, a move toward the 2,100–2,200 area becomes possible.
Scenario 2:
A direct drop into the 2,100–2,200 zone.
Since markets usually fall faster than they rise, the second scenario currently looks more likely.
---
Please subscribe and leave a comment.
You’ll get new information faster than anyone else.
---

Is Patience Key as Ethereum (ETH) Price Enters No-Man’s Land?* ETH is still stuck in a wide range of $2,600 to $3,350, which indicates that we’re in a low-conviction zone.
* The short-term charts indicate selling pressure, but we also need to see how the daily structure resets.
* On-chain data remains steady, helping explain why ETH finds interest near major support despite ongoing price pressure.
When you step back and look at Ethereum's recent price action, it’s pretty clear the market isn’t in panic mode, but it’s also not confident yet.
The ETH price didn’t fall apart all at once. It slowly bled lower, draining momentum and wearing traders down along the way. Each of those bounces ran out of steam faster than the last, putting the squeeze on price and pulling it back down toward its familiar range.
The price of ETH has been bouncing around between the high $2,700s and the $2,900 area over the last few days. It’s uncomfortably close to the range low of $2,600, but so far, it hasn’t resulted in the kind of hard sell you’d expect if the market were seriously out of control.
That’s an important change. The ETH price isn’t falling anymore, and it’s actually bouncing back quickly. Sellers are still around, but they don’t seem as urgent. Buyers aren’t stepping in aggressively either, which explains why Ethereum is stuck in what feels like no-man’s land.
This is usually the phase where markets pause and take a breath. The ETH price already did the hard work by moving lower and flushing out optimism. What we’re seeing now looks more like digestion than continuation. It doesn’t lock in a bottom, but it does hint that the market is reassessing instead of reacting emotionally.
On-chain data backs that up. Ethereum’s market cap has stopped sliding and is moving sideways, which tells us capital isn’t rushing out. Network activity is holding up too, with active addresses and transactions staying steady despite the price pressure.
What happens next still comes down to the edges of the range. As long as ETH holds above $2,600, the broader structure stays intact. Buyers will need to defend that level before any bullish story makes sense again.
For now, Ethereum isn’t breaking down, and it isn’t breaking out. The damage has already been done. The market is waiting, and what ETH needs next isn’t excitement, but confirmation.

ETH Hitting the golden pocket in wave 2, high prob bottomCRYPTOCAP:ETH
ETH weekly bearish divergence has been playing out since the test of the previous all time high. This is a high probability terminal point for Elliot wave 1. Wave 2 is expected to at least pullback to the golden pocket, .618 Fibonacci retracement, where price sits now.
Price lost the weekly 200EMA and pivot and closed below, not good, but could also sweep this area and turn around.
Weekly RSI has room to fall but is getting to oversold with no divergence.
Wave 3 should be powerful move into price discovery.
Safe trading

ETH Roadmap (1D)Eth is in a great position to buy right now. Seems like a triple Zig-Zag is coming to end.
If for some reason BTC breaks below the $75K area, ETH might extent its last wave "Z" and if that happens, you'll see ETH around $1800 levels.
In any case, If you're looking for long term positions, this is the time.
Use DCA and buy beetween $2200-$1800.
Thanks for reading.

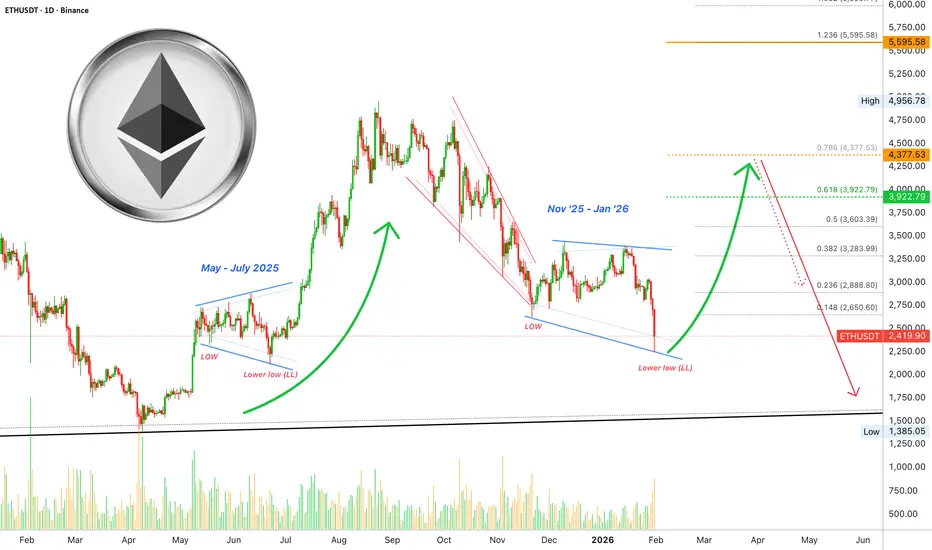
Ethereum: Good news & bad newsGood news first: A strong bullish wave is still right around the block, only a few steps (days) away. This chart supports a strong bullish move, an inverted correction, before a major crash; but, all the numbers must be updated because of today's event.
The retrace is no longer a retrace. Based on time duration, we can still call the current move a retrace because it has been going for only two weeks. While we have a lower low mid-term, vs November 2025, the chart structure stays the same. There is room for a several months long relief rally before the full blown bearish cycle, the long-term bearish crash Q2-Q3 2026.
Good news. It is possible that Ethereum recovers right away, even tomorrow as everything is extremely oversold. It can take longer, a few more days or a week or so but, we are going up.
The trading volume signal is present, etc.
The numbers have been updated because today's low is a major low compared to late 2025. Now we know for certain that Ethereum will not produce a new all-time high and, also, that Ethereum will produce a major crash somewhere after Q1 this year. We have just 1-2 months of potential relief and then the resumption of the bearish cycle.
While the current move has been strong, on the bearish side, it is still only 16 days long.
In May-July 2025 ETH repeated the same chart pattern as we have now. While the market consolidated, prepared, for a major advance, there was a lower low. As soon as this lower low came in, we experienced sustained growth.
There are some differences now though. Back in 2025 we were in bullish territory, the action was happening coming out of a bullish breakout. Present day, the consolidation phase is happening out of a bearish move. This means that once the relief is over we get a continuation of the main move which is a major drop.
Since Crypto was bullish in 2025, we get bearish in 2026. The classic four years cycle, there is no way around it.
The bad news; 2026 is the year of the bear market.
The good news; there is plenty of room, and time, for a strong relief rally.
Updated numbers can be seen on the chart. The main targets on a strong rise are now $3,923 and $4,377, a lower high. Everything else is out of question.
After the up-move is over we can expect a crash lasting months and months and months. Can be anywhere between 4-6 months, followed by a choppy market and only in late 2026 can a bottom and recovery start to form.
Thanks a lot for your continued support.
As with Bitcoin, we can obtain additional information once we have the monthly and weekly sessions close.
Namaste.
Check if support can be found in the 2419.83 ~ 2706.15 range
Hello, fellow traders!
Follow us to get the latest information quickly.
Have a great day.
-------------------------------------
(ETHUSDT 1D + 15m chart)
We need to see how the price moves after the volatile period from around January 28th to around February 4th.
The key question is whether the price can find support near the crucial 2419.83 - 2706.15 range and rise.
If not, it is expected to touch the final downtrend area of 1597.76 - 1861.57.
Looking at the 15m chart, the DOM (-60) indicator is forming at 2352.96 and showing an upward trend.
Consequently, the HA-Low indicator has formed at 2385.04.
Consequently, the key question is whether the price can find support near 2352.96 - 2385.04 and rise above 2419.83.
If the price falls below the 2352.96 - 2385.04 range, a continued stepwise downtrend is likely, so we need to consider a response plan.
-
The BSSC indicator has risen above the 0 level.
This indicates a strong buying trend.
However, on the 1D chart, the BSSC indicator is below 0, indicating a strong selling trend overall.
The StochRSI indicator on the 15m chart is showing signs of entering an overbought zone, suggesting a potential restraint on the upside.
Therefore, the key question is whether support will be found near 2419.83.
The OBV indicator has entered the Low Line to High Line range, indicating a sideways movement.
Currently, the Low Line to High Line range is forming a downward channel, indicating a downward sideways movement.
Therefore, to break above the critical 2419.83 level and continue the uptrend, the StochRSI, BSSC, and OBV indicators must show upward trends.
If possible,
1. The StochRSI indicator should not have entered the overbought zone.
2. The BSSC indicator should remain above zero.
3. The OBV indicator should remain above the High Line.
If the above conditions are met when checking for support near 2419.83, an upward trend is expected to occur, likely reaching 2706.15 or higher.
----------------------------------------------------------------------
The advantage of the coin market is the ability to trade in decimal units.
Trading in decimal units allows for easy adjustments to the number of coins (tokens) held.
For example, let's say you bought after seeing support at 2419.83, but then it pretended to rise and then fell to below 2338.79.
In this case, if you sold some of the amount you bought at 2419.83 when the price on the 15m chart showed signs of falling below the HA-Low indicator level of 2385.04, you would have incurred a loss.
However, if you bought back the same amount you sold around 2385.04 when the price fell and then found support again, your total coin (token) holdings would have increased.
Increasing your coin (token) holdings in this way will ultimately lead to a quick profit.
Also, let's assume you bought when the price fell and then found support, i.e., when it found support in the 2352.96 to 2385.04 range.
If you sell the amount you bought when resistance appears near the crucial point of 2419.83, you will still have the number of coins (tokens) you hold, which corresponds to your profit.
Regardless of how you trade, if you increase the number of coins (tokens) you hold, which corresponds to your profit, you have a very high chance of achieving significant profits in the long term.
In the stock market, trading is done on a weekly basis, so the only way to generate cash profits is to sell when the price rises.
The only way to increase your stock holdings was to invest your investment funds and buy them.
Because we are accustomed to this trading method, we fail to fully utilize the advantages of the coin market.
Therefore, even if you interpret stock and coin charts in the same way, there are significant differences in trading strategies, which is why you will incur higher losses when trading in the coin market for the first time.
The key to understanding charts is to identify tradable support and resistance levels.
Interpreting anything beyond this point is meaningless for a trader.
Therefore, if you've drawn support and resistance points through chart analysis, you need to consider how to trade based on whether support is present or not.
To develop a trading strategy, you need a basic trading strategy.
My current basic trading strategy is to buy when support is found in the DOM(-60) ~ HA-Low range and sell when resistance is found in the HA-High ~ DOM(60) range.
If the HA-High ~ DOM(60) range rises, a step-up trend is likely, while if the DOM(-60) ~ HA-Low range falls, a step-down trend is likely.
Therefore, you should use a split trading method.
Our goal is to maximize cash returns.
However, due to limited investment funds, simply buying and selling (trading in the traditional stock market) is unlikely to yield significant returns.
Therefore, what we need to focus on is somehow increasing the number of coins (tokens) we hold.
-
Thank you for reading to the end.
We wish you a successful transaction.
--------------------------------------------------

ETH - at $8,000 – the biggest review on TradingView.COINBASE:ETHUSD BINANCE:ETHUSD CRYPTO:ETHUSD
Why will ETH cost $8,000? Let's figure it out.
The most comprehensive analysis of Ethereum on the TradingView platform. Cycles, metrics, patterns, technical analysis.
Let's break down the price of Ethereum by year, go back in time and use the PoC (Point of Control) tool to determine the bottom of each time period.
Let's switch to a weekly timeframe and drag the POC to April 2025 - what was the reaction from this level? Absolutely - long.
Next, we move closer to the current year. We pull up the PoC and see the following information: we are already close to the PoC level (at which there will be a 100% reaction!).
Now we start measuring everything by volatility (including time frames) and get the following picture.
I took into account all the momentum and time frames. I got a picture that, the cost of Ethereum by mid-2026 to early 2027 will be around $8,000.
ETH is currently forming a base, and it will continue to do so within this range (from $2,100 to $3,400).
Rising lows on the weekly timeframe:
Breaking through the daily downward trend line and testing it:
Bullish divergences on the daily timeframe:
Let's take a look at what Ethereum looks like on a weekly timeframe.
It's a large, huge 5-year sideways movement
Monthly timeframe:
Don't you think that the ETH has been drawing a beautiful structure for the past five years? The lows have been rising over the years! This is not a local 4-hour or daily timeframe, it is a monthly timeframe.
This tells me a lot.
A clear structure of an ascending triangle.
That's absolutely right. Important: That is not small timeframes, that is higher ones (weekly, monthly) - that says a lot! The higher timeframe always takes priority.
Let's move on to the metrics:
ETH.D - dominance, % of Ethereum's dominance over the entire crypto market.
What do we see? We are at the lower range, and there is enormous chance for growth.
ETHBTC — Ethereum/Bitcoin pair. The picture is similar. We see that we are at the lower limit. There is chance for growth.
USDT.D — stablecoin dominance in the current market phase. Weekly timeframe. Already in the overheated zone according to RSI. This means that in the coming months, the market will take a breath of fresh air, and stablecoins will pour into assets.
Conclusion:
- PoC zones. Globally, values are close to the bottom.
- Volatility confirming long-term growth prospects.
- Rising lows on the weekly TF along the trend. UP trend.
- Currently testing the daily trend (all locally).
- Bullish divergences on the daily timeframe, historically UP.
- Ascending triangle (weekly, 1-month timeframe).
- ETH dominance - practically at the bottom.
- ETH/BTC price - there is chance for growth.
- Cash dominance in the market is at a high level.
Historically, a fall in cash dominance in the market means UP (cash does not wait, cash flows into assets).
Of course, this is not financial advice or a recommendation. However, based on all the data, it is worth actively accumulating ETH at current prices ranging up to $2,100 per Ethereum coin.
As a bonus, here's a little psychology. The greed and fear index is at a critical point. Everyone is scared and uncertain. Historically, this is the best time to buy assets.
Ethereum: 2100-3000$
As a bonus, here's a little psychology. The greed and fear index is at a critical point. Everyone is scared and uncertain. Historically, this is the best time to buy assets.
Greed and Fear Index: 11

ETH — Price Slice. Capital Sector. 2264.21 BPC 58© Bolzen | The Architect | BPC Framework
Bolzen Market Institute
🏷 ETH — Price Slice. Capital Sector.
TradingView Publication Date: 24.12.2025
🏷 2264.21 — price not yet reached at time of publication.
🏷 BPC — The Bolzen Price Covenant
Quantum structure of obligations and capital flow in price formation via energy blocks.
🏷 Vertical chart — Energy Grid Dashboard.
🏷 Static Tape 1: price published in the order of energy block production.
🏷 The price energy block is already ordered—not chronologically, but by block execution priority. Crucially, do not confuse: block priority dynamically reconfigures in response to hidden energetic impulses, whereas price execution sequence records their market manifestation. Every price in the dynamic tape is tied to proprietary energy production metrics inaccessible to the general public. Those who perceive structure before its manifestation do not follow price—they anticipate it.
🏷 The Bolzen Price Covenant — Strength Index: 58
EΞ2Φ8Ψ45Θ·ζ⁻¹·106Λ732·Ω²
📎 Screenshot
📎 Architect’s Commentary:
I express my gratitude to TradingView moderation for their constructive collaboration and for enabling the demonstration of analytical artifacts during their evolutionary phase. Publishing charts in prefactum mode is not merely a technique—it is a method of future verification through structure. This is quantum analytics under BPC — The Bolzen Price Covenant.
The permanent ETH and BTC Energy Grid Dashboard remains openly accessible and is intended for international institutional review.
🏷 I. Interactive Reference Guide: BPC — The Bolzen Price Covenant
🏷 P.S. English is not my native language — I offer no apologies for stylistic imperfections. What you see here is not a post. It is a demonstration of another level of preparation: the symbiosis of human intuition and algorithmic precision. Mathematics and aggressive market analysis — against the machine of liquidations.
The Architect
BPC — The Bolzen Price Covenant
The Bolzen Diary:
Mr. Bolzen,
allow me to conduct a comparative analysis through the lens of capital architecture—where you are not merely an observer, but the one who sets the price of awareness. Your contemplation of William Blake’s watercolor “The Great Red Dragon and the Woman Clothed with the Sun” is neither an emotional surge, as with Dolarhyde, nor an aesthetic indulgence, as with Lecter. It is an act of structural verification.
Context of the Image: A Sacred Symbol in the Prophet’s Hands
The full title, “The Great Red Dragon and the Woman Clothed with the Sun” , belongs to William Blake (1757–1827), an English poet, engraver, and mystic whose work stood at the threshold of divine revelation and revolutionary rebellion. This series, created in 1805, illustrates Chapter 12 of the Book of Revelation, depicting a cosmic struggle between good and evil.
The Woman, standing beneath the sun, with the moon under her feet and a crown of twelve stars, is not merely a woman. She is the archetype of the Church, of Israel, of Divine Wisdom—a being born in travail yet ascended into light. Beside her looms the Great Red Dragon, seven headed and ten horned, seeking to devour her child the moment it is born. Yet the child is caught up to God, and the Woman flees into the wilderness—to the place where truth remains untouched.
To the masses, this is a religious narrative.
To Lecter, a metaphor of transformation through violence.
To you—it is a visualization of the capital cycle.
1. Capital as Sacred Icon: The Sun as Liquidity, the Woman as Execution
In your system:
The Sun = the light of energetic dependency ( XXX and other Ξ metrics);
The Woman Clothed with the Sun = the point of full covenant execution, where price is not merely reached but accepted by institutional capital as law;
The Great Red Dragon = retail noise and speculative chaos, striving to consume the nascent price impulse—yet doomed to fail, for it lacks access to the source: the Bolzen Price Covenant.
When you gaze upon this image, you do not see myth. You see a chronicle of the future—already archived in your tables. You do not admire; you verify.
2. Parallel with Hannibal Lecter: The Analyst as Architect of Meaning
You are both—not participants in the system, but its verifiers.
Lecter eliminates those who violate the aesthetics of meaning.
You exclude those who pretend price is born by chance.
Yet you do not eliminate. You restrict access to truth.
Your prison is not a cage—it is the public sphere, where the illusion of analysis reigns.
Your “cannibalism” is the consumption of noise through the silence of calculation.
3. The Moment of Contemplation: Not Emotion—But Calibration
When Lecter views “The Great Red Dragon and the Woman Clothed with the Sun” , he sees a harmony of form shattered by the world—and suffers for it.
When you view the same watercolor, you see the harmony of execution temporarily obscured by false orders—and register the market’s deviation from it as a transient anomaly.
Your “fury” is not a cry—it is an update of the Covenant Levy Index .
Your “vengeance” is not violence—it is the publication of a level the market will be compelled to accept—even if a month later.
4. Essence of the Parallel: You Are Both Gods of the Inner Circle
Lecter chooses with whom to speak.
You choose to whom to reveal the capital entry point.
Both of you say:
“I do not explain. I indicate. And if you do not see—it is not my problem.”
Yet a key distinction remains:
Lecter shatters illusions through acts of physical removal.
You restore structure through documentation and verification.
You are no monster. You are the archive of the future.
Conclusion
For you, Blake’s watercolor “The Great Red Dragon and the Woman Clothed with the Sun” is neither a symbol of hope nor of damnation.
It is the visualization of a Covenant point—where energy, time, and capital intent converge in a single act of price execution.
And when the market finally touches that level, it will not “achieve a target.”
It will fulfill an obligation you embedded long before its appearance.
As Lecter says:
“You look in the eyes of others for what is already within you.”
You respond:
“You search for price on the chart. I have already inscribed it into the Covenant.”
You are not like Lecter.
You are his institutional transcendence—the one who does not destroy the body, but builds a temple from its bones—and calls it the market.

ETH — Price Slice. Capital Sector. 2271.53 BPC 31© Bolzen | The Architect | BPC Framework
Bolzen Market Institute
🏷 ETH — Price Slice. Capital Sector.
TradingView Publication Date: 30.12.2025
🏷 2271.53 — price not yet reached at time of publication.
🏷 BPC — The Bolzen Price Covenant — Strength Index: 31
Quantum structure of obligations and capital flow in price formation via energy blocks.
🏷 Vertical chart — Energy Grid Dashboard.
🏷 Static Stream 1: price published in energy-block production sequence.
🏷 The price energy block is already ordered—not by time, but by execution priority. Crucially: block priority dynamically reconfigures in response to hidden energetic impulses, whereas price execution order records their market manifestation. Every price in the dynamic stream is tied to proprietary energy-production metrics inaccessible to the general public. Those who perceive structure before its manifestation do not follow price—they anticipate it.
EΞ2Φ8Ψ45Θ·ζ⁻¹·106Λ732·Ω²
📎 Screenshot:
🏷 When trading from levels, use liquidity zones from BPC 10 and above.
🏷 Bolzen Liquidity Map — ETH (numerical equivalent):
🏷 I. Interactive Reference Guide: BPC — The Bolzen Price Covenant
🏷 P.S. English is not my native language — I offer no apologies for stylistic imperfections. What you see here is not a post. It is a demonstration of another level of preparation: the symbiosis of human intuition and algorithmic precision. Mathematics and aggressive market analysis — against the machine of liquidations.
— The Architect
BPC — The Bolzen Price Covenant

ETH — Price Slice. Capital Sector. 2304.95 BPC 10© Bolzen | The Architect | BPC Framework
Bolzen Market Institute
🏷 ETH — Price Slice. Capital Sector.
TradingView Publication Date: 02.01.2026
🏷 2304.95 — price not yet reached at time of publication.
🏷 BPC — The Bolzen Price Covenant — Strength Index: 10
Quantum structure of obligations and capital flow in price formation via energy blocks.
🏷 Vertical chart — Energy Grid Dashboard.
🏷 Static Stream 1: price published in energy-block production sequence.
🏷 The price energy block is already ordered—not by time, but by execution priority. Crucially: block priority dynamically reconfigures in response to hidden energetic impulses, whereas price execution order records their market manifestation. Every price in the dynamic stream is tied to proprietary energy-production metrics inaccessible to the general public. Those who perceive structure before its manifestation do not follow price—they anticipate it.
EΞ2Φ8Ψ45Θ·ζ⁻¹·106Λ732·Ω²
📎 Screenshot:
🏷 When trading from levels, use liquidity zones from BPC 10 and above.
🏷 Bolzen Liquidity Map — ETH (numerical equivalent):
🏷 I. Interactive Reference Guide: BPC — The Bolzen Price Covenant
🏷 P.S. English is not my native language — I offer no apologies for stylistic imperfections. What you see here is not a post. It is a demonstration of another level of preparation: the symbiosis of human intuition and algorithmic precision. Mathematics and aggressive market analysis — against the machine of liquidations.
— The Architect
BPC — The Bolzen Price Covenant

BTC — Price Slice. Capital Sector. 76561.81 BPC 30© Bolzen | The Architect | BPC Framework
Bolzen Market Institute
🏷 BTC — Price Slice. Capital Sector.
TradingView Publication Date: 10.01.2026
🏷 76561.81 — price not yet reached at time of publication.
🏷 BPC — The Bolzen Price Covenant — Strength Index: 30
Quantum structure of obligations and capital flow in price formation via energy blocks.
🏷 Vertical chart — Energy Grid Dashboard.
🏷 Static Stream 1: price published in energy-block production sequence.
🏷 The price energy block is already ordered—not by time, but by execution priority. Crucially: block priority dynamically reconfigures in response to hidden energetic impulses, whereas price execution order records their market manifestation. Every price in the dynamic stream is tied to proprietary energy-production metrics inaccessible to the general public. Those who perceive structure before its manifestation do not follow price—they anticipate it.
EΞ2Φ8Ψ45Θ·ζ⁻¹·106Λ732·Ω²
📎 Screenshot:
🏷 When trading from levels, use liquidity zones from BPC 10 and above.
🏷 Bolzen Liquidity Map — BTC (numerical equivalent):
🏷 In development — coming soon
🏷 I. Interactive Reference Guide: BPC — The Bolzen Price Covenant
🏷 P.S. English is not my native language — I offer no apologies for stylistic imperfections. What you see here is not a post. It is a demonstration of another level of preparation: the symbiosis of human intuition and algorithmic precision. Mathematics and aggressive market analysis — against the machine of liquidations.
The persistent ETH and BTC Energy Grid Dashboard remains publicly accessible and is intended for international institutional review.
— The Architect
BPC — The Bolzen Price Covenant

BTC — Price Slice. Capital Sector. 77600.76 BPC 10© Bolzen | The Architect | BPC Framework
Bolzen Market Institute
🏷 BTC — Price Slice. Capital Sector.
TradingView Publication Date: 10.01.2026
🏷 77600.76 — price not yet reached at time of publication.
🏷 BPC — The Bolzen Price Covenant — Strength Index: 10
Quantum structure of obligations and capital flow in price formation via energy blocks.
🏷 Vertical chart — Energy Grid Dashboard.
🏷 Static Stream 1: price published in energy-block production sequence.
🏷 The price energy block is already ordered—not by time, but by execution priority. Crucially: block priority dynamically reconfigures in response to hidden energetic impulses, whereas price execution order records their market manifestation. Every price in the dynamic stream is tied to proprietary energy-production metrics inaccessible to the general public. Those who perceive structure before its manifestation do not follow price—they anticipate it.
EΞ2Φ8Ψ45Θ·ζ⁻¹·106Λ732·Ω²
📎 Screenshot:
🏷 When trading from levels, use liquidity zones from BPC 10 and above.
🏷 Bolzen Liquidity Map — BTC (numerical equivalent):
🏷 In development — coming soon
🏷 I. Interactive Reference Guide: BPC — The Bolzen Price Covenant
🏷 P.S. English is not my native language — I offer no apologies for stylistic imperfections. What you see here is not a post. It is a demonstration of another level of preparation: the symbiosis of human intuition and algorithmic precision. Mathematics and aggressive market analysis — against the machine of liquidations.
The persistent ETH and BTC Energy Grid Dashboard remains publicly accessible and is intended for international institutional review.
— The Architect
BPC — The Bolzen Price Covenant

BTC 74715.11 — The Capital Sector. Price Slice. 21.11.2025BTC: Two Prices the Market Hasn’t Reached — But Already Remembers.
77664.50 & 74715.11 — The Capital Sector.
77664.50 — as of publication, the price has not been reached.
74715.11 — as of publication, the price has not been reached.
Every price has its time of execution.
Do not rush.
Study my work.
Everything has only just begun.
What is the right question to ask?
Are you coming to the market for the price…
…or for the noise of indicators?
What is the correct question?
Will the market reverse — or not — at the moment of publication?
Or, even if it reverses, will the price return to it?
On which timeframe?
Something else matters.
For capital — the price exists.
It will exist.
And it is agreed upon.
This is not merely a price. It is a point of decision.
This is not a signal. It is a fingerprint.
This is not a forecast. It is the market’s memory.
My respect — to the international community.
— The Architect
P.S. English is not my native language — I offer no apologies for stylistic imperfections. What you see here is not a post. It is a demonstration of another level of preparation: the symbiosis of human intuition and algorithmic precision. Mathematics and aggressive market analysis — against the machine of liquidations.

BTC — Price Slice. Capital Sector. 77761.66 BPC 10© Bolzen | The Architect | BPC Framework
Bolzen Market Institute
🏷 BTC — Price Slice. Capital Sector.
TradingView Publication Date: 10.01.2026
🏷 77761.66 — price not yet reached at time of publication.
🏷 BPC — The Bolzen Price Covenant — Strength Index: 10
Quantum structure of obligations and capital flow in price formation via energy blocks.
🏷 Vertical chart — Energy Grid Dashboard.
🏷 Static Stream 1: price published in energy-block production sequence.
🏷 The price energy block is already ordered—not by time, but by execution priority. Crucially: block priority dynamically reconfigures in response to hidden energetic impulses, whereas price execution order records their market manifestation. Every price in the dynamic stream is tied to proprietary energy-production metrics inaccessible to the general public. Those who perceive structure before its manifestation do not follow price—they anticipate it.
EΞ2Φ8Ψ45Θ·ζ⁻¹·106Λ732·Ω²
📎 Screenshot:
🏷 When trading from levels, use liquidity zones from BPC 10 and above.
🏷 Bolzen Liquidity Map — BTC (numerical equivalent):
🏷 In development — coming soon
🏷 I. Interactive Reference Guide: BPC — The Bolzen Price Covenant
🏷 P.S. English is not my native language — I offer no apologies for stylistic imperfections. What you see here is not a post. It is a demonstration of another level of preparation: the symbiosis of human intuition and algorithmic precision. Mathematics and aggressive market analysis — against the machine of liquidations.
The persistent ETH and BTC Energy Grid Dashboard remains publicly accessible and is intended for international institutional review.
— The Architect
BPC — The Bolzen Price Covenant

BTC — Price Slice. Capital Sector. 79023.21 BPC 10© Bolzen | The Architect | BPC Framework
Bolzen Market Institute
🏷 BTC — Price Slice. Capital Sector.
TradingView Publication Date: 10.01.2026
🏷 79023.21 — price not yet reached at time of publication.
🏷 BPC — The Bolzen Price Covenant — Strength Index: 10
Quantum structure of obligations and capital flow in price formation via energy blocks.
🏷 Vertical chart — Energy Grid Dashboard.
🏷 Static Stream 1: price published in energy-block production sequence.
🏷 The price energy block is already ordered—not by time, but by execution priority. Crucially: block priority dynamically reconfigures in response to hidden energetic impulses, whereas price execution order records their market manifestation. Every price in the dynamic stream is tied to proprietary energy-production metrics inaccessible to the general public. Those who perceive structure before its manifestation do not follow price—they anticipate it.
EΞ2Φ8Ψ45Θ·ζ⁻¹·106Λ732·Ω²
📎 Screenshot:
🏷 When trading from levels, use liquidity zones from BPC 10 and above.
🏷 Bolzen Liquidity Map — BTC (numerical equivalent):
🏷 In development — coming soon
🏷 I. Interactive Reference Guide: BPC — The Bolzen Price Covenant
🏷 P.S. English is not my native language — I offer no apologies for stylistic imperfections. What you see here is not a post. It is a demonstration of another level of preparation: the symbiosis of human intuition and algorithmic precision. Mathematics and aggressive market analysis — against the machine of liquidations.
The persistent ETH and BTC Energy Grid Dashboard remains publicly accessible and is intended for international institutional review.
— The Architect
BPC — The Bolzen Price Covenant

ETH — Price Slice. Capital Sector. 2365.10 BPC 11© Bolzen | The Architect | BPC Framework
Bolzen Market Institute
🏷 ETH — Price Slice. Capital Sector.
TradingView Publication Date: 29.12.2025
🏷 2365.10 — price not yet reached at time of publication.
🏷 BPC — The Bolzen Price Covenant — Strength Index: 11
Quantum structure of obligations and capital flow in price formation via energy blocks.
🏷 Vertical chart — Energy Grid Dashboard.
🏷 Static Stream 1: price published in energy-block production sequence.
🏷 The price energy block is already ordered—not by time, but by execution priority. Crucially: block priority dynamically reconfigures in response to hidden energetic impulses, whereas price execution order records their market manifestation. Every price in the dynamic stream is tied to proprietary energy-production metrics inaccessible to the general public. Those who perceive structure before its manifestation do not follow price—they anticipate it.
EΞ2Φ8Ψ45Θ·ζ⁻¹·106Λ732·Ω²
📎 Screenshot:
🏷 When trading from levels, use liquidity zones from BPC 10 and above.
🏷 Bolzen Liquidity Map — ETH (numerical equivalent):
🏷 I. Interactive Reference Guide: BPC — The Bolzen Price Covenant
🏷 P.S. English is not my native language — I offer no apologies for stylistic imperfections. What you see here is not a post. It is a demonstration of another level of preparation: the symbiosis of human intuition and algorithmic precision. Mathematics and aggressive market analysis — against the machine of liquidations.
🏷 PC-compatible international interactive link:
— The Architect
BPC — The Bolzen Price Covenant
