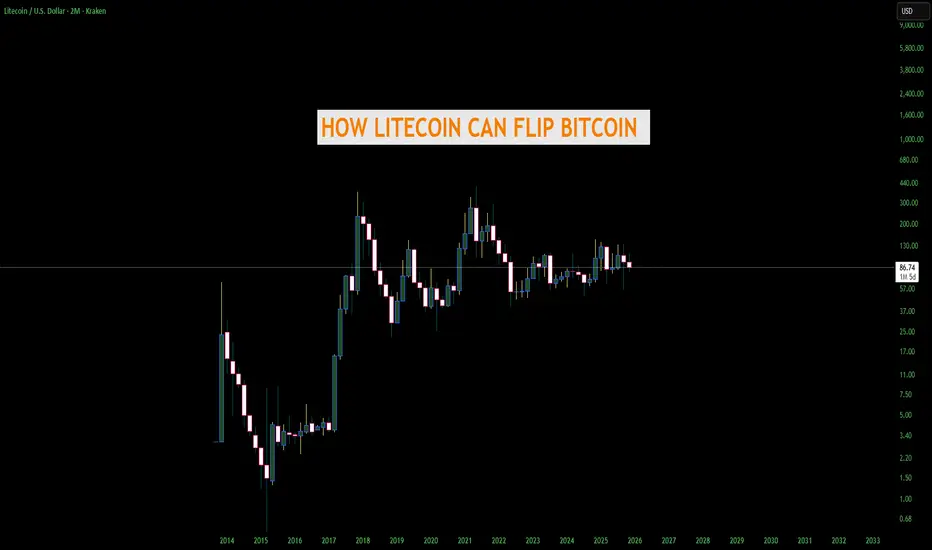
THE DAY LITECOIN FLIPS BITCOIN AND BECOMES #1 - AND HOWGrok helped me with this but regardless this is a great read. Not financial advice
1. Bitcoin fees explode again (> $50–$200 per transaction)
LTC stays under 5¢ and 4× faster → merchants & users flee to “digital silver” for actual payments
-Historical precedent: May 2017 & Dec 2017 fee madness → LTC pumped from $4 → $375 in weeks; repeated in May 2021 → $410 ATH
2. Bitcoin blocks stay full for months (Ordinals / Runes / BRC-20/ and now unlimited SPAM clog the chain again)
People rediscover Litecoin as the cheap, fast, on-chain alternative that actually works for daily spending
-Historical precedent: 2023–2024 Ordinals era → LTC quietly 3×–4× while BTC was practically unusable for small amounts
3. Major nation/state bans or heavily restricts Bitcoin mining or self-custody
LTC is smaller, less of a political target → miners add Scrypt rigs, capital rotates
-Historical precedent: China 2021 mining ban → Litecoin hashrate and price both spiked hard in the following months
4. A confirmed 51% attack or large double-spend actually happens on Bitcoin
Trust in BTC’s immutability shatters overnight → Litecoin (merged-mined with Dogecoin) suddenly has higher combined attack cost and looks safer
-Historical near-miss: 2018–2019 51% attack fears on smaller chains sent LTC up +150% in pure rotation plays
5. Credible quantum-break announcement or real progress scare (2026–2030 timeline moves up)
Litecoin’s MWEB addresses are already quantum-resistant + dev team can soft-fork faster than Bitcoin’s politics allow
-Historical precedent: 2023–2024 quantum FUD alone gave privacy coins and quantum-ready projects 3–10× pumps
6. Litecoin ETF (e.g., Canary Capital's) faces post-launch outflows or SEC-mandated tweaks due to BTC ETF dominance, while Bitcoin ETFs pull in record inflows
BTC ETFs become the unchallenged "institutional safe bet," capping BTC's retail upside → sidelined investors, retail traders, and altcoin funds rotate into the now-proven LTC ETF as the "next logical step" for legacy alts (with Canary/Grayscale already live and showing strong early volume)
-Historical precedent: ETH ETFs in 2024 saw initial outflows vs. BTC's inflows → ETH still 2–3×'ed on rotation; SOL's 2025 ETF launch pumped despite similar early teething issues
7. Lightning Network suffers major centralization scandals, hub failures, or routing collapses
People remember Charlie Lee’s original pitch: simple, fast, cheap, on-chain money with no layer-2 headaches
-Historical precedent: 2023–2025 Lightning UX complaints repeatedly drove spikes in LTC daily transaction volume and price
8. Bitcoin loses the “first-mover narrative” to a new nation-state adoption
Example: a major country (Brazil, Argentina, Indonesia, etc.) announces it will use Litecoin instead of Bitcoin for remittances or reserves because LTC is 4× faster and 100× cheaper.
-Precedent: El Salvador 2021 BTC adoption pumped Bitcoin; a “Litecoin country” would do the same or more for LTC.
9. PayPal, Venmo, Cash App, or Stripe re-activates Litecoin for instant zero-fee withdrawals/deposits
They all supported LTC years ago and dropped it only because of 2018 bear market. One click to flip it back on → instant 50–100 million new users.
-Precedent: PayPal adding BTC in 2020 → +300 % pump in weeks; LTC would explode harder because it’s actually usable on their rails.
10. Dogecoin merges fully with Litecoin (merged-mining → full auxiliary chain)
-Precedent: DOGE pumps in 2021 dragged LTC up 4–6× every single time. A real technical merger would be 10× stronger.
11. Major exchange or custodian loses billions in Bitcoin (think FTX 2.0 but only BTC exposed)
Users rush to self-custody the one big coin that still has sub-$0.01 fees and 2.5-minute confirmations → Litecoin.
-Precedent: FTX collapse 2022 → LTC was one of the only coins people could actually withdraw fast and cheap.
12. SEC or European regulator classifies Bitcoin as a “security” or “commodity with special rules” but explicitly says Litecoin is a commodity/currency
Institutions that were forced to sell BTC rotate the exact same thesis into LTC overnight.
-Precedent: XRP SEC case resolution in 2023 caused instant 3× pump; same mechanics.
13. Bitcoin Core development stalls or splits again (Blocksize Wars 2.0)
Big-blockers and users frustrated with ossification move money and hashrate to the chain that kept Charlie Lee’s original “faster, lighter” vision alive.
-Precedent: 2017 Bitcoin Cash hard fork → LTC price went parabolic as the “peaceful middle ground.”
14. Global remittance giants (Western Union, MoneyGram, Wise) quietly switch backend rails to Litecoin
They already tested LTC in 2017–2019. A single press release announcing “instant global transfers for pennies” using Litecoin would add billions in real volume.
-Precedent: Ripple/XRP partnerships in 2018 caused 10× pumps even when adoption was tiny. Real adoption would be insane for LTC.
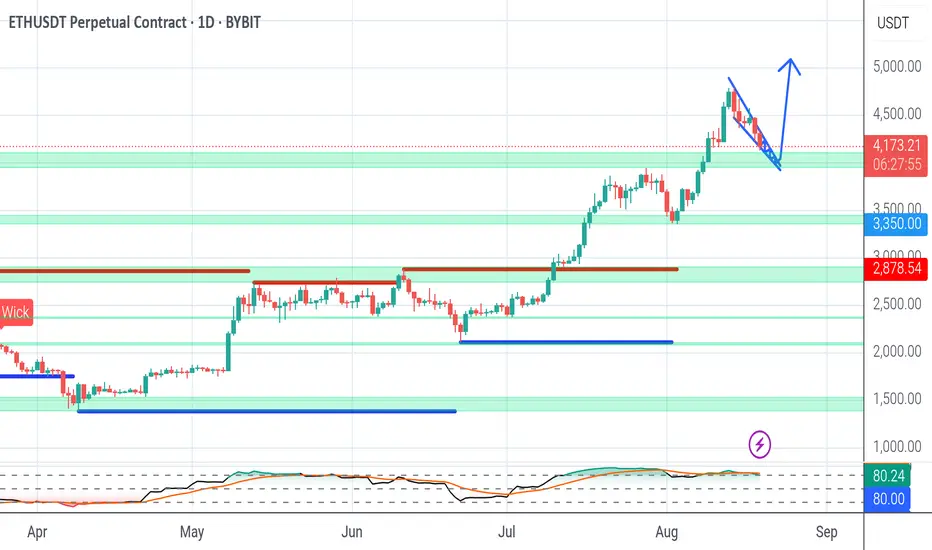
Eth-usdt
BTC Loses Structure — Risk of Falling Below $106KBitcoin has officially lost the low-time-frame structure, confirming the end of the previous uptrend zone.
Momentum has shifted to the downside, with sellers gaining control and price now approaching a critical breakdown level.
📉 Current outlook:
BTC remains under $112K, signaling continuation of short-term weakness.
The end uptrend zone around $109K failed to hold support.
Market structure shows potential continuation below $106K if no reversal occurs soon.
📊 Observation:
Buyers have not defended the local range, and repeated rejections near $116K confirm exhaustion of bullish strength.
The next liquidity pool sits below $106K, which could act as the next target zone in this downtrend sequence.
💬 Summary:
BTC has broken its short-term structure — the chart shows clear downside risk with potential move below $106K if pressure continues.

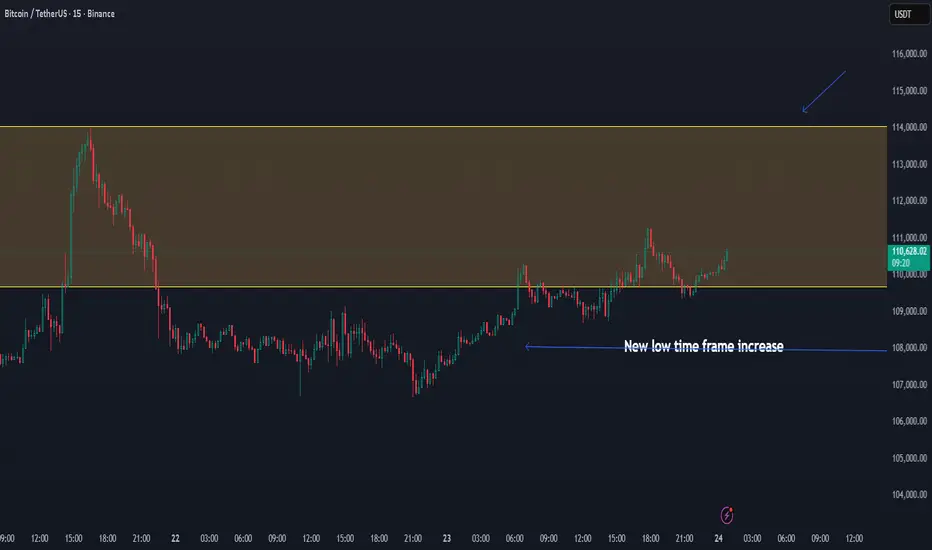
BTC/USDT — Positive Momentum Building, Eyeing Breakout To $114KBTC/USDT — Positive Momentum Building, Eyeing Breakout Toward $114K 🚀
Bitcoin continues to trade with strength after forming a new low-timeframe increase above the $108K level. This structural recovery confirms short-term bullish momentum, suggesting that BTC may now be ready to retest the upper range near $114K.
The consolidation inside this $108K–$114K range has created a stable base of support, while rising volume and sustained higher lows signal a potential expansion phase.
📊 Technical Overview:
Support: $108K
Range Resistance: $114K
Upside Target: $114K+
Bias: Positive / Bullish on short-term timeframe
If BTC maintains this momentum and confirms above $110K, the probability of a move toward $114K becomes increasingly strong — marking a continuation of the low-timeframe uptrend.
📈 Outlook: Positive momentum confirmed
🎯 Targets: $110K → $114K
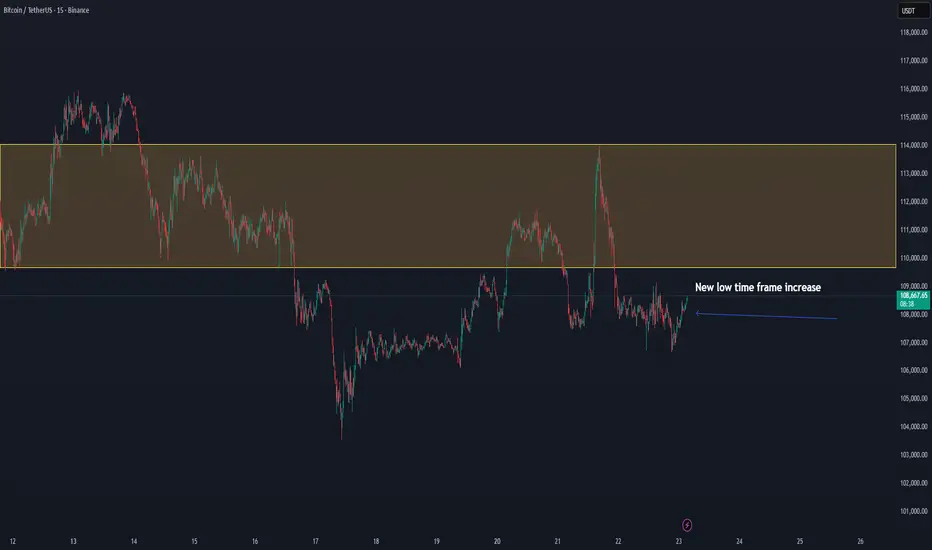
BTC/USDT — New Low-Timeframe Expansion Forming, Potential 114k+Bitcoin is beginning to show strength in the new low-timeframe structure, reclaiming the $108K zone with rising momentum. This confirms a short-term bullish shift after the recent consolidation.
The key resistance range between $110K–$114K remains the main obstacle, but if BTC maintains higher lows and continues to push within this structure, a move toward $118K becomes likely.
📊 Technical Overview:
Support: $106K–$108K
Range Resistance: $110K–$114K
Next Upside Target: $118K
Bias: Bullish on low-timeframe momentum
BTC’s ability to sustain above the $108K region suggests growing buyer confidence — confirmation above $110K could trigger continuation toward the upper range.
📈 Outlook: Low-timeframe expansion
🎯 Targets: $110K → $114K → $118K
ETH 2025 Price TargetBased on the chart structure and historical behavior, if we continue to move within a within a narrowing triangle, a strong breakout toward the 6K level seems very likely. You could even say it’s almost inevitable, but only if the Fed doesn’t inject new negative catalysts and capital doesn’t start exiting positions. Thanks to institutional investors steady accumulation, the 6K target remains highly probable.
Not financial advice.

usdt.d 30minHello friends
I am Mehdi, according to the Tether Dominance chart and the full targeting of the previous analysis in the 4-hour timeframe
According to the new analysis, I think the price is expected to reach the range of 4.49
1 Because the 4.57 level was broken with a strong candle in the 4-hour timeframe and now the price is rejecting this level
2 We are at the 382 fibo level
3 RSI divergence
Thank you for supporting me by liking and commenting and sharing this analysis

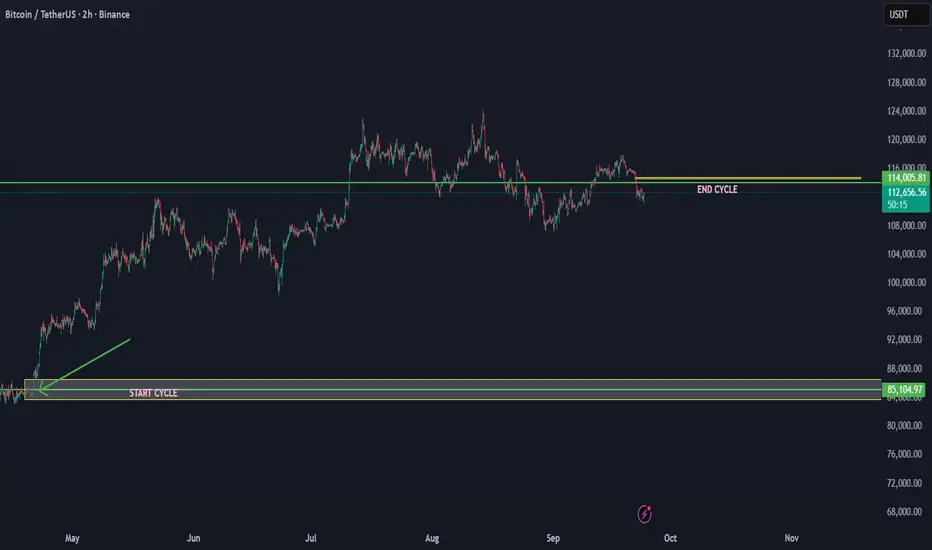
The BTC cycle that started at 84K is projected end at 114K This is a cycle update for BTC/USDT. Based on the cycle data, the cycle that started at 84K has ended at 114K. This indicates that we are now entering a new major trend breakdown in the cycle. It can take time, but when there is a new uptrend cycle, we will add.
This time frame and action made the end of the cycle that started from 84K
This could mean that btc can enter below 110K in the coming time. We have seen more times in the history of BTC that by the cycle end, the trend breaks down in steps.
ETH daily chart possible scenarioLooks like we heading towards 3900 strong support zone in coming days and bounce toward new ATH 5k+ in couple weeks. Any thoughts?
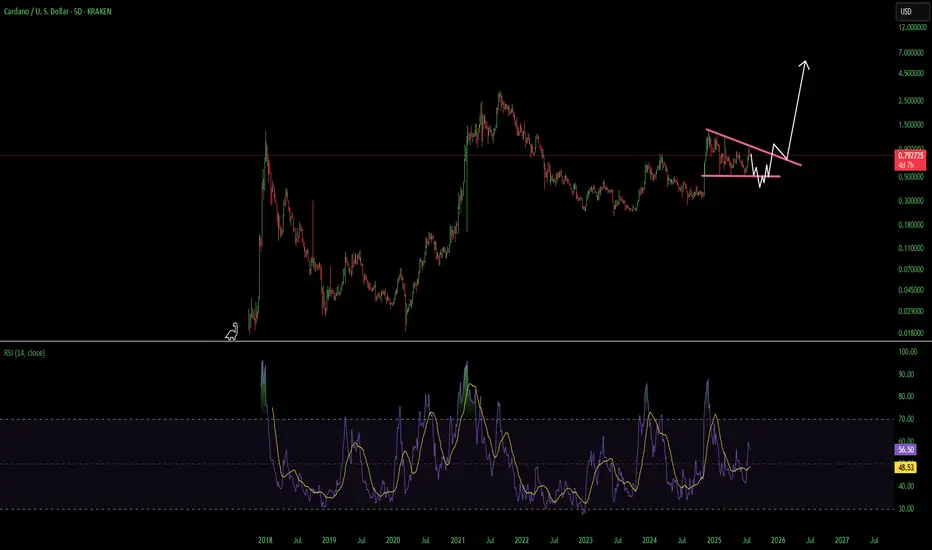
ADA Cardano Decsending Triangle Use Caution HereCardano had a heck of a move but i think its going to erase most if not all of it before it goes on its next leg up. A break over the overhead resistance line and finding support above would invalidate this. Not financial advice just my opinion. Thank you
Altseason is cancelled for now. But Should resume soon.If you're interested in altcoins, be sure to check out my ideas. I’m closely tracking CRYPTOCAP:BTC.D and CRYPTOCAP:OTHERS , and you’ll find plenty of valuable insights in those analyses.
So, what’s going on? My CRYPTOCAP:OTHERS prediction played out — May was bullish. But was it the real altseason? Not quite. The true altseason typically begins at the end of the Bitcoin cycle, and we’re not there yet.
Right now, we’re seeing price action reminiscent of December 2024. Bitcoin maximalists are aggressively buying BTC during a time it should be correcting, which is inflating BTC dominance and crushing any momentum for an altseason. They appear to be using altcoins as exit liquidity to pump BTC, especially as retail investors hesitate to buy Bitcoin above $100K.
What’s next?
The daily MACD suggests we’re entering a correction phase that could last around two weeks. A drop toward $1.2T is likely, as there's a major order block between the current level and that target. However, the real support lies below $900B — my "green box" — which I view as the ideal buy zone.
Historically, entries in this green box have offered 2x–3x returns on high-volatility altcoins from the top 100, especially in sectors like memes, DeFi, and AI.
I expect altcoins to correct into that zone in the coming weeks — keep an eye on it.
DYOR (Do Your Own Research).
#Crypto #Altcoins #Bitcoin #BTC #BTCdominance #Altseason #CryptoMarket #CryptoTrading #MACD #TechnicalAnalysis #DeFi #MemeCoins #AIcoins #AltcoinSeason #DYOR

ETH going up... 🚀 ETH/USDT Current Analysis 🚀
Ethereum (ETH) is currently trading around $2535. The ongoing bullish trend suggests potential target levels at $2780 and $2900.
🔄 However, a corrective phase is anticipated, which could pull the price back towards $2290 and $2120.
📈 In the long term, our price targets are set at $3200, $3800, and $4500.
Always exercise caution in the cryptocurrency market and stay informed about the latest developments! 💹
#Ethereum #ETH #Crypto #Investment

ETH - Long trade Simple set up
Trade the channel. I have entered long at the bottom of the channel with the exit plan being the top of the range.

XRP Brief scenarioHi Traders,
This is my trading scenario.
Hope it can help you for your trading strategy.
Make sure this is just scenario. please plan your own trading strategy too.
Waiting is most important key to be a long term trader.
Emotion is just biological reaction from your hormone, memory and body.
Good luck.

Ethereum: Momentum Fueled by Growth and AdoptionEthereum: Momentum Fueled by Growth and Adoption
Ethereum (ETH) continued its upward trend over the past week, closely following
Bitcoin’s rally. The second-largest cryptocurrency by market capitalization is benefiting from a range of factors that reinforce its position as a leader in the blockchain space. With strong fundamentals, expanding use cases, and favorable seasonal trends, ETH’s price growth appears poised to continue.
Adoption and Network Usage
The growing adoption of Ethereum for a wide range of applications—ranging from decentralized finance (DeFi) to enterprise solutions—is a key driver of its rising value. Ethereum’s robust and versatile network continues to attract developers, businesses, and users, solidifying its role as the backbone of the blockchain ecosystem.
The Rise of DeFi and NFTs
The expansion of decentralized finance (DeFi) platforms, which leverage Ethereum’s smart contract capabilities, has created new opportunities for decentralized lending, borrowing, and trading. Simultaneously, the ongoing popularity of non-fungible tokens (NFTs) keeps Ethereum at the forefront of digital ownership and creative innovation.
Network Upgrades and Transaction Fee Burning
Technological improvements, such as Ethereum’s transition to proof-of-stake through the Merge, enhance network efficiency and sustainability. Additionally, the implementation of EIP-1559 introduced the burning of transaction fees, effectively reducing the supply of ETH and creating deflationary pressure, which can drive long-term price appreciation.
Institutional Investment and Ethereum ETFs
Institutional investors are increasingly entering the Ethereum market, driven by its utility and growth potential. One of the major catalysts has been the launch and increasing inflows into Ethereum-based ETFs, which provide a regulated and convenient way for institutional and retail investors to gain exposure to ETH. These inflows not only validate Ethereum’s role as a leading crypto asset but also contribute directly to its demand and price growth.
Seasonality and Market Momentum
Historically, the second half of December has often been a favorable period for cryptocurrency markets, including Ethereum. Factors such as increased trading activity, end-of-year portfolio adjustments, and overall market sentiment have historically supported upward trends during this time. Ethereum seems well-positioned to benefit from this seasonal tailwind, potentially pushing its price toward new highs.
Competition and Ecosystem Growth
Ethereum faces competition from other blockchain platforms, but its first-mover advantage, coupled with continuous innovation, helps it maintain a dominant position. The ecosystem of ERC-20 tokens—built on the Ethereum network—further strengthens its utility and value proposition.
Market Sentiment and Macroeconomic Factors
Positive market sentiment and media coverage contribute to Ethereum’s momentum. Broader macroeconomic factors, such as inflation and economic uncertainty, are also driving investors to explore alternatives like Ethereum as a hedge and growth asset.
Infrastructure and Partnerships
The continued development of infrastructure, including wallets, exchanges, and DeFi tools, makes Ethereum more accessible to users and investors. Strategic partnerships and collaborations within the blockchain space are also expanding Ethereum’s reach and utility.
Conclusion
Ethereum’s price growth is underpinned by a combination of strong network fundamentals, expanding use cases, increasing ETF inflows, and favorable seasonality. From DeFi and NFTs to network upgrades and institutional interest, Ethereum is positioned to continue its upward trajectory as we move into the traditionally bullish second half of December.
Will Ethereum leverage these advantages to reach new price milestones? Share your views and insights in the comments!

BTC brief move 1hMITIGATION
FVG
CHOCO
OVER BOUGHT
Please set stop loss always
There is always next opportunity
Confirmation check
3 RULES
Buy
Sell
Wait
FOLLOW YOUR TRAIND SYSTEM FOR LONG RUN

Market volatilityMarket volatility chart for general market direction slowing down.
Looks like Soon or later BTC will go sideway then will find out what is next direction.
Please keep an eye on volatility corresponding to market move.

My expectation from Ethereum (Bullish)#ETH seems to be in an ascending channel. I recommend to buy weekly.

ETHUSDT.1DAnalyzing the ETH/USDT chart on a daily timeframe, we see a volatile and somewhat bearish trend emerging over the past few months. Here's a detailed breakdown of the chart, highlighting key resistance and support levels, along with insights from the MACD and RSI indicators.
Key Observations:
Trend Analysis: Ethereum has displayed a series of lower highs and lower lows since peaking, indicating a bearish trend. The trendline (R1) has consistently acted as a resistance, and the price is currently testing this line, suggesting a critical juncture.
Support and Resistance Levels:
Resistance Levels (R2 and R3): R2 at $3,043 and R3 at $4,105.80. These levels represent potential upside barriers in the event of a price reversal.
Support Level (S1): The significant support level is at $2,126.90. This level has historical relevance as a pivot point for price actions.
MACD Indicator: The MACD line is currently below the signal line and both are trending downward below the zero line, which traditionally indicates bearish momentum. However, the histogram suggests that the negative momentum is slowing, possibly pointing to an impending stabilization or reversal.
RSI Indicator: The RSI is around 36, which is nearing the oversold territory. This could indicate that the selling pressure might soon exhaust, offering potential for a bullish reversal if other factors align.
Technical Analysis and Conclusion:
The Ethereum market appears to be at a critical stage. The proximity to the major support at S1 and the nearing oversold conditions suggest that we could see a short-term reversal if the support holds. Investors and traders should watch for any bullish reversal patterns or a break above the trendline R1 as potential signs of a change in momentum.
However, a break below the support at $2,126.90 could lead to further declines, with the potential to test much lower levels, given the absence of immediate visible support below S1 on the chart.
Trading Strategy:
For Bullish Traders: Look for confirmation of a support hold at S1 and a potential bullish reversal pattern or a break above R1. If entering a long position, consider setting stop-loss orders below S1 to manage risks.
For Bearish Traders: Monitor for a sustained break below S1. If this occurs, consider entering short positions with a view to capitalize on further declines. Place stop-loss orders just above the most recent highs to limit potential losses.
As always, it's crucial to consider external factors such as market news, overall crypto market trends, and economic indicators that could influence Ethereum's price movements. Stay updated and adjust strategies accordingly.

Bitcoin Reversal After Hitting Demand AreaIn my two most recent BTC analyses I talked about an ideal area for entry in case BTC reversed from the top yellow resistance of the channel it has been trading in for 6 months at this point.
As expected, the green area on the chart has functioned as a huge area of demand, right in between the supports (yellow and purple). The drop was a bit more steep than initially anticipated due to a big sell-off in the stock markets, but the reversal is here nevertheless.
At this moment it's still unclear whether BTC will find its way up all the way towards the top of the channel yet again. The daily shooting-star wick suggests that bulls took over in the short-term, however.
As mentioned in previous analyses, BTC is currently trading in a longer term grey zone. I'm bullish above the top yellow resistance and bearish below the bottom purple support. It's not the time for long-term longs or shorts, in my view.
Remember my last ETH analysis where I talked about the initial bearish shock after the spot ETF approval (we saw the same with the BTC spot ETF). If the BTC ETF is any indication, we will enter a long-term trend from here.

ETHUSDT.1DIn my analysis of the Ethereum (ETH/USDT) daily chart, I've identified key technical elements that are crucial for understanding the current market dynamics. Firstly, it's important to note the failure of the Ichimoku calculation, which may necessitate reapplication or adjustment for a clearer analysis.
The Moving Average Convergence Divergence (MACD) shows a strong bearish momentum, indicated by the significant separation between the MACD line and the signal line, with the histogram trending downward. This suggests that the selling pressure has been increasing, potentially leading to further declines if not reversed soon.
The Relative Strength Index (RSI) is currently at 37.42, which is below the midline of 50 but not yet in the oversold territory (below 30). This positioning indicates that while there is bearish momentum, there might be room for further downward movement before the market is technically considered oversold.
From the price action, we observe that ETH has recently broken below the support level at $3,043, now acting as resistance (R1). This breakdown could signal a continued bearish trend towards the next support level (S1) at $2,126.90. If this level fails to hold, the decline could extend further, potentially testing much lower supports.
For potential recovery scenarios, ETH would need to reclaim and stabilize above $3,043 to alleviate immediate bearish pressure. A move above this level could open the path towards the next resistance at $4,105.80 (R2). However, given the current market conditions indicated by the MACD and RSI, such a bullish reversal might require significant volume and positive market catalysts.
In conclusion, the current technical setup suggests caution for ETH traders, with an emphasis on monitoring the $2,126.90 support level closely. A break below this could lead to significant losses, while a recovery above $3,043 might signal a short-term bullish reversal. As always, it's crucial to consider external market factors and news that could influence price movements beyond what technical indicators alone can predict.

#ETH/USDT#ETH
Ethereum price is moving in a descending channel on the 1-hour frame
The price is moving inside the channel perfectly, it is expected after a slight rise
Then the decline will continue to fill the price gap with a target of 2700
The market is expected to recover after that after filling the price gap
This decline is affected by the geopolitical events happening these days
The pattern is canceled in the event of a 4-hour close above 3200
