Accumulation Before Expansion or Breakdown Into Liquidity?Hello traders! Here’s a clear technical breakdown of BTCUSD (1H) based on the current chart structure.
Bitcoin previously delivered a strong bullish impulsive move, establishing clear upside momentum and pushing price into premium territory. Following the peak, the market transitioned into a corrective phase, marked by controlled selling pressure and a gradual loss of bullish momentum rather than panic distribution.
The recent decline brought price back toward a key structural support, where selling pressure has noticeably slowed. Current price action is showing compression and stabilization, suggesting the market is deciding between continuation of the broader bullish trend or a deeper corrective leg.
Major Support / Demand Zone:
The 90,700–91,000 area is a strong support zone, where price has repeatedly reacted and volume has increased. This zone also aligns with previous consolidation and acts as a structural pivot for the broader trend.
Liquidity Range Below:
Below current price sits a liquidity-rich zone near 86,900, corresponding to the prior accumulation range. A breakdown into this area would indicate acceptance of lower prices and a shift toward a bearish continuation phase.
Overhead Resistance Levels:
If price holds support, upside targets are layered at:
- 92,200 – first structure resistance
- 93,200 – prior reaction high
- 94,400–94,800 – major liquidity and range high
These levels define the bullish roadmap if support holds.
Currently, BTC is trading directly on top of a strong support level, with price holding above the EMA and failing to extend lower despite prior sell pressure. This behavior often reflects absorption by buyers, rather than aggressive sell-side continuation.
The market is compressing, not accelerating typically a precursor to expansion.
As long as Bitcoin holds above the 90,700–91,000 support zone, the broader bullish structure remains valid. In this case, current price action can be treated as accumulation after correction, with potential for a push toward 92,200, followed by continuation into the 93,200 and 94,400+ resistance zones.
However, a decisive hourly close below support, followed by acceptance, would invalidate the bullish continuation thesis. That scenario would likely send price into the previous accumulation area near 86,900, confirming a deeper corrective or trend transition phase.
For now, support is holding but it must be respected, not anticipated.
ETH

EURUSD Breakdown Confirmed — Sellers Remain Firmly in ControlEURUSD on the H1 timeframe continues to respect a clear bearish market structure, with price consistently printing lower highs and lower lows. The broader trend remains firmly to the downside, reinforced by sustained trading below the EMA 50, which is acting as dynamic resistance.
The recent price action shows a textbook sell the rally behavior. Each corrective bounce into previous supply zones has been met with strong rejection, forming a sequence of bearish consolidation boxes that ultimately resolve lower. This confirms that sellers are actively defending value areas and distributing positions on pullbacks.
Price has now broken and held below the 1.1670 structure level, confirming a continuation of bearish momentum rather than a false break. The current consolidation around 1.1640–1.1650 appears to be a pause before the next leg down, not a reversal signals.
Momentum indicators also support the bearish bias, with downside pressure remaining dominant and no meaningful bullish divergence present. As long as price remains capped below prior supply zones, the path of least resistance stays to the downside.
Bearish scenario (preferred): As long as price holds below 1.1670, continuation toward the 1.1620 liquidity zone is likely. A confirmed breakdown below this area opens further downside toward 1.1600–1.1580.
Bullish invalidation: Only a strong reclaim and acceptance back above 1.1700, with a structural shift, would invalidate the bearish continuation setup.
Overall, EURUSD remains in a controlled bearish expansion phase. Patience and discipline are key the highest-probability opportunities continue to favor selling pullbacks, not attempting to catch bottoms.

Ethereum Breaks Descending Structure — Is a Fresh Bullish Leg UnEthereum (ETHUSD) on the H1 timeframe is showing a notable shift in short-term structure after breaking cleanly above a well-defined descending trendline. This trendline had capped price throughout the recent corrective phase, so the breakout signals that bearish momentum is fading and buyers are beginning to regain control.
The prior move down now appears corrective within a broader bullish context rather than the start of a trend reversal. Price has formed a higher low after the breakout and is stabilizing above the 3,080–3,100 support zone, confirming this area as a key demand base and structural pivot.
With the trendline broken, the market is transitioning from sell-the-rally behavior into a potential buy-the-dip environment, provided price continues to hold above the breakout area.
Overhead, ETH faces a sequence of clear resistance levels that will define the strength of any continuation:
- 3,180 – first reaction and intraday structure resistance
- 3,260 – prior consolidation high and liquidity magnet
- 3,300–3,320 – major resistance and key upside objective
Bullish: As long as price holds above 3,080–3,100 and respects the broken trendline, continuation toward 3,180, then 3,260, becomes likely. Acceptance above these levels opens the path toward 3,300+.
Bearish: A failure to hold above the breakout zone and a sustained move back below 3,080 would invalidate the bullish shift and suggest a return to range or deeper correction.
At this stage, Ethereum is at a post-breakout validation phase. Patience is key the highest-probability opportunities come from holding above the broken trendline or clean continuation through resistance, not from chasing price mid-structure.

ETH/USDT – 4H Chart Update. ETH/USDT – 4H Chart Update
ETH is trading inside a descending trendline + rising support, forming a compression zone. The price has started to respect higher lows, indicating an improving structure.
The descending trendline near 3,200–3,250 remains the main hurdle.
Trendline support and moving averages are holding around 3,050–3,100.
Confirms bullish continuation, with upside expansion toward 3,400–3,700.
As long as the price holds above the rising support, the bullish setup remains valid.
Would delay the breakout and shift ETH into short-term consolidation.
ETH is in a pre-breakout phase. Structure favors bulls, but confirmation comes only with a clean breakout above the descending trendline. Manage risk until direction is confirmed.

Bearish reversal off overlap resistance?Ethereum (ETH/USD) is rising towards the pivot and could reverse to the overlap support that aligns with the 61.8% Fibonacci retracement.
Pivot: 3,390.47
1st Support: 2,725.92
1st Resistance: 3,838.62
Disclaimer:
The opinions given above constitute general market commentary and do not constitute the opinion or advice of IC Markets or any form of personal or investment advice.
Any opinions, news, research, analyses, prices, other information, or links to third-party sites contained on this website are provided on an "as-is" basis, are intended to be informative only, and are not advice, a recommendation, research, a record of our trading prices, an offer of, or solicitation for, a transaction in any financial instrument and thus should not be treated as such. The information provided does not involve any specific investment objectives, financial situation, or needs of any specific person who may receive it. Please be aware that past performance is not a reliable indicator of future performance and/or results. Past performance or forward-looking scenarios based upon the reasonable beliefs of the third-party provider are not a guarantee of future performance. Actual results may differ materially from those anticipated in forward-looking or past performance statements. IC Markets makes no representation or warranty and assumes no liability as to the accuracy or completeness of the information provided, nor any loss arising from any investment based on a recommendation, forecast, or any information supplied by any third party

BRIEFING Week #2 / Happy New Year !Here's your weekly update ! Brought to you each weekend with years of track-record history..
Don't forget to hit the like/follow button if you feel like this post deserves it ;)
That's the best way to support me and help pushing this content to other users.
Kindly,
Phil

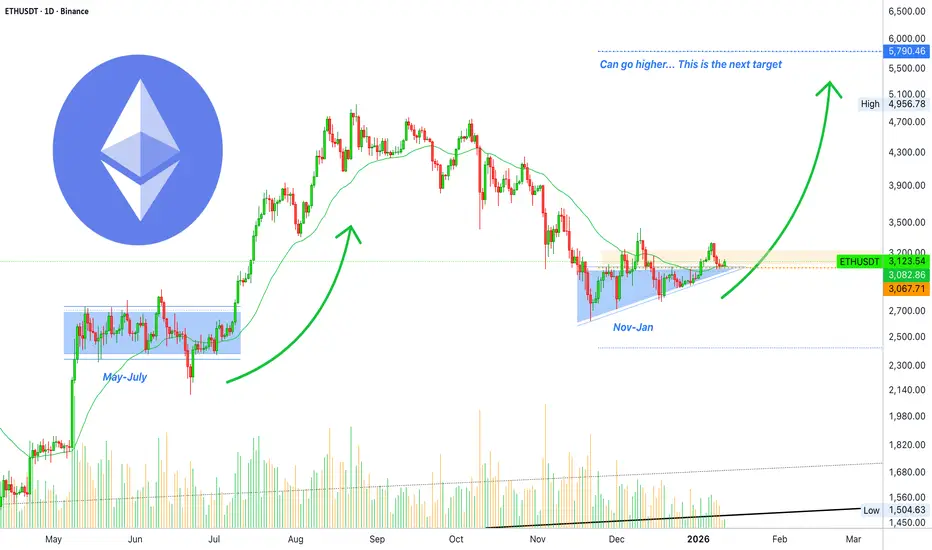
Bullish resumption starts now —Ethereum is going up!Hello my dear reader, I hope you are having a lovely weekend and things are great for you. The market is surely to support your doing good right now and it gets better next week and all through early 2026. We have the support of the market—Crypto.
Ethereum has been rising (fighting) through a recovery since 21-November. We saw some action even some excitement but not much more. The last high ended as a lower high compared to 10-December but even with this bearish signal I continue to predict for you, additional growth.
Ether now closed four days red, nothing much. The action continues to happen above EMA34. This level first conquered as resistance and now confirmed as support.
Early July 2025 it was the same. The action hovered around EMA34 as the market was consolidating. The result was the continuation of the bullish wave. This time, we get a resumption and we can say, yes! It seems to be happening today. At least, this is the start.
Next week... Do we start green right away?
Ethereum is now rising above $3,000, you know, a major level. Trading above $3,100, still pretty early and slow. No volume at all. How to interpret these signals? Easy of course.
The main low 21-November 2025 was $2,623. The last peak was $3,447. The action is happening much closer to resistance vs support. The action is a recovery based on the November rise. Since we are neutral now, the same conditions as before the neutral period valid remains. This means that we are bullish and a continuation is set to develop. That's my interpretation of the chart and signals at this point.
No bearish action is bullish action. When the market was bearish, four consecutive days red after a lower high would definitely cover lots of ground and even produce a new low. This isn't the case anymore. Four days red did nothing, and that's because the bears are gone. Sellers are gone. Tomorrow we get a resumption. Ethereum is going up!
Namaste.
$ETH 1W: Zoomed out thoughts On the weekly, ETH still looks structurally constructive, but it’s very clearly in range rather than trend right now.
Price is sitting back in the middle of a large multi-year range, roughly bounded by the ~$2,000 area on the downside and ~$4,700 on the upside. The recent pullback from the highs did not break the broader structure, but it also failed to establish acceptance above resistance, which is why ETH has slipped back into chop.
The $3,000–3,100 region is acting as an important short-term pivot. Holding above this area keeps ETH neutral-to-bullish from a higher timeframe perspective. A loss of this level would likely open a deeper retrace toward $2,700 and potentially the $2,000–2,100 region, which remains the most important higher timeframe demand zone on the chart.
What’s constructive is that the prior low near $2,000 was aggressively bought and led to a strong impulse toward the top of the range. That tells me higher timeframe buyers are still active. What’s missing right now is follow-through and expansion above resistance. Until ETH can reclaim and hold above $3,500–3,600, upside moves are still best viewed as range rotations rather than trend continuation.
The projected path on the chart highlights what usually happens in these environments: chop, higher lows, and frustration before a real expansion. If ETH can continue to base above $3,000 and eventually reclaim $3,500, the odds shift toward a push back to the $4,700 range high. If not, more time and rotation inside the range should be expected.
In short, ETH looks healthy but unresolved. This is not a breakout market yet, and it’s not a breakdown either. It’s a classic higher timeframe range where buying dips has historically worked better than chasing strength, until price proves it can escape the range and hold.

ETHEREUM: Historical and Huge Triangle, +300% Breakout Incoming!Hello There,
welcome to my new analysis about Ethereum from a broader timeframe perspective. Although there are still crucial bearish signs on the local timeframe, which should not be underestimated, the longer-term perspective is rather differentiated. Before moving into this dynamic, it should be said that Ethereum did not break its established trend since 2020. The price action of Ethereum managed to form several higher highs within the structure. Now, there is a major underlying formation that could be the origin of historical price moves.
As when looking at my chart, we can watch Ethereum solidly stabilize within this major range between $1000 and $3000. The $1000 mark is a highly important psychological support level. Above this level, Ethereum is now continuing to finalize this gigantic ascending triangle formation. Within this formation, Ethereum is developing a crucial wave count, of which waves A and B have already formed. Now it is continuing to complete the wave C within this whole structure. Within the local frame of the wave C, Ethereum is forming a bear flag within the descending channel.
Once the price action reaches the lower boundaries of the gigantic triangle formation, there are major underlying supports. Also determined by the 100-EMA marked in green and the 50-EMA marked in blue. Once Ethereum reaches out to these zones, there is a bounce and stabilization highly likely. Especially when the whole wave count from A to C has finalized, this will confirm the origin of a stable bounce within this area. In this case it is highly necessary that Ethereum does not break below the lower boundary because this could invalidate the triangle.
For now it seems as though there will be no such invalidation. Once Ethereum has the ability to break out above the upper boundary of this huge triangle, it will confirm the continuation setup. In this case a mere 300% bounce and expansion into the bullish direction is highly likely. As seen in my chart, the bullish targets will be active once Ethereum has completed the whole triangle formation. Also, there are other factors that make such a price action likely, such as the growing institutional adoption. Besides, Ethereum reached record-high stablecoin transfers of over $8T.
The next times will be extremely decisive, and everything depends on how the environment of Ethereum continues to develop. This will be extremely important for the forthcoming of the whole formational structure. In any case, the historical and influential price changes should not be underestimated in any case.
With this being said, it is great to consider the important trades upcoming.
We will watch out for the main market evolutions.
Thank you very much for watching!

The plan for ETH is the same as for BTC.All areas for work are marked. The air conditioner can make another pass, but it is also overheating. Be careful.
BINANCE:ETHUSDT.P

Ethereum Going Crazy [12-16 Jan,m 2026]Weekly analysis for the markets focusaing on the Ethereum, also include:
EURUSD
GBPUSD
GBPNZD
NZDUSD
BTC
S&P500
FTSE100
CAC40
SUI40

Ethereum Stuck Below Trendline — Bearish Pressure Price is continuing to respect the descending trendline and trading below the EMA, confirming a sustained bearish market structure. Recent bullish attempts have failed near the trendline, showing clear seller defense and lack of upside follow-through.
As long as price remains capped below 3,140–3,160, any bounce is likely corrective and vulnerable to renewed selling pressure.
A bearish continuation below 3,100 keeps downside targets active toward 3,050 → 3,000, with a deeper liquidity objective near 2,970–2,960. Only a decisive breakout and close above the descending trendline would invalidate the bearish scenario and signal a potential trend shift.

Ethereum Breaks Trendline — Bears Take Control Below Key SupportPrice has confirmed a bearish break of the rising structure, failing to hold above the EMA and respecting the descending trendline as new resistance. Recent pullbacks into the trendline are being sold, signaling strong seller control.
As long as price remains below 3,150–3,170, any bounce is likely corrective rather than a reversal. A brief push toward the trendline may occur but is expected to attract fresh selling pressure.
Sustained weakness below 3,100 exposes downside liquidity toward 3,060, with a deeper target near 3,000–2,980. Only a decisive breakout and close above 3,240 would invalidate the bearish scenario and signal a shift back to bullish momentum.

Ethereum Slips: Distribution Phase or Setup for a Higher Low?Ethereum on the H1 timeframe has transitioned from a clean bullish expansion into a corrective bearish structure after failing to sustain momentum near the recent highs. The prior series of consolidation boxes highlights a clear stair-step advance, but the loss of bullish follow-through at the top marked the beginning of distribution, followed by a decisive break into a descending channel.
Price is currently trading within this downward-sloping channel, respecting both the upper and lower boundaries with consistent lower highs and lower lows. The recent bearish impulse pushed ETH back toward the 3,100 area, a level that previously acted as a reaction zone during the earlier consolidation phase. This suggests the market is revisiting prior liquidity rather than entering an immediate trend reversal.
As long as price remains capped below the upper boundary of the descending channel, the corrective structure stays intact. Any short-term rebound from current levels is likely to be corrective in nature, potentially rotating back toward the mid-channel region where selling pressure may re-emerge. Failure to reclaim and hold above the channel resistance keeps downside risk active.
If selling pressure resumes, ETH could extend lower toward the 3,000 psychological level and potentially deeper into the 2,900 region, where the lower channel boundary aligns with a larger liquidity pool. Such a move would represent a deeper correction within the broader structure rather than confirmation of a full bearish trend shift, provided higher-timeframe support remains intact.
Alternatively, a strong bullish reaction from current levels followed by a clean break and acceptance above the descending channel would invalidate the bearish corrective scenario. In that case, Ethereum could transition back into expansion mode, targeting higher resistance zones and resuming its broader bullish trajectory.

Ethereum at Key Demand — Smart Money Accumulation Price is holding firmly inside a well-defined demand zone around 3,050–3,080, where sell-side liquidity has already been swept and downside momentum is clearly slowing. The current consolidation suggests accumulation rather than continuation lower.
A strong hold above the demand zone favors a bullish recovery toward the 3,150–3,180 liquidity range, which acts as the first upside checkpoint.
If price reclaims and holds above 3,200, bullish momentum could accelerate toward the supply zone at 3,280–3,320, with a potential extension toward 3,350+. As long as price remains above 3,050, the upside scenario remains the primary focus.

ETHEREUM FREE SIGNAL|LONG|
✅ETHUSD is reacting from a discounted ICT demand zone after a strong bullish displacement. Smart money accumulation is evident, with mitigation holding and price expected to expand higher toward resting buy-side liquidity above recent highs.
—————————
Entry: 3,063
Stop Loss: 3,020
Take Profit: 3,135
Time Frame: 8H
—————————
LONG🚀
✅Like and subscribe to never miss a new idea!✅

Are Lower Highs Setting Up a Deeper Sell-Off?Hello traders! Here’s a clear technical breakdown of ETHUSD (1H) based on the current chart structure.
Ethereum has transitioned from a previously bullish environment into a clear bearish market structure, defined by a sequence of lower highs (LH) and lower lows (LL). After failing to sustain price above the recent swing highs, sellers stepped in aggressively, forcing a breakdown through multiple structure levels.
The sharp impulsive move lower confirms bearish momentum, while subsequent pullbacks have remained corrective, consistently forming lower highs beneath prior support now acting as resistance. This price behavior reflects a market that has shifted control decisively to sellers.
Key Supply / Structure Resistance:
The 3,130–3,150 region now acts as a critical supply zone, where previous support was broken and sellers have defended retracement attempts. This area is also aligned with the EMA, reinforcing bearish pressure.
Intermediate Resistance:
The 3,090–3,100 level represents a minor structure cap. Any pullback into this zone that fails would likely form another lower high.
Major Downside Demand / Liquidity Target:
The 3,020 area is the next significant demand zone, aligning with projected structure continuation and liquidity resting below recent lows.
Currently, ETH is trading after printing a fresh lower low, placing the market in continuation mode rather than exhaustion. Price is attempting a minor bounce, but as long as retracements remain capped below supply, this move should be treated as bearish corrective price action.
Momentum remains with sellers unless structure is reclaimed.
As long as Ethereum remains below the 3,130–3,150 supply zone, the bearish structure stays valid. Any pullback that stalls below this area is likely to form a lower high, opening the door for continuation toward the 3,020 demand zone and potentially lower if sell-side momentum accelerates.
A structural invalidation would only occur if price reclaims and holds above the broken resistance with strong bullish acceptance. Until then, rallies should be viewed as sell-side corrective moves, not reversals.
For now, the trend is down and controlled by sellers.

Will ETH Defend This Final Support???????????Ethereum has completed a full bullish expansion cycle and is now trading in a post-distribution corrective phase on the H1 timeframe. After a strong impulsive rally supported by a clean EMA trend, price topped into a well-defined resistance zone, where buying pressure failed to sustain continuation.
Since that peak, ETH has printed a sequence of lower highs and lower lows, confirming a short-term bearish structure. The recent sell-off is impulsive rather than corrective, indicating that this is not just a shallow pullback but a deeper structural reset following distribution.
Price is now approaching a major support zone, which previously acted as a strong demand base during the prior bullish leg. This area also aligns with the flattening EMA curve, suggesting the market is reaching a key decision point.
Importantly, bearish momentum is starting to decelerate as price approaches support, increasing the probability of a technical reaction or corrective bounce, rather than immediate continuation lower.
Resistance:
3,280 – 3,320 (distribution / major supply zone)
Support:
3,060 – 3,100 (key structural demand)
Below this zone risks continuation into a broader bearish leg
➡️ Primary Scenario:
Price holds above the 3,060–3,100 support zone and forms a higher low. A bullish reaction from this area would likely trigger a corrective recovery toward the 3,200 level first, followed by a potential extension into the 3,280–3,320 resistance zone. This move would be classified as a corrective rally, not an immediate trend reversal.
⚠️ Risk Scenario:
A clean breakdown and acceptance below the support zone would invalidate the bounce setup. In that case, ETH could accelerate into a deeper bearish continuation, opening the path toward lower untested demand levels.

Healthy Pullback or Trend Breakdown? Market Context & Structure
BTC has delivered a strong impulsive rally, shifting market structure decisively bullish on the H1 timeframe. After the vertical expansion, price is now transitioning into a corrective phase, consolidating between a clearly defined resistance zone above and a higher demand area below. This behavior is typical of post-impulse digestion rather than trend failure.
Despite recent volatility and sharp wicks, the broader structure remains constructive as long as price continues to respect higher lows. The current price action reflects a battle between short-term profit-taking and medium-term trend continuation.
Technical Confluence
Price is currently trading between the rising EMA cluster, which continues to act as dynamic support, and a supply-heavy resistance zone where selling pressure previously emerged. The fast EMA has started to flatten, while the slower EMA remains positively sloped, suggesting momentum cooling but not yet reversing.
The highlighted support zone aligns closely with EMA support and prior breakout structure, reinforcing it as a key area for buyers to defend if the bullish trend is to remain intact.
Key Levels
Resistance:
94,400 – 94,900 (supply / rejection zone)
Support:
91,300 – 91,700 (demand zone)
90,400 (major horizontal support)
EMA / Dynamic Level:
EMA cluster around 92,000–92,400
Scenarios
➡️ Primary Scenario:
Rejection from the resistance zone leads to a controlled pullback into the 91.3k–91.7k support area. If price forms a higher low and shows bullish reaction within this zone, continuation toward the 94.8k resistance — and potentially a breakout toward 96k+ — becomes the higher-probability outcome.
⚠️ Risk Scenario:
A clean breakdown below the support zone with acceptance under the EMA cluster would invalidate the bullish continuation setup. In that case, downside extension toward the 90.4k level is likely, signaling a deeper corrective phase rather than a shallow pullback.

Ethereum Breaks Structure — Is This the Start of a Deeper SellPrice has broken below the key support around 3,120–3,130, confirming a short-term bearish shift after failing to hold above the moving average cluster. Momentum is now favoring sellers as prior support turns into resistance.
A pullback toward 3,130–3,160 is likely to be corrective and may offer selling pressure if price fails to reclaim structure.
Sustained weakness below 3,100 opens the path toward 3,060–3,040, with a deeper liquidity target near 2,980–2,920. A strong reclaim and close back above 3,180 would invalidate the bearish setup and signal stabilization.

Bitcoin Is Building a Base — Accumulation Before the Next Push Price is consolidating above the key support zone around 89,800–90,000, showing clear signs of selling pressure absorption after the recent sell-off. Volume behavior suggests potential accumulation rather than aggressive distribution.
As long as price holds above 89,800, the bullish scenario remains favored. A clean break and acceptance above 91,200–91,500 would confirm upside momentum, opening the path toward 93,000, followed by the major target near 94,700–95,000.
Only a decisive breakdown below 89,800 would invalidate the bullish setup. For now, buyers appear to be positioning for the next expansion leg to the upside.

Falling towards 50% Fib support?Ethereum (ETH/USD) is falling towards the pivot and could bounce to the 1st resistance.
Pivot: 3,029.50
1st Support: 2,914.63
1st Resistance: 3,204.48
Disclaimer:
The opinions given above constitute general market commentary and do not constitute the opinion or advice of IC Markets or any form of personal or investment advice.
Any opinions, news, research, analyses, prices, other information, or links to third-party sites contained on this website are provided on an "as-is" basis, are intended to be informative only, and are not advice, a recommendation, research, a record of our trading prices, an offer of, or solicitation for, a transaction in any financial instrument and thus should not be treated as such. The information provided does not involve any specific investment objectives, financial situation, or needs of any specific person who may receive it. Please be aware that past performance is not a reliable indicator of future performance and/or results. Past performance or forward-looking scenarios based upon the reasonable beliefs of the third-party provider are not a guarantee of future performance. Actual results may differ materially from those anticipated in forward-looking or past performance statements. IC Markets makes no representation or warranty and assumes no liability as to the accuracy or completeness of the information provided, nor any loss arising from any investment based on a recommendation, forecast, or any information supplied by any third party

ETH — Price Slice. Capital Sector. 3088.86 BPC 9© Bolzen | The Architect | BPC Framework
Bolzen Market Institute
🏷 ETH — Price Slice. Capital Sector.
TradingView Publication Date: 07.01.2026
🏷 3088.86 — price not yet reached at time of publication.
🏷 BPC — The Bolzen Price Covenant — Strength Index: 9
Quantum structure of obligations and capital flow in price formation via energy blocks.
🏷 Vertical chart — Energy Grid Dashboard.
🏷 Static Stream 1: price published in energy-block production sequence.
🏷 The price energy block is already ordered—not by time, but by execution priority. Crucially: block priority dynamically reconfigures in response to hidden energetic impulses, whereas price execution order records their market manifestation. Every price in the dynamic stream is tied to proprietary energy-production metrics inaccessible to the general public. Those who perceive structure before its manifestation do not follow price—they anticipate it.
EΞ2Φ8Ψ45Θ·ζ⁻¹·106Λ732·Ω²
📎 Screenshot:
🏷 When trading from levels, use liquidity zones from BPC 10 and above.
🏷 Bolzen Liquidity Map — ETH (numerical equivalent):
🏷 I. Interactive Reference Guide: BPC — The Bolzen Price Covenant
🏷 P.S. English is not my native language — I offer no apologies for stylistic imperfections. What you see here is not a post. It is a demonstration of another level of preparation: the symbiosis of human intuition and algorithmic precision. Mathematics and aggressive market analysis — against the machine of liquidations.
— The Architect
BPC — The Bolzen Price Covenant
