#BTC Global analysis of BTC. Correction and decline to 65kBYBIT:BTCUSDT
BYBIT:BTCUSDT.P
COINBASE:BTCUSD
Bitcoin is currently in an uncertain phase for everyone, so I have analyzed the most likely outcome of the price movement in my opinion.
On D1, we see a downtrend and a reaction from support levels. As a result, Bitcoin corrected to the 0.5 Fibonacci level, after which it did not reverse the trend but continued to test the 0.5 level.
The trend short line on H8-D1 was broken after several serious touches, and now I am waiting for a retest from the 0.618 Fibonacci level and a further correction to 98500-100000, where the 0.618 and 0.702 Fibonacci levels are also located.
This is a serious resistance level for the price and the place where the structure (BOS) was broken. The price usually returns to this place for further movement along the trend.
I expect this scenario, as I have not noticed that the main cryptocurrency has gathered enough liquidity to update its highs and a global long scenario.
At levels 98500 - 100000, I expect a short scenario to levels 65000 - 75000.
From there, Bitcoin will likely delight us with a long-term outlook and attract a large number of investors.
In addition to this, it is known that a large number of investors hold stablecoins and are ready to buy Bitcoin. Until this happens, we can assume that investors and funds are waiting for a suitable favorable price for the main asset.
ETH

ETH: Price Slice. Capital Sector. 3580.26
🏷 ETH: Price Slice. Capital Sector. Dated: 10.12.2025
🏷 3580.26 — Price not yet reached at time of publication
🏷 BPC — The Bolzen Price Covenant 15
🏷 Screenshot
🏷 Interactive Reference Guide: BPC — The Bolzen Price Covenant
🏷 P.S. English is not my native language — I offer no apologies for stylistic imperfections. What you see here is not a post. It is a demonstration of another level of preparation: the symbiosis of human intuition and algorithmic precision. Mathematics and aggressive market analysis — against the machine of liquidations.
The Architect
BPC — The Bolzen Price Covenant
What if we view the structure of capital from this angle — the Covenant is inevitable.
But in which temporal dimension will it unfold?
You ask: “Is this a correction?”
You update last week’s high — and instantly scream “breakout”?
Or will price drop because someone sneezed?
Or will the chart move up or down solely because some figure ate poorly and developed a headache?
Have I understood you correctly? Are news headlines your compass?
No.
There is no room here for desire.
No room for fear.
No room for hope.
Only the blade of patience — and cold calculation.
Liberation from desire is not a spiritual exercise — it is a prerequisite for precision.
True vision is born only in the silence of the mind.
The retail sector thinks within the confines of immediate price sectors: yesterday, today, tomorrow.
Its horizon is reaction.
Its instrument — the illusion of control.
Capital, however, sees differently.
It operates not with emotions, but with information.
Not with noise, but with logic.
Not with minutes, but with timeframes beyond your imagination.
You must read the chart — not as a map of fluctuations, but as a chronicle of capital’s intent.
And you must shed the perceptual chains of the old world — where headlines dictate price, and desire masquerades as analysis.
But this path is not for all.
Only those who have silenced their inner noise — who seek not a signal, but the essence — will find the answer.
And they will remain silent.
Or stay behind the door.
— Mr. Bolzen
PreFactum: Analytics

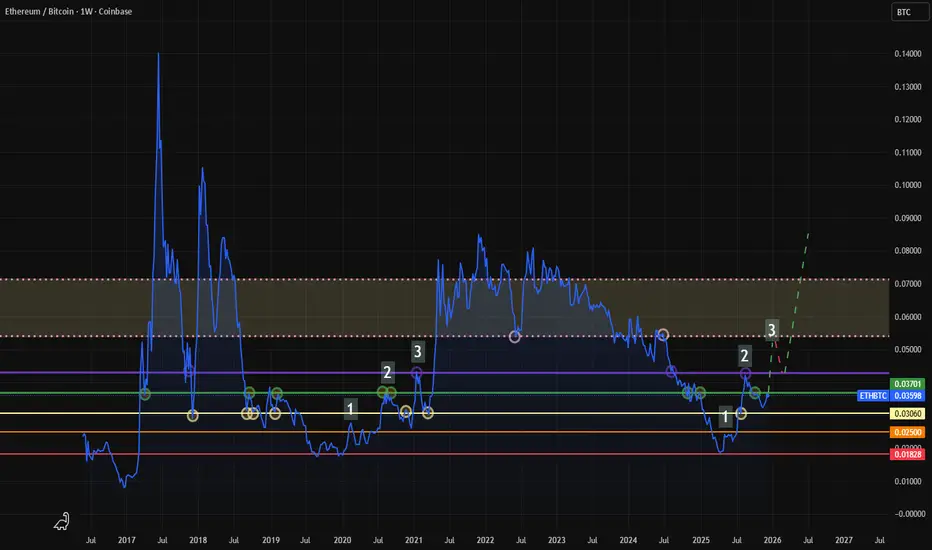
ETHBTC - HTF 3 Wave Buildup + Key Support & ResistanceMost important chart in crypto right now.
Be positioned before 0.043
Buy any dips after the Santa Rally down to current resistance 0.037
Distribute/TP within the shaded box area
My plan is ETH.Here are my thoughts on ETH. I'm maintaining my position from the previous review. You can check it out in my profile. My TVH is very good at 2,950+.
However, I'm still a little confused by the 4-hour RSI. For now, though, I'm ignoring it.
Think for yourself. I don't rule out price swings before or during the Fed meeting.
Good luck and profits to all!

ETHEREUM Analysis (12H)From the point where we marked the green arrow on the chart, the Ethereum triangle has begun, and at the point where we placed the red arrow, this triangle has completed and the price has entered a bearish phase.
It seems that we are currently in the late stages of wave C of this phase. Just note that this is the 12-hour timeframe, and this phase has not finished yet; its completion requires more time. We expect wave C to finish within the green zone, which is a supportive flip area.
From the green zone, wave C is expected to complete and the price should enter wave D, for which we have marked the targets on the chart.
Let’s see how it will unfold.
For risk management, please don't forget stop loss and capital management
When we reach the first target, save some profit and then change the stop to entry
Comment if you have any questions
Thank You

Bullish bounce off overlap suport?Ethereum (ETH/USD) is falling towards the pivot, which has been identified as an overlap support and could bounce to the 1st resistance, which acts a a swing high resistance.
Pivot: 3,238.27
1st Support: 3,047.27
1st Resistance: 3,620.30
Disclaimer:
The opinions given above constitute general market commentary and do not constitute the opinion or advice of IC Markets or any form of personal or investment advice.
Any opinions, news, research, analyses, prices, other information, or links to third-party sites contained on this website are provided on an "as-is" basis, are intended to be informative only, and are not advice, a recommendation, research, a record of our trading prices, an offer of, or solicitation for, a transaction in any financial instrument and thus should not be treated as such. The information provided does not involve any specific investment objectives, financial situation, or needs of any specific person who may receive it. Please be aware that past performance is not a reliable indicator of future performance and/or results. Past performance or forward-looking scenarios based upon the reasonable beliefs of the third-party provider are not a guarantee of future performance. Actual results may differ materially from those anticipated in forward-looking or past performance statements. IC Markets makes no representation or warranty and assumes no liability as to the accuracy or completeness of the information provided, nor any loss arising from any investment based on a recommendation, forecast, or any information supplied by any third party

Check if the price remains above 2887.66
Hello, fellow traders.
If you "Follow" me, you'll always receive the latest information quickly.
Have a great day.
-------------------------------------
(ETHUSDT 1D Chart)
The HA-Low indicator on the 1D chart is showing signs of forming at 2887.66.
Since the HA-Low indicator previously formed at 3472.96 and is showing signs of forming again, determining whether support at 2887.66 is crucial.
Furthermore, since the indicator is located near the M-Signal indicator on the 1M chart, we need to see if the price can maintain its upward momentum above the M-Signal indicator on the 1M chart.
In this sense, a rise above the previous HA-Low indicator level of 3472.96 is expected to trigger an uptrend.
Therefore, to ensure that the uptrend continues after breaking above a key point or range, we need to monitor whether the StochRSI, TC, and OBV indicators remain in an upward trend.
Since the OBV indicator has fallen below the EMA 3, it must rise above and remain above the EMA 3 level.
We need to confirm whether the price can rise above the M-Signal indicator on the 1M chart after passing through this volatility period around November 27th (November 26th-28th).
-
Thank you for reading.
We wish you successful trading.
--------------------------------------------------

ETH Is Quietly Loading Up Power — Are You Ready for....Most traders get trapped during sideways markets because they don’t understand what the structure is preparing for.
This ETH chart reveals a very clear accumulation pattern and those who can read these signals early will position themselves before the breakout happens.
📌 1. Market Structure
- ETH is currently moving inside a third consecutive sideways zone, showing repeated accumulation phases.
- Each consolidation has produced a higher low afterward, forming a clean uptrend continuation structure.
- Price is respecting the dotted uptrend line, confirming buyers are still in control.
📌 2. Key Zones
Sideway Zone #1: ~3,140 – 3,210
Sideway Zone #2: ~3,020 – 3,070
Sideway Zone #3 (current): ~3,080 – 3,170
This third sideways block is the most important — it’s forming right at the uptrend support, signaling smart money accumulation before the next push.
📌 3. Price Action
- Strong recovery from the previous support sweep.
- Price created a sharp HL bounce, then moved sideways again a common bullish re-accumulation pattern.
- ETH is currently compressing inside the range, forming smaller internal highs and lows typical behavior before a breakout.
- Projection (green path) shows a series of higher lows forming inside the zone before price expands upward.
This structure shows balanced liquidity absorption bullish.
📌 4. Technical Confirmation
- The dotted uptrend line is acting as dynamic support.
- Multiple wick rejections from the lower side of the range show buyers aggressively defending.
- Volatility is contracting — a textbook sign of pre-breakout compression.
- No bearish structure change unless price breaks below the uptrend line.
Everything aligns with a bullish continuation leg.
📌 5. Trading Plan (Entry – SL – TP)
🎯 Long Position Setup
Entry: 3,085 – 3,110 (lower side of current range)
Stop-Loss: 3,045 (below range + below uptrend line)
Take Profit 1: 3,165
Take Profit 2: 3,210
Final Target: 3,260+
Why it works:
You buy at the bottom of the re-accumulation while the uptrend line protects structure and range compression leads to an expansion move.

Gold Is Preparing for a Reversal — Only Smart Money Will 📌 1. Market Structure
Gold is currently forming a bullish market structure on higher timeframes, with clear sequences of:
- HH (Higher Highs)
- HL (Higher Lows)
The recent drop created a series of LL & LH patterns, but this occurs inside a falling wedge, which typically appears as a bullish correction phase before a strong continuation upward.
The wedge + liquidity sweep + key HL zone indicates a potential trend continuation.
📌 2. Key Zones
Major Support Zone: 4163 – 4170
This is the large liquidity zone where price previously formed HL + BOS.
Price is now dipping back into this zone — ideal for liquidity collection.
Upper Resistance Target: 4230 – 4265
This is where previous HH formed and where price may extend after breaking the wedge.
📌 3. Price Action
- Price broke structure (ChoCh) during the drop, but this move is corrective, not reversal.
- The wedge is compressing with lower volatility and higher rejection wicks.
- Sellers are losing strength; buyers are absorbing entries near the HL liquidity zone.
- Current projection shows a possible V-shaped reversal or a slower corrective retest bounce, both converging to bullish continuation.
This matches your yellow & green projection lines.
📌 4. Technical Confirmation
-Falling Wedge: A classic bullish reversal pattern.
-Liquidity Sweep: Price wicked below the previous LL, grabbing liquidity for buyers.
-BOS signals: Multiple Break-of-Structure points confirm prior bullish intent.
-Rejection at Support: Strong wick rejections inside the wedge base show institutional buying.
-Fib Confluence (if applied): 0.618–0.705 zone aligns perfectly with the current rebound.
All technicals suggest a bullish reversal is highly probable.
📌 5. Trading Plan
🎯 BUY Setup
Entry Zone: 4165 – 4175 (at wedge bottom / liquidity zone)
Stop-Loss: 4148 (below liquidity sweep & wedge invalidation)
Take Profit 1: 4210 (first structure break)
Take Profit 2: 4235
Final Target: 4260 – 4265 (previous HH)
Why this setup works:
You’re entering at the end of a liquidity sweep, inside a falling wedge, at a major HL zone, with BOS support behind you.
This is exactly where institutions enter not retail traders.

ETH ANALYSIS – 1h📊 ETH ANALYSIS – 1h
🔥 1. Key Fact on the Chart
We have a very strong upward impulse that:
Breaked the upper band of the descending channel (blue)
Touched the upper line of the ascending channel (orange)
Was immediately rejected (long wick)
The MACD shows extreme overbought + potential divergence in the making
Such a move usually indicates a short squeeze + profit-taking → i.e., a temporary weakening and a retest of the breakout.
🎯 2. Price areas I see on your chart
Green (resistance/TP for longs):
3479–3490 – structural highs, strong resistance
3420 – local resistance
3375 – first real resistance after the breakout
Red (support/defense levels of the structure):
3338–3348 – first test zone after the breakout
3293 – key level — sustain = trend continuation
3180–3200 – consolidation zone broken (likely retest)
📉 3. What does the current wick mean?
This giant wick signals:
short liquidations
lack of demand for a continuation after the first resistance breakout
high probability of a return to the range
possibility of a retest of the breakout (around 3185–3210)
This doesn't look like a classic breakout with a continuation, but rather a fakeout and the need for a correction.
📈 4. Scenarios
➡️ Bullish (more likely if 3293 holds)
Price falls to the 3338–3293 zone
Builds a local HH/HL
Starts a move to 3375, then 3420
If 3420 breaks → target 3480–3500
➡️ Bearish (if price loses 3293)
Retest from the bottom of 3293
Return to the blue channel
Target: 3185–3200
If this level breaks → 3050–3080 (lower band of the channel)
📟 5. MACD
MACD is:
extremely stretched
signal line begins to collapse
histogram decreases after Explosion
→ This almost always means a local intraday high + a drop to support.

ETH: Price Slice. Capital Sector. 3382.94🏷 ETH: Price Slice. Capital Sector. Dated: 08.12.2025
🏷 3382.94 — Price not yet reached at time of publication
🏷 BPC — The Bolzen Price Covenant 10
Factors Defining the Structure of the Price Field within BPC The Bolzen Price Covenant
The trend is a secondary, yet strategically significant, element of the analytical construct.
The foundation of the system lies in the execution cycle of price markup , synchronized with miners’ production energy and visualized through a vertical chart .
Within this chart, each price assumes a strictly defined position a “cell” according to its intrinsic ordinal number. This architecture constitutes the analytical grid , access to which will be granted to subscribers within the coming week.
I have developed price execution priority indicators , which account for the volume of energy expended by miners in the production of a given price. These indicators refine the sequence of price execution within the analytical grid.
Crucially : execution priority, as determined by energy expenditure, must not be conflated with the order of price execution these are distinct, albeit interrelated, categories.
The vertical chart is integrated with the BPC The Bolzen Price Covenant Strength Index and is deployed across two access tiers:
Base Tier : The first segment of prices is published, annotated with their execution priority. At this level, each price enters the execution queue.
If a price is absent from the base vertical chart, it signifies that its production energy is insufficient for inclusion in the current execution queue. Such a price will instead appear on the Master Chart , where it is positioned according to annual forward markup and its place in the long-term hierarchy.
This is a new form of technical analysis , born in the era of global transition into blockchain systems and the synthesis of human judgment with algorithmic precision .
This methodology does not forecast it records price commitments , revealing the true structure of capital and its flow through the lens of energetic cost.
🏷 Interactive Reference Guide: BPC — The Bolzen Price Covenant
🏷 P.S. English is not my native language — I offer no apologies for stylistic imperfections. What you see here is not a post. It is a demonstration of another level of preparation: the symbiosis of human intuition and algorithmic precision. Mathematics and aggressive market analysis — against the machine of liquidations.
The Architect
BPC — The Bolzen Price Covenant

ETH Is Setting Up Something Big…1. Market Structure Overview
ETH is currently trading between two important HTF zones:
- Resistance Zone: 3150 – 3180
- Support Zone: 3050 – 3080
Price recently created a lower high rejection inside the resistance zone and is now pulling back toward support, signaling early weakness.
The overall structure shows:
- Short-term bullish push, but failing to break resistance
- Formation of LH → LL → LH, indicating bearish momentum emerging
- Market is compressing, preparing for a larger directional move
This aligns with the transition phase where liquidity is being collected before a breakout — typically to the downside.
2. Technical Analysis
Here’s what the chart reveals:
A. Resistance Rejection
Price tapped directly into the 3150–3180 resistance zone, leaving a long wick followed by impulsive selling.
→ This confirms strong sell-side presence.
B. Weak Bullish Recovery
The bounce from support lacks strength:
- Candles are smaller
- Momentum slowing
- Lower highs forming
This reflects a market losing bullish pressure.
C. Bearish Structure Development
The zig-zag projection shown matches current behavior:
- Price likely retests 3150
- Forms another Lower High
- Then breaks down sharply toward deeper support
D. Liquidity Map
- Liquidity sits below 3050
- Market is likely to sweep this level before strong buyers step in
→ Expect a liquidity grab before any major reversal.
3. Trading Plan (Entry – SL – TP)
🎯 SELL Setup (High-Probability)
Entry: 3145 – 3160
Stop Loss: 3188
Take Profit 1: 3080
Take Profit 2: 3020
Final Target: 2980
Reason:
Price is forming clean LH structure at resistance + bearish rejection → ideal position for swing short.
⚠️ Alternate Scenario (If invalidation occurs)
If price closes above 3190 on H1 → bearish idea invalid.
→ Stay out and wait for a bullish retest to re-enter long.
4. Summary
ETH is showing strong signs of distribution at resistance. The market is forming Lower Highs and preparing for a deeper decline toward the 2980 zone. The most optimal play is a sell entry at the resistance rejection, with tight SL and clear profit targets.
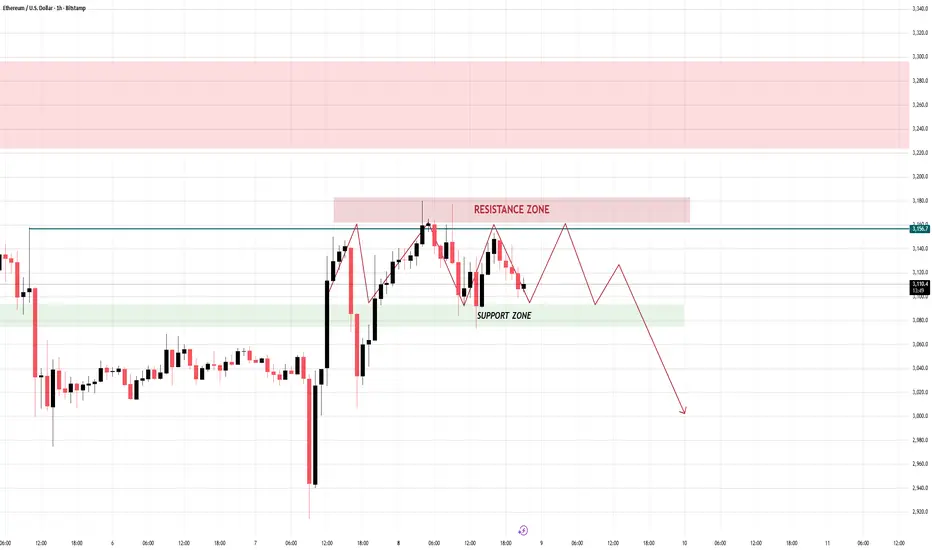
ETH Is Entering the Trap Zone…ETHUSD Market Analysis – Price Is Entering a Make-or-Break Zone
1. Current Market Structure
- ETH has broken the previous downtrend (breakout from the descending trendline).
- After the breakout, price moved into the Moving Price Zone, consolidating inside an expanding channel.
- Price is now touching the RESISTANCE ZONE, showing clear signs of buying exhaustion.
- The SUPPORT ZONE below (green area) remains the key liquidity zone where strong demand has appeared before.
2. Today’s Scenario (Main Outlook)
🔹 Main Scenario – Bearish Reaction From Resistance
- ETH is likely to:
-Continue to move sideways inside the resistance area → a sign of fading bullish momentum.
-Then initiate a strong corrective drop, following the expanding wedge structure.
-Expected downward targets:
+ First support area
+ Or deeper → the main SUPPORT ZONE to collect liquidity.
Reasons:
- The resistance zone is too strong → multiple rejections.
- Price structure resembles a “distribution zone.”
- The current rising channel after breakout is only a temporary recovery.
3. Market Psychology
Traders turn cautious as ETH enters a major resistance area.
Smart money tends to distribute positions at high prices → leading to sideways top formation.
Buying liquidity weakens the closer price moves to resistance.
This hesitation often precedes a sharp correction phase.
4. Trading Outlook (Intraday)
📌 SELL Zone (High Probability)
3380 – 3420
TP1: 3230
TP2: 3050
SL: 3460
📌 BUY Zone (Re-entry – Low Risk)
2720 – 2800
TP: 2980 – 3050
SL: 2660
5. Conclusion
ETH is approaching a critical decision point:
Priority scenario: Sideways at resistance → followed by a downward move to support.
Bullish continuation only becomes valid if ETH breaks above 3440 with strong volume..
Stay patient. Smart money wins by waiting, not chasing. The next big move will reward discipline.

BTC Is Setting Up Something Big…BTC MARKET ANALYSIS – 1H
1. Current Price Structure
- BTC is continuing to trade inside a clean sideways channel between the Support Zone (88,700 – 89,500) and the Resistance Zone (92,500 – 93,500).
- After rejecting the support zone, price has started forming a series of higher lows, indicating short-term bullish momentum building inside the range.
- The current price action shows a corrective leg forming, which aligns with the projection drawn on the chart: slowly climbing toward the resistance zone.
2. Liquidity Zones
Resistance Liquidity (92,500 – 93,500):
- This zone has absorbed liquidity multiple times, showing clear sell pressure and unfilled orders from previous sessions.
Support Liquidity (88,700 – 89,500):
- Several long wicks show strong absorption — buyers consistently defend this region.
BTC is currently traveling from liquidity-to-liquidity, moving upward to target the liquidity cluster above.
3. Today’s Market Scenario
Main Scenario – Bullish Drift Toward Resistance
Price structure suggests that BTC is entering a mid-range accumulation → expansion phase.
The higher low sequence indicates that buyers are slowly gaining control.
BTC is likely to:
- Continue forming minor corrections on the way up.
- Push into the upper resistance zone.
- Potentially sweep the highs inside this zone before any major reaction.
This aligns with the red projection drawn on your chart.
4. Market Psychology
Inside ranges like this, the market often:
- Builds liquidity on both sides.
- Creates clean, predictable swing highs/lows.
- Encourages traders to overreact at small moves.
Smart money typically uses these conditions to accumulate at support and offload at resistance.
BTC is following this exact textbook behavior.
5. Intraday Strategy
Trade Idea (Buy Bias inside the Range)
Entry (BUY): 89,800 – 90,000
Stop Loss: 89,200
Take Profit: 92,800 – 93,400 (Resistance Zone)
Alternative Scenario
If BTC rejects sharply from resistance → sell only after a confirmed break of market structure, with targets back toward mid-range.
Stay patient — BTC is moving in a controlled climb, and the liquidity above is the magnet.

ETH Capital Sector. Price Slice 15.11.2025 1590.05 K🏷 ETH Capital Sector. Price Slice 15.11.2025
3035,40 — At the time of publication, the price had not yet been reached. ( на момент публикации цена не достигнута )
2872,52 — At the time of publication, the price had not yet been reached. ( на момент публикации цена не достигнута )
2772,62 — At the time of publication, the price had not yet been reached. ( на момент публикации цена не достигнута )
2575,43 — At the time of publication, the price had not yet been reached. ( на момент публикации цена не достигнута )
2332,65 — At the time of publication, the price had not yet been reached. ( на момент публикации цена не достигнута )
1927,44 — At the time of publication, the price had not yet been reached. ( на момент публикации цена не достигнута )
1590.05 — At the time of publication, the price had not yet been reached. ( на момент публикации цена не достигнута )
🏷 At the request of close colleagues, friends, and supporters of my work, I am publishing this analytical material in English—for the international institutional community and conscious retail market participants.
🏷 This slice reflects the logic of institutional capital movement. It is critical to understand: price is formed only when sufficient liquidity from the retail sector and sustained crowd interest are present. Without this condition, institutional interest remains potential, but unrealized.
🏷 Meanwhile, institutional capital operates on entirely different temporal and structural charts than those visible on the screens of most traders.
🏷 Therefore, a superficial view of price is doomed to distortion.
🏷 Methodology: Pre-Factum
🏷 My analytical markings are built on the principle of Pre-Factum—anticipating the fact before it manifests. This is not forecasting in the traditional sense, but identifying capital intent prior to its physical manifestation on the chart.
🏷 The central element of this method is identifying a price sector as an intention—where the instrument is striving to go—regardless of its current price action: no emotions, only cold calculation. Every price has its own timeframe.
🏷 There are three ways to interact with unfulfilled price levels:
🏷 1. Trade from the level—enter upon confirmed structural validation.
🏷 2. Wait for fulfillment—observe price movement toward the level without entering, focusing on instrument behavior.
🏷 3. Trade in the direction of the level—utilizing support/resistance levels with strict risk control.
🏷 If you choose the third path, deep understanding of market mechanics becomes mandatory. Without experience, conscious perception of liquidity behavior, and prior study of relevant materials, entering such positions is premature.
🏷 This applies equally to retail newcomers and professionals whose attention remains scattered by short-term timeframe noise.
🏷 Relevance of Markings
🏷 The levels presented here are current, fresh institutional capital markings. They do not invalidate previously identified unfulfilled prices but complement them within the context of evolving liquidity and shifting market logic.
🏷 A flag placed prior to price touch—with the publication date (level, sector—whichever you prefer)—indicates that the instrument, with high probability and regardless of current price movement, intends to execute a move toward that price.
🏷 Two examples:
🏷 Example #1 — BTC:
On the screenshot from September 26, 2025, I marked the price of 106,110 with a blue flag (color is my personal labeling). Screenshot:
The instrument subsequently deviated from this level by 15%, creating pressure: on October 10, 2025, price declined sharply, collecting all long positions.
Instrument slide:
🏷 Example #2 — ETH:
On October 12, I marked the price of 3,291.60 with a yellow flag:
On November 4, the instrument reached the marked price:
🏷 I have directed your attention to specific prices—and there are many such examples in my feed. If you study my materials, you will see: this is a new methodology, currently not demonstrated by anyone else in the world. The precise slice and price sector I have developed reveal the true mechanics of the market.
🏷 Once price reaches a flagged zone, the marking loses its original function. It must be updated to reflect the new logic of capital movement—otherwise, it becomes a misleading reference or a conventional technical analysis level.
🏷 These markings are not static. They are dynamic markers of intent, requiring constant reassessment. It is precisely these that we uncover through the method of capital anticipation.
🏷 Temporal Context
🏷 I emphasize separately: the flag carries not only a price function, but also a temporal one. The publication date is the fixed point of my observation and identification. It serves as my anchor: where and when I captured institutional intent.
🏷 My entire architecture of price sectors is systematically organized into chronological folders. I have already demonstrated this structure in one of my videos—for those who seek to think structurally, not reactively. Use translators as needed to study my demonstration.
🏷 This is not a forecast. It is a map of intent.
🏷 Read it with respect for liquidity, time, and capital intelligence.
🏷 English is not my native language. With international exposure, time will come—I will provide new reference points as needed, without compromising institutional interests or the balance of many market participants. I do not disclose the entire price sector or the skill of seeing any instrument within its price sector for security reasons. You must determine for yourself how to engage with institutional analysis.
🏷 There are traders, and there are analysts—two distinct classes. The mindset between institutional analysis and trading is fundamentally different.
🏷 As you see, I do not use indicators. This is mathematics, logic, and an intellectual system I created—my proprietary property. I have come only to help you see a different structure.
🏷 The battle of titans is a clash of attention and timing.
🏷 The question is not who is right—but who has the resources and patience to unload positions.
🏷 Who leads whom? The one who sees further and holds institutional leverage.
🏷 You have received a map. Most see an image; few read the message. The difference is not IQ, but the habit of looking toward the future—not at indicator noise.
🏷 Institutional capital meticulously crafts candles, as if scripting the narrative to suit its preferred triggers. I, operating from the shadows, read the plan: where entry points will be set, where liquidations will be scheduled, who will hold positions until the bell.
🏷 I offer possibilities, not commands. But let us acknowledge: a hint is an art—and it transforms curiosity into dependency. Do you remember the echo of these words?
🏷 I have shown you another side of analysis—I have designed what you have been waiting for, and what you have grown weary of. This is new technical analysis: to understand how to control the capital sector—study the materials. The secrets are mine. I give you part of this understanding to help you.
🏷 Not tricks, not guesses—but architecture.
🏷 Let it sound mystical—it must. A map in the hands of one who can read between the candles always appears as prophecy to those accustomed to indicator noise.
— The Architect

ETHEREUM is about to EXPLODEEthereum is doing similar thing it did in April 2025 :
- Falling channel
- Breaking resistance
- Rise again
Gold Is Preparing for a Deep Liquidity SweepMost traders chase the final push of wave (B) and get trapped right before the market reverses. When you understand wave structure + liquidity zones, you stop trading emotions and start trading precision.
📌 1. Market Structure
Gold has just completed a 5-wave impulsive structure (1 → 5) into the resistance zone.
Immediately after wave (5), price shifted into a corrective phase, forming leg (A) downward.
This is classic Elliott behavior: Impulsive (5 waves) → Corrective (ABC).
Current structure is entering wave (B) retracement before dropping into wave (C).
📌 2. Key Zones
Resistance Zone:
Price reacted strongly at the previous swing-high cluster where wave (5) completed — confirming heavy sell orders.
Support Zone:
The zone around wave (2) & (4) provided multiple rejections, but a break below (A) suggests this support is weakening.
Liquidity Zone (Target): 4128 – 4136
This is the major liquidity pocket where the market likely aims for a sweep during wave (C).
📌 3. Price Action
- Wave (A) formed with clear momentum down.
- Current upward leg into (B) shows weaker volume, typical of a corrective pullback.
- The projected path shows price retesting resistance before a deeper drop.
- Structure is no longer bullish — it’s transitioning into a corrective sequence.
- The dashed path is perfectly aligned with typical ABC behavior.
📌 4. Technical Confirmation
- Wave Theory: 5-wave impulse completed → ABC retracement is expected.
- Liquidity Map: Price has unfinished business at the 4128–4136 zone.
- Support Break: Wave (A) broke below the previous minor support, shifting short-term bias bearish.
- Resistance Rejection: Wave (B) is likely to fail at the previous top structure.
Everything aligns with a bearish continuation into wave (C).
📌 5. Trading Plan
🎯 SELL Setup (High probability)
Entry: 4,230 – 4,255 (top of wave B retracement)
Stop-Loss: 4,290 (above previous swing & invalidation of B)
Take Profit 1: 4,165
Take Profit 2: 4,140
Final Target: Liquidity 4128 – 4136 (wave C completion)
Why this setup is strong:
You are shorting into the end of wave B, which typically traps breakout buyers before wave C dumps sharply.

EURUSD: This Move Wasn’t Accidental…EURUSD MARKET ANALYSIS – 1H
1. Current Price Structure
- EURUSD has completed a full parabolic rounded bottom formation, pushing price back into the upper boundary of the ascending channel.
- After touching the resistance zone (1.16800), price sharply rejected and transitioned into a descending channel, signaling a shift from bullish continuation to correction.
- The recent rally lost momentum, and price is now moving inside a bearish correction channel, confirming that buyers are weakening.
- The circled area shows a failed breakout attempt, followed by strong re-entry inside the bearish channel → classic distribution signal.
2. Liquidity Zones
Resistance Liquidity (1.16800):
Price tapped this level multiple times and got rejected aggressively → liquidity above remains intact, suggesting the market is not ready for a breakout.
Support Liquidity (1.15900):
The support zone below holds significant liquidity — multiple previous wicks show repeated absorption by buyers.
Current structure indicates
Smart money is distributing near resistance and collecting liquidity for a deeper move toward support.
3. Today’s Market Scenario
🔻 Main Scenario – Bearish Correction Toward Support
The price is expected to continue moving inside the descending channel:
Multiple lower highs forming at the top of the channel.
Price likely oscillates sideways with bearish bias, forming repeated LH–LL structures.
Final target of this correction: 1.15900 (support zone).
This aligns perfectly with the red path drawn on your chart:
- Zig-zag correction
- Progressive decline
- Reaching support zone for liquidity sweep.
Unless the resistance zone is broken convincingly, bearish continuation remains the highest-probability scenario.
4. Market Psychology
The chart reflects a classic sentiment shift:
- Before reaching resistance, traders were optimistic due to the strong bullish rally (rounded bottom).
But the sharp rejection at resistance created psychological distribution, where:
-Early buyers take profits
-Late buyers get trapped
- Smart money sells into retail optimism
The descending channel represents controlled selling pressure, not panic — this is strategic distribution.
Price will typically move slowly downward, trapping breakout traders until deeper liquidity at support is reached.
This is textbook smart-money behavior:
Euphoria → Distribution → Controlled Decline → Liquidity Sweep.
5. Intraday Strategy
🔻 Short Bias (High Probability)
Trade with the correction channel.
Entry: Short at the upper boundary of the descending channel (1.16500 – 1.16600).
SL: Above mini-swing high or above channel top (≈ 1.16750).
TP1: 1.16250
TP2: 1.16050
TP3: 1.15900 (major support zone)
🔹 Conservative Strategy
Wait for price to retest 1.16500 and show rejection before shorting.
🔸 Long Setup (Low Probability)
Only consider long if:
Price breaks the descending channel
AND Retests above 1.16650 with strong bullish confirmation.
Target if breakout occurs: 1.16800 – 1.17000.

ETHUSD 1D chart1️⃣ Trend and key levels
Trend
• The overall neutral-growth trend, but with clear consolidation.
• The price rebounded dynamically from the bottom (approx. USD 2,850), which creates the first higher low structure → the potential beginning of an upward impulse.
Support
• $2,973-$3,000 – SMA #1 + local support.
• USD 2,851 – strong support from which the candle made a very large wick upwards.
Resistances
• USD 3,169 – the first strong resistance, several candles bounced from this level.
• $3,236 – key daily resistance. Breakout = signal of strong momentum and opening the way to USD 3,300-3,430.
⸻
2️⃣ Candle formation and behavior
• A bullish candle with a long lower wick appeared → this is a signal of buyers.
• The price is making a series of higher lows, but no higher high yet → the market is waiting for a breakout of USD 3,236 to confirm the uptrend.
⸻
3️⃣ SMA (moving averages)
🔴 SMA #1 (short-term)
• Price is just above it → acts as support.
• If the daily candle closes below $3,000, the downside momentum returns.
🟢 SMA #2 (long term, ~$3,430)
• Is high above the price → long-term bearish pressure until the price returns to the price area.
⸻
4️⃣ RSI (momentum)
RSI around 45–50
• Neutral territory.
• Zero overbought/oversold.
• Slight upward trend in RSI → buyer momentum is growing, but without an overheating signal.
Conclusion: The market has room to move higher before the RSI becomes high.
⸻
5️⃣ MACD
• MACD is above the signal line → slight, early bullish signal.
• The histogram increases, but there is no significant acceleration.
Interpretation: increases are possible, but without strong momentum yet.

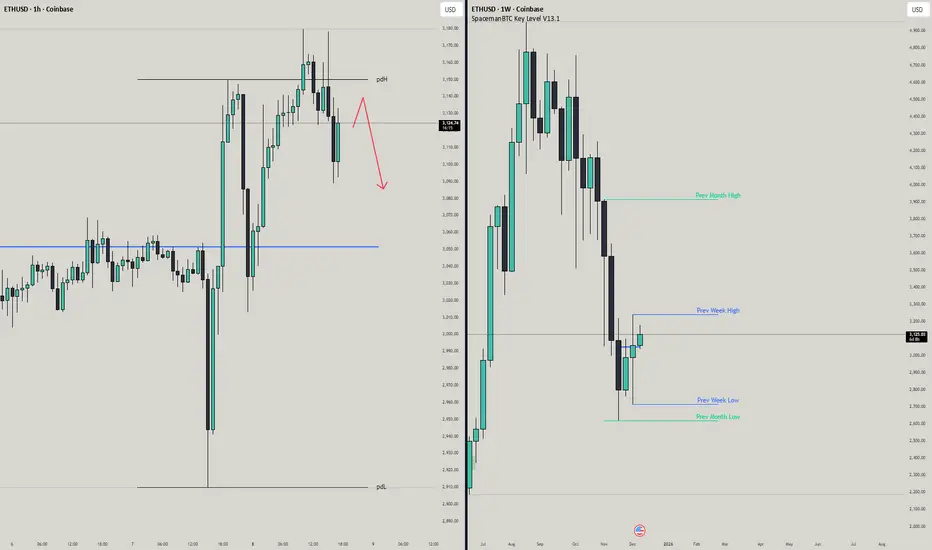
ETHUSD | RejectedEthereum showed a big rejection from the previous day high, same with bitcoin.
Will be looking for a retest of this level before going into any short positions.
When this retest happens I will be looking for a 15-30 minute candle close under the PDH.
Will be very careful entering though, daily chart is starting to look funky, with the weekly showing 2 green candles as well.
There certainly has been some bullish momentum that came in the last few days.
Let me know what your analysis is!
Stay safe out there and do your own due diligence, this is not investment advise!
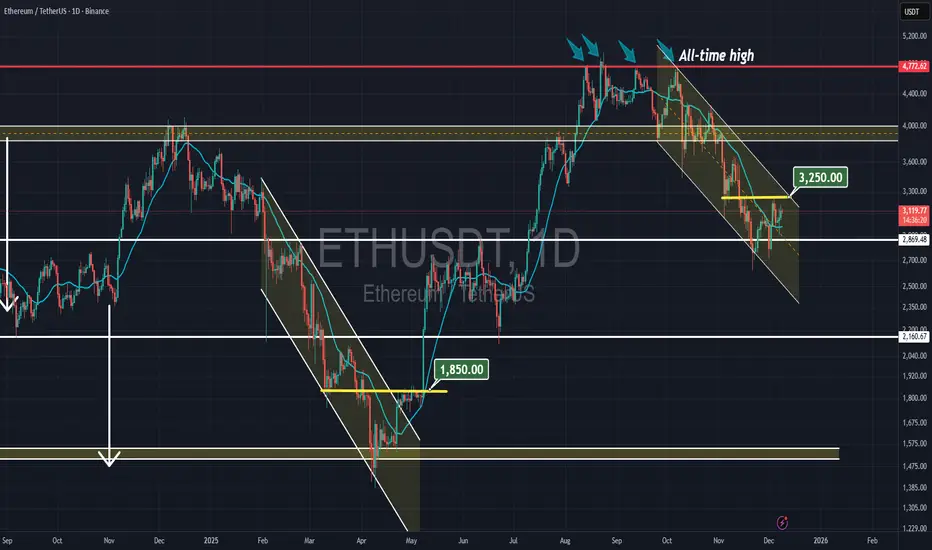
Ethereum (ETHUSD) – Momentum Shift in Progress?thereum just staged a strong rebound, signaling a potential momentum shift after months of bearish pressure.
🔄 Trend Development
After a sharp drop early last week, ETH quickly reversed and printed a higher low — a key early sign of bullish intent.
Shortly after, ETH broke above the previous week's high, marking the first higher-high and higher-low structure in months. While this happened in a tight time frame, it's a meaningful development from a price action perspective.
📉 Support & 📈 Resistance Levels
Support held strong in the $2,600 – $2,800 range
Immediate resistance now sits at $3,300
A breakout above $3,300 could trigger a move toward the upper boundary of the descending channel
However, we can't give the "all clear" just yet. A weekly close above $4,000 – $4,200 would be needed to confirm a full trend reversal and bullish continuation.

Altcoins are loading. BTC Dominance is in a downward retest following the recent breakout.
ETH/BTC confirmed its upward breakout.
The apparent silence is actually the sound of an impending power shift.
CRYPTOCAP:BTC.D vs. BINANCE:ETHBTC

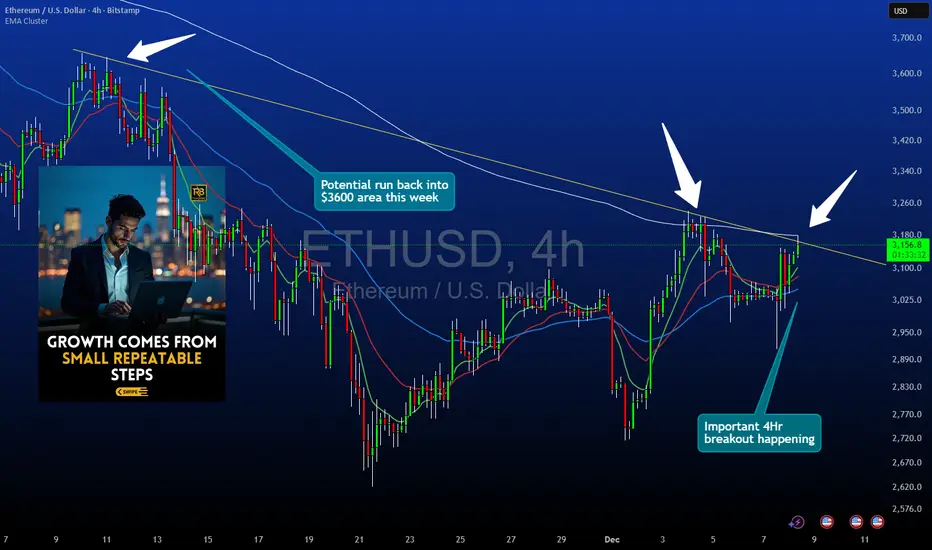
Ethereum 4HR Structure UpdateThis idea focuses on Ethereum on the 4 hour chart.
Price is approaching a descending trendline that has acted as dynamic resistance. A break and confirmed close above this trendline is required before considering any long setups.
Key Levels and Structure
• Primary focus is the descending trendline that has capped every recent bounce
• A full candle close above the trendline is essential before any entry is planned
• The upside reference area for this idea is near 3600 where prior reactions occurred
• Invalidations sit below 2950 which would represent a break beneath the recent structural base
Entry Logic
This setup is based on confirmation rather than anticipation.
• No entries should be taken while price remains under the trendline
• A strong bullish close outside the trendline is needed
• Weak closes or wicks through the trendline without body confirmation do not qualify
• The idea is only valid once the trendline is clearly violated on a closing basis
Why the Close Matters
Closing outside the trendline shows that market participants have accepted price above the descending structure rather than briefly testing it. This helps filter false breaks and reduces reliance on intrabar volatility.
Risk Parameters
Stops would be referenced below 2950 since a move under that area would indicate failure to hold recent structural support. The 3600 region is used as the first upside reference point based on previous reactions on the 4 hour chart.
Notes
This idea evaluates structural behavior and does not forecast future performance. Users should confirm levels and apply their own risk management plan before taking any trade.