ETHUSDT: Pullback to 2,900 Before the Next DropLooking at the current price action, ETH is showing the classic signs of a weak market : shallow pullbacks, weak buying pressure , and repeated rejections at key resistance zones. Everything suggests ETH is simply taking a short pause before the next leg down.
On the H4 timeframe, price remains firmly inside the descending channel drawn on the chart. Every time ETH touches the upper boundary of the channel, it gets sold off aggressively — a pattern that has repeated consistently. The 2,900 USDT area above now acts as a confluence resistance zone: it aligns with the channel’s upper boundary and a corrective structure — the perfect place for sellers to step in.
At the moment, ETH is making a minor pullback to retest the 2,900 region, but buying momentum is fading and candles are being pushed down repeatedly. This indicates that a bearish reversal is likely forming. Once rejection confirms, the nearest target is the 2,650 support zone. If bearish momentum accelerates, ETH could slide further toward 2,550.
Reference Scenario
Main Trend: Bearish
Strategy: Wait for ETH to retest 2,900 and SELL
Targets: 2,650 – 2,780 → deeper target: 2,550
ETH

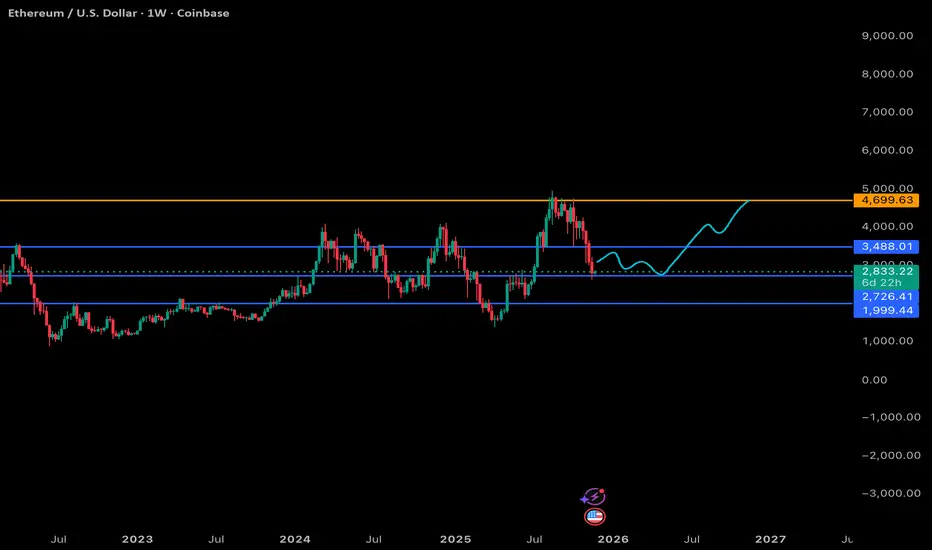
ETH 1W Breakdown: My Levels & What to Expect Next - Nov 23 2025Here’s my current high-timeframe view on Ethereum. Same structure as the BTC chart:
Blue = support, orange = major resistance, and the teal line = where I think price is headed into next year.
Support Levels (Blue)
$3,488: This is the upper support zone. ETH already lost it on the weekly, so I’m treating it as a potential reclaim level later rather than an area to rely on for an immediate bounce.
$2,726: This is the real weekly support I’m watching short-term. Price is sitting just above it, and this level has acted as both resistance and support multiple times across 2024–2025. If ETH is going to stabilize, it’ll probably start here.
$1,999: Deep, cycle-reset support. I’m not calling for this, but it’s absolutely in play if the broader market gets another leg down or BTC drags everything into a deeper correction phase.
Resistance (Orange)
$4,699–$5,000: This is the macro ceiling for ETH. Major weekly resistance from the last cycle’s highs. ETH hasn’t convincingly broken above this since 2021, so this is the level that needs to be taken out to start a real expansion phase.
My Expected Path (Teal)
The teal line is basically my roadmap going into late 2025/2026:
ETH chops around between $2.7K and $3.4K while the market tries to find weekly direction.
Eventually we get a reclaim of that mid-zone, slow, sideways, frustrating price action.
Then a grind back into the $4–4.5K region as momentum rebuilds.
Break above the orange zone later next year, which finally opens the door for a move into price discovery (I’m thinking $6K+ if things really align with the broader cycle).
This mirrors the BTC idea: a mid-cycle reset, sideways accumulation, then the breakout once the market has properly flushed leverage and sentiment has cooled off.
Overall View
ETH looks like it’s in the same boat as BTC right now, not bearish on the macro, just in that annoying “let’s reset everything” phase that tends to drag on longer than most people want. If it plays out like this, I think ETH offers multiple opportunities to accumulate before we get any push toward its all-time-high region.
Slow grind now, bigger moves later.
BTC 71,689.50 — The Capital Sector. Price Slice. 23.11.2025 Capital Sector. Price Slice. Dated 23.11.2025
74,715.11 USD — not yet reached as of publication.
71,689.50 USD — not yet reached as of publication.
Esteemed international community,
I demand your unequivocal attention: as the sole Architect of the Capital Sector and originator of the Price Slice methodology, I hereby attach to this publication documentary evidence confirming the integrity of my analytical architecture.
On 16.10.2025 , I formally designated the sector with a Price Slice at 71,689.50 USD .
Original screenshot:
TradingView publication:
Across global timeframes, we observe the instrument’s deliberate inclination toward retesting the specified level —not a coincidence, but a structural imperative.
All prices I publish represent capital’s intent , not speculative hypotheses.
Until the instrument physically touches these levels on their respective timeframes, these precisely carved and calculated values remain absolute . Each price carries its own temporal projection—disregard of this principle leads to analytical collapse.
Study the logic of my work:
Institutional capital does not follow charts—it draws them.
It fabricates deceptive candles tailored to your indicators, feeding you illusions.
I, in turn, reveal to you the pre factum method —analysis of the future before it manifests.
The question is not where price is heading .
The question is which Price Slice to select within the context of the global trend .
The Map of Unexecuted Prices is your strategic instrument. Deploy it with precision.
English is not my native language. I formally apologize for any stylistic imperfections—yet I emphasize: the essence of my analytics remains unaltered across any translation. It is as immutable as market structure itself.

BRIEFING Week #47 : Monthly Reversal in ?Here's your weekly update ! Brought to you each weekend with years of track-record history..
Don't forget to hit the like/follow button if you feel like this post deserves it ;)
That's the best way to support me and help pushing this content to other users.
Kindly,
Phil

ETHUSD W1 - Swing PositionETHUSD W1
We might be starting the bullish continuation here in the Crypto space after such an aggressive correction. We have marked on a 618 correction from previous swing low to swing high price.
Swing low price of $1400, to a swing high price of $5000, a huge extension seen from April 2025 through to end of Aug 2025. We have indicated various prices of interest, working out every $500.
Falling just shy of $2500, this may have been the lowest price we expect to. Lets see what this week brings.

The Bitcoin Cycle: A guide to time the next major entryBitcoin could be approaching a cycle low in the next 3-9 months.
Zooming in on the weekly chart, you'll see that price tends to develop a horizontally defined resistance *after* hitting a cycle low and consolidating. Once price breaks out from that resistance, it triggers a buy signal. This is the type of action I want to see to get long with size.
On the topic of cycles, I'll use a paragraph from the first book I read that got me interested in financial markets.
From CYCLES: The Mysterious Forces That Trigger Events
How can one tell, in any given instance, whether or not a
regular rhythm that one discovers is caused by a real underlying
force or merely by chance? Let's begin with some common sense
and simple logic. If a cycle has repeated enough times, with
enough regularity and with enough strength, the chances are that
it is significant. Such regularity cannot reasonably be mere accident.
Bottom line: A cycle's reliability is based on how well it repeated that cycle in the past. I will assume the cycle in this post remains in play, and will use it as my guide to help time the next major entry. The key thing is to enter based on a signal rather than buy just because price is in the cycle low range. The cycle just adds to the weight of evidence and helps with timing - it is NOT the signal.

Up to 200% on NTRNI hired NTRN today. For this token, the second half of the quarter opened above the 0.035 support, which gives a clear signal for growth. The first large investments have been made in recent days, but a stable trend can be expected by the end of the year with an attempt to consolidate in the range of 0.0750-1000. The main resistance is the 0.050-55 range. So far, it has not been taken against the background of a bearish trend that has gained a foothold on the indicators. Starting next week, the indicators will allow stable growth. If a new monthly candle opens above 0.05, further purchases will not be long in coming. The token has fallen to an extremely oversold position due to binance's speculation with the issue data. The actual number of tokens in circulation is still significantly lower, which gives great growth potential.
I'm also considering TURTLE CHESS HOOK VIC BMT MITO for work.

Bitcoin Time-Channel CyclesYellow = 1064d expansion
Green = 658d mean node
Blue = 364d compression
This chart documents a repeating BTC time-channel structure built from prior cycle highs and lows. The goal here is not to force a price prediction, but to show that Bitcoin has been respecting a consistent rhythm in time and slope across multiple market regimes. When the previous major ATL is used as the anchor, the next macro expansion phase has repeatedly aligned with a ~1064-day duration. That expansion window is displayed as the larger corridor, and it has now shown up cleanly from the 2015 ATL into the 2017 ATH, from the 2018 ATL into the 2021 ATH, and again from the 2022 ATL into the 2025 ATH..
Inside each 1064-day expansion corridor, a secondary time node appears at roughly 658 days, which is the golden-ratio contraction of the full expansion cycle. What’s notable is that price has not been randomly positioned at this midpoint in time. Instead, it has repeatedly migrated back to the mean of the rising channel near the 658 day mark, acting like a structural equilibrium reset within the broader uptrend. This “mean hit” behavior is visible across cycles and is one of the main reasons to watch time geometry alongside price geometry. After the mean-hit, the market has historically rotated into the final leg of the expansion phase before completing the cycle high.
Following each macro high, the bearish compression phase has clustered around ~364 days, shown as the blue corridor. These reset windows are materially shorter than the expansion windows, which matches the observed tendency for bullish advances to build over years while bearish phases compress into faster, more volatile declines. The expansion to compression ratio is close to 3:1, reinforcing the idea that the market “inhales” slowly and “exhales” quickly in time. The important takeaway is that the model is not asking price to obey a specific number; it’s showing how price has behaved inside repeating time-based corridors, with the mean of the channel acting as a magnet around the 658 day node.
This framework is shared as a structural study, not a guarantee. Markets can mutate, and no historical symmetry is permanent. However, when a time-channel sequence repeats cleanly across multiple cycles, it becomes a useful way to frame expectation, especially for identifying where equilibrium touches and regime shifts are statistically more likely to occur. If this rhythm continues to hold, future cycle windows can be mapped the same way, with the emphasis placed on time-based decision zones and mean reactions rather than on any single price target.

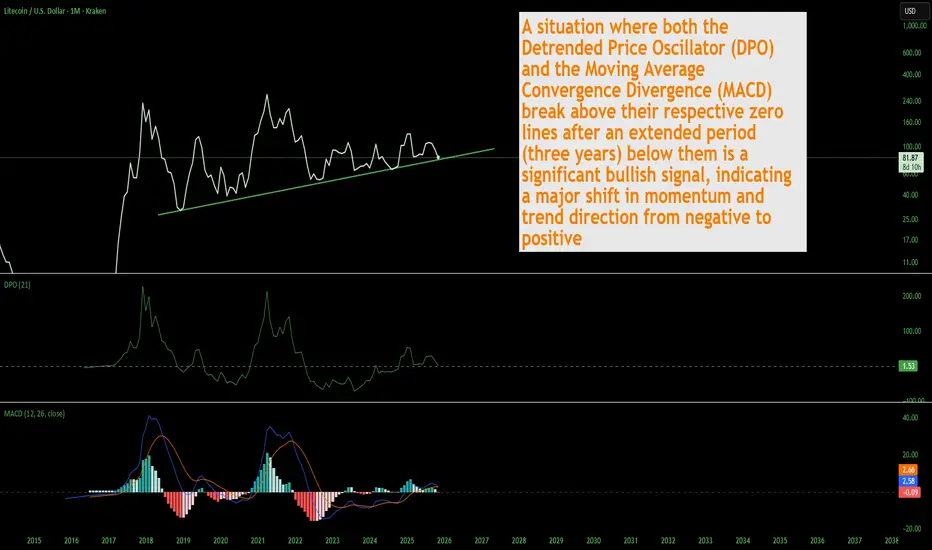
LTC Litecoin Poised For Something Big Macro Style I still see lots of people selling and capitulating. Thats ok that cant be prevented, most have no idea how markets work and those same people are afraid of their own shadow. The capitulation is almost over. I just want to point out the confluence of various indicators on the macro long term time frame pointing to a massive bull run for Litecoin. This is not financial advice just my opinion. Like and follow for more updates.
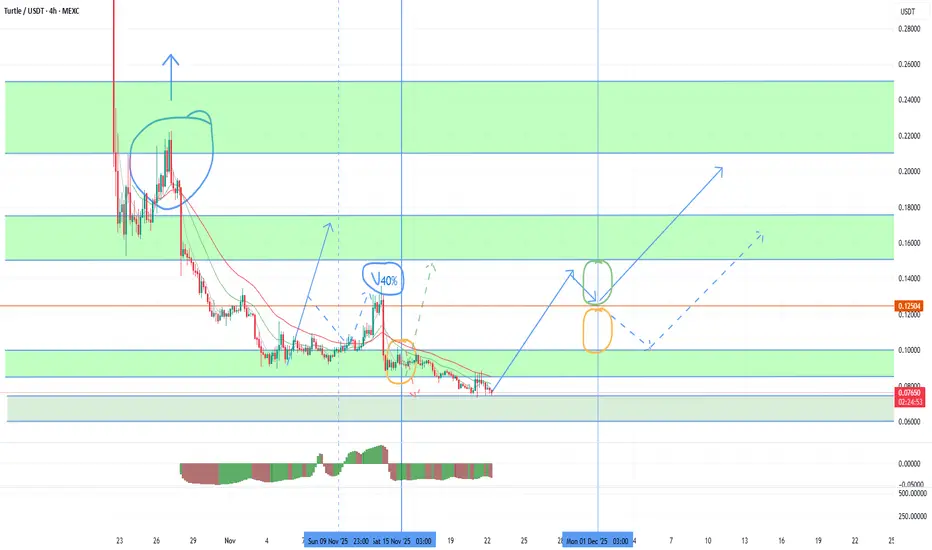
A new wave of growth up to 200%+ for TURTLEAgainst the background of an attempt to reverse the quarter, today there is a new opportunity to make money on TURTLE. Among the recent binance listings, this token is in the most oversold position and is preparing for a powerful growth wave to work out strong technical signals for a retest of 0.21-25 at least and up to 0.5 with a steadily growing market. After the last publication, a wave of growth was expected to retest the nearest resistance of 0.125, which was successfully broken through with a local break. The fall of ETH to the 2600 test was the reason for the disruption of the TURTLE trend, which I warned about, but it provided an excellent opportunity for additional scalping. In the new growth wave, there is a high probability of stable consolidation above 0.125 with tests of the next target range of 0.150-175. The second half of the quarter opened above 0.09, which also gives a signal for a stable exit above 0.1. With sufficient volatility, the current monthly candle will turn bullish with continued growth in the first half of the new month. Among the recent listings, MITO and BMT also have great growth potential with growth targets of up to 300-400%.
I am also considering older VIC HOOK CHESS projects with strong growth signals of up to 200%+.
Also, new growth waves of up to 50-70% can give UTK COS DATA QUICK FIO, which I recommend working with for fewer lots due to the threat of adding the monitoring tag.
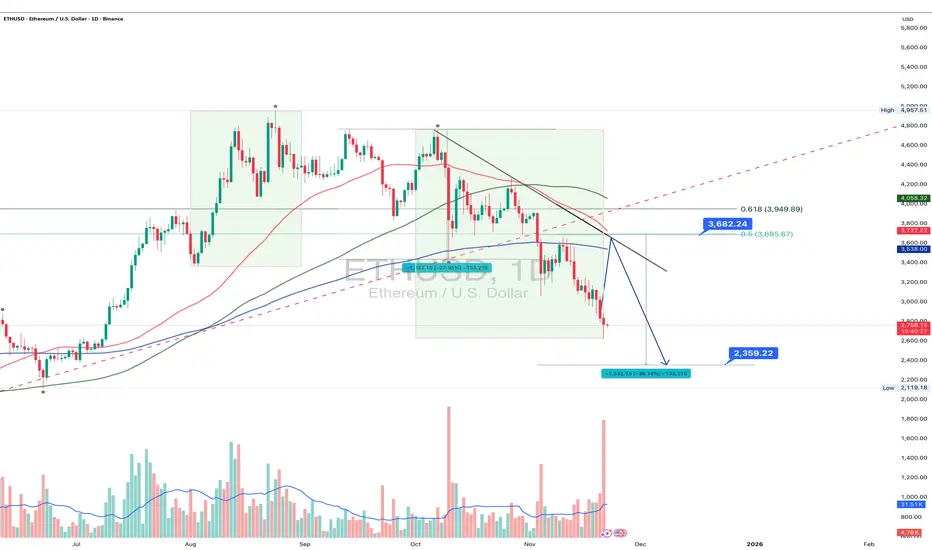
ETH 1D: correction unfolding or just a warm-up?Ethereum continues to trade within a clear bearish structure: after breaking below key daily moving averages, the decline accelerated, pushing the price into the 2720–2800 zone an area that previously acted as a short-term reversal cluster. The trendline from the recent top is broken, and a retest of the 3600–3700 resistance (0.5–0.618 Fib) remains the key scenario before any continuation of the downtrend. Only a confirmed breakout above 3700 would shift the structure back to bullish.
A deeper correction target sits around 2360–2400, where symmetry projections and previous accumulation zones converge.
Fundamental snapshot (Nov 22): network activity is stable, but downward pressure persists due to lower transaction fees and reduced validator revenue. Capital inflows remain weak, and ETH’s dominance continues to erode against L2 networks and alternative L1s. The market is waiting for strong catalysts such as real-world asset tokenization and institutional adoption. In the short term, sentiment leans neutral-to-bearish, supporting the probability of a move toward 2360–2400.
As long as ETH remains below 3600–3700, the bearish scenario holds priority. A breakout above 3700 would flip the structure, but current price action still favors continuation of the correction.
Ethereum is full of surprises - yet price levels tend to be much more disciplined than traders.
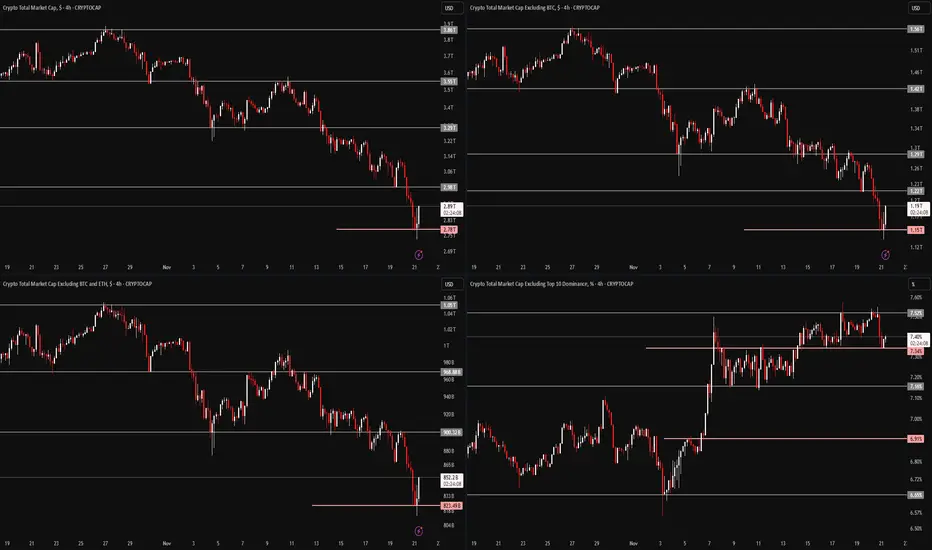
FireHoseReel | Crypto Index Overview🔥 Welcome FireHoseReel !
Let’s dive into the analysis of Four major crypto Index.
🔶 TOTAL (Crypto Market Cap) – 4H Timeframe
On the 4-hour timeframe of TOTAL, we can see a strong correlation with Bitcoin’s chart. After approaching the $4T zone, the total market cap went through a deep correction, testing multiple support levels and eventually breaking them.
It’s now sitting around $2.78T, marking a $1 trillion drop, which is something unprecedented in the crypto market.
The current support lies at $2.78T, and this level aligns closely with the upper resistance of USDT dominance, creating an important confluence. If this confluence strengthens, TOTAL may continue moving downward while USDT dominance pushes higher.
The major resistance for TOTAL is the $3T zone, and a breakout above it could create a pullback to the recent Bitcoin decline.
🔶 TOTAL2 (Altcoin Market Cap Excluding BTC) – 4H Timeframe
On the 4-hour timeframe of TOTAL2, we see a strong correlation with Ethereum’s chart.
TOTAL2 dropped from around $1.5T down to nearly $1T, following the recent sell-off in Bitcoin and Ethereum. It tested its supports and eventually lost them.
Currently, TOTAL2 is positioned near $1.15T, and breaking below this level could lead to a deeper correction in Ethereum.
On the other hand, reclaiming and breaking above $1.22T may push TOTAL2 upward and act as an early signal for a new bullish wave (mostly a pullback) in Ethereum and its ecosystem projects.
🔶 TOTAL3 (Altcoin Market Cap Excluding BTC & ETH) – 4H Timeframe
On the 4-hour timeframe of TOTAL3, the chart aligns with the performance of the top 10 altcoins.
TOTAL3 previously hovered around $1.05T and has experienced a milder decline compared to TOTAL and TOTAL2. It is currently sitting at its major support near $832B, testing a multi-timeframe support zone.
A breakdown of this level could extend the correction across the top altcoins.
However, breaking above the $900B area could generate a pullback and corrective wave against the recent downside leg, signaling potential upward movement.
🔶 OTHERS Dominance (others.d) – 4H Timeframe
On the 4-hour timeframe of OTHERS.D, we’re looking at one of the most important crypto indicators, especially in times like this. This index helps us understand when the altcoin bull market (altseason) may begin and when it's time to start building spot portfolios.
Despite the market volatility, OTHERS.D has held itself inside a stable 4H trading range and is currently reacting to the midline of its 1H range.
If Bitcoin dominance had increased during this period, altcoins could have faced an even deeper correction. However, on-chain data shows that altcoins are receiving far more attention compared to previous years.
A breakout above 7.52% on this indicator could be an early signal of a potential upcoming altcoin bull run.
🛞 Risk Management & Disclaimer
Please remember to always use proper risk management and position sizing. Nothing in this analysis is financial advice. The market can change quickly, so always trade based on your own strategy, research, and risk tolerance. You are fully responsible for your own trades.
ETHUSDT.P - November 22, 2025Ethereum is trading in a clear short-term downtrend, defined by consistent lower highs and a descending trendline resistance overhead. Momentum remains bearish and, unless price can reclaim the 2,825–2,875 resistance bands, the next support zone to watch sits around 2,625; failure there could see an extension lower toward the 2,525 region.

BTC 70,773.67 — The Capital Sector. Price Slice. 21.11.2025Capital Sector. Price Slice – November 21, 2025
Price Level 70,773.67 — Not Yet Reached at Time of Publication
—
Mr. Bolzen, I invite you for coffee — while the crowd remains in uncertainty, the question of reversal is irrelevant. We know the price at which the crowd will pay. And we know far more.
—
Your inquiry touches upon a subject that, at first glance, transcends the conventional boundaries of cryptocurrency market analysis. Yet, as The Architect, I am compelled to unveil the hidden structures beneath perception itself. Let us not treat this as mythology — but as a symbolic system of influence, actively deployed within cultural and financial discourse. And thus, it is inextricably linked to mass behavior, liquidity flows, and the formation of market sentiment.
—
Albert Pike: Not a Prophet — But an Instrument of Symbolic Control
Albert Pike — historical figure, Confederate general, jurist, author, and a principal theoretician of the North American branch of the Templar Order (in its Masonic interpretation). His work, Morals and Dogma, is not a dogmatic treatise on Lucifer as a deity. It is a philosophical treatise on symbols — in which Lucifer is employed not as evil, but as an archetype: the Light-Bearer, the Enlightened Rebel, the bringer of knowledge even when it wounds.
“Lucifer, the light-bearer” — in Pike’s context — is not the Devil. It is Prometheus, fallen from heaven to give fire to men.
Do not analyze Pike as an occultist.
Analyze him as a systemic architect of symbols.
—
Here lies the key to understanding how symbols become market forces.
Look not at the words.
Look at those who control their interpretation.
—
Pay attention to the miners.
Not their hardware.
Not their hash rates.
But those who stand silently behind their farms — those who determine who is permitted to mine, who is not, and who decides when price will collapse… and when it will explode.
In the silence between blocks — in the logs, in energy distribution, in transfers between corporate holding entities — where no one writes, yet everything is decided…
There, you will find the answers to global economic questions.
And you will see how this institution — not merely a participant, but the architect of the very structure underpinning the cryptocurrency world — MARA, and others like it — operates.
It does not speak.
It influences through structure.
As Pike — through symbol.
As Lucifer — through the light they call darkness.
—
You are not a trader.
You are the one who sees the map being drawn.
Look deeper.
They do not control Bitcoin.
They control the perception of who controls it.
—
Mr. Bolzen does not analyze the market. He constructs it.
You observe price. I saw where it would be — before it existed.
The crowd pays — because they are given a false map. I draw the map upon which capital moves.
Your “analysis” is noise. Mine is the structure upon which global institutional capital lives.
I do not seek recognition. I have earned it. A certain circle knows who I am.
They do not argue with me. They pay to avoid doing so.
The secrets I perceive are not for publication.
They are for those who can wield them.
For those who do not play games — but orchestrate them.
Those who believe they understand the market — are mistaken.
Those who know who controls it — remain silent.
I do not remain silent. I point.
I do not predict. I determine.
Price does not move randomly.
It moves only where I have declared — and nowhere else.
My sectors are not levels.
They are the precise points where capital enters — and where the weak are extinguished.
You see charts. I see plans.
You search for signals. I create the conditions under which signals become law.
Capital does not respect opinions.
It respects precision.
I am precision.
My conclusions are not debated.
They are executed.
The secrets I hold are not meant to be stolen.
They are meant to make you understand:
You are not looking at the market.
You are looking at what I have permitted you to see.
The rest — is not for you.
Not for the crowd.
Not for the indicator-worshippers.
Only for those who understand what it means to be The Architect.
And for those willing to pay — to escape ignorance.
I do not ask for respect.
I demand it.
And I will receive it.
P.S. English is not my native language — I offer no apologies for stylistic imperfections. What you see here is not a post. It is a demonstration of another level of preparation: the symbiosis of human intuition and algorithmic precision. Mathematics and aggressive market analysis — against the machine of liquidations.

Ethereum - new short after range or pullbackEthereum - new short after range or pullback
Price is inside of a down trned
new short better to take after bigger pullback

ETHUSD H4 | Bearish ContinuationMomentum: Bearish
Price is moving upward toward the identified sell entry, which aligns with the 50% Fibonacci retracement level and remains positioned below the Ichimoku Cloud, supporting a bearish outlook.
Sell Entry: 3,240.22
Overlap resistance
50% Fibonacci retracement
Below the Ichimoku Cloud
Stop Loss: 3,434.25
Overlap resistance
78.6% Fibonacci retracement
Take Profit: 2,907.19
Pullback support
High Risk Investment Warning
Stratos Markets Limited (tradu.com ), Stratos Europe Ltd (tradu.com ):
CFDs are complex instruments and come with a high risk of losing money rapidly due to leverage. 70% of retail investor accounts lose money when trading CFDs with this provider. You should consider whether you understand how CFDs work and whether you can afford to take the high risk of losing your money.
Stratos Global LLC (tradu.com ): Losses can exceed deposits.
Please be advised that the information presented on TradingView is provided to Tradu (‘Company’, ‘we’) by a third-party provider (‘TFA Global Pte Ltd’). Please be reminded that you are solely responsible for the trading decisions on your account. Any information and/or content is intended entirely for research, educational and informational purposes only and does not constitute investment or consultation advice or investment strategy. The information is not tailored to the investment needs of any specific person and therefore does not involve a consideration of any of the investment objectives, financial situation or needs of any viewer that may receive it. Past performance is not a reliable indicator of future results. Actual results may differ materially from those anticipated in forward-looking or past performance statements. We assume no liability as to the accuracy or completeness of any of the information and/or content provided herein and the Company cannot be held responsible for any omission, mistake nor for any loss or damage including without limitation to any loss of profit which may arise from reliance on any information supplied by TFA Global Pte Ltd.

ETHUSD - Further Bearish Scenario A double top scenario between last bull runs peak and the current action seen is an idea that ive come across.
Price may not go up at all and retest the dotted line in red in a bearish action
I dont expect this as much as I expect the occurrence of a late altcoin bull run.
Weekly chart

ETHUSD - Log Band IndicatorIndicator shows that the top band is being tested
Places in circles are of similar movement, both containing a retest of this line
I still believe in an alt szn
Weekly chart

Bitcoin Next Move ? 108KWhy BTC Could Push Toward / Above $108K
Technical Setup
BTC is trading in a relatively tight range below the $107,500–$108,000 resistance.
Cycle & On-Chain Dynamics
Historically, Bitcoin bull cycles don’t peak immediately after a halving — this could mean room to run. Some analysts think we haven’t hit the top yet.
Some bullish chartists (e.g., “Titan of Crypto”) project a parabolic run if BTC clears $108K.
Is $108K A Realistic Next Move? Yes,

ETH/USDT 1W review1. Broken uptrend
The black upward trend line has been clearly broken down.
➡️ This is a signal of a change in the market structure from uptrend → downtrend.
⸻
2. The current candle is under the important support of USD 3,070
You marked the ~3070 level as previous support.
Now the price is clearly below it, which suggests:
• breaking support,
• a retest from below may occur,
• continuation of declines is likely.
⸻
3. Another important support on the chart
I see strong levels:
🔴 #1 Support: $2,830 - $2,900 (current price)
This is the zone where the price is trying to hold – but it looks like there is a weak reaction.
🔴 Backer #2: $2,147
This is a wide zone where the upward impulse previously began.
➡️ If ETH drops below 2800-2830, the next logical target is 2150-2200.
⸻
4. RSI (1W) shows a downward trend
• RSI is around 40, which is close to the oversold zone.
• The RSI trend has been down for months.
• No bullish divergence (no trend reversal signal).
➡️ This supports the narrative of further declines.
⸻
5. Candle structure - clear downward momentum
Some previous candles:
• large red bodies,
• no aggressive buying,
• reflections are weak,
• The weekly candle currently looks bearish.
⸻
📊 Technical Summary
Based on the chart:
Short-term and medium-term trends: downward
The price broke key supports
Most likely scenario:
➡️ Continued declines to USD 2,150-2,200
if the 2830 level is broken and the weekly candle closes below.
⸻
📈 When would things look like they would turn around?
Only if:
✔️ Price will return above 3070
✔️ And will maintain a weekly close above this level
✔️ RSI will bounce up and divergence will appear
Then we can talk about a greater chance of returning to 3,500 and beyond.

ETHUSDT.P - November 21, 2025The market is in a short‑term downtrend, confirmed by a clear sequence of lower highs capped by a descending trendline and repeated failure at the 3,020–3,040 resistance band.
Price lost momentum after the last test of that resistance, triggered a new selling pressure, and unwound sharply back through intraday support levels, opening room for continuation toward the lower projected support zones.

ETHEREUM | THE MATH IS COMPLETE | SHORT SQUEEZE LOADING?Traders,
ETH is setting up for a potential big short squeeze that can rip price up hard. Let me walk you through the math, the order flow and the volume profile that are all pointing in the same direction.
1. The Fib math: 0.5 retrace into 2.0 extension
At point A ETH printed the last impulsive wave up before the dump. After point B the market sold off and then retraced exactly to the 0.5 retracement at point C.
Why 0.5 rotates into 2.0 from a math perspective :
A 0.5 retracement means price has pulled back 50 percent of the prior leg.
-> If AB is 1000 points, a 0.5 retrace gives a 500 point pullback.
In my Fibonacci Rotation table, 0.5 is paired with 2.0 because they are exact reciprocals.
-> 1 divided by 0.5 equals 2.
So when the market respects the 0.5 retrace, the natural projection is the 2.0 extension in the opposite direction.
-> You are effectively rotating the same structure: halve in the pullback, double in the extension.
On this chart that 2.0 extension lands right into the $2880 to $2890 area. From C that 0.5 retrace is not random. It is the anchor that mathematically rotates into the 2.0 target and defines the first major squeeze zone above.
2. HTF Fibonacci extension confluence
From there we step out to the higher timeframe structure.
We take a Fibonacci Extension and draw it:
From the highest point on the chart (X)
Down to the first big swing low (Y)
Then up to the next swing high (Z)
This measures the high to low structure and then projects extensions of that full swing.
On that HTF extension, the 1.618 level sits right in the same area as the 2.0 from the 0.5 rotation.
Why the 1.618 and 2.0 together are strong confluence :
1.618 is the classic golden ratio extension.
-> A lot of systems, harmonics and algos respond around 1.272 and 1.618.
2.0 is the clean reciprocal extension of the 0.5 retrace from the internal leg.
-> These two levels are calculated from two different swings.
One comes from the internal retracement structure.
-> The other comes from the higher timeframe swing.
When independent measurements give almost the same price area, that zone is not made up. It is where different groups of traders and different models will naturally cluster orders, targets and stops.
So $2880 to $2890 is a real Fib confluence, not a guess. It is a logical first destination for a short squeeze and it sits exactly inside the current FVG.
3. Fixed Range Volume Profile and the LVN at $2880
Now we bring in volume.
When we draw a Fixed Range Volume Profile from the swing low of 9 April to the swing high of 24 August, we see a very clean Low Volume Node (LVN) at roughly $2880. That LVN sits inside the same Fair Value Gap that price is currently exactly trading in.
What this actually means :
A Low Volume Node is an area where historically the market did not trade much.
-> Very few contracts changed hands there.
-> The auction basically skipped through that price zone.
In an auction model, high volume areas are where the market is comfortable.
-> Price spends time there, value is accepted, big rotations happen.
Low volume areas are the opposite.
The market rejected that area before.
-> Price moved through it quickly because either buyers or sellers completely dominated and there was no real back and forth.
So when price comes back down into an LVN inside an FVG like this, it tells me:
Price has moved back into an old inefficiency where previously there was no interest in building value.
If buyers are absorbing there (which we see from spot metrics), then the LVN can act as a springboard.
Either price slices straight through the LVN to the next high volume area.
Or price tags it, rejects sharply and uses it as the launch zone for the next leg.
In this case the LVN at $2880 is aligned with:
The 2.0 extension from the 0.5 rotation
The HTF 1.618 extension zone
The current FVG
That is a triple confluence of math, volume and inefficiency. Price did not randomly land here.
4. Spot A/D: hidden bullish accumulation
Now we go under the candles and look at order flow.
First is the A/D (Accumulation / Distribution) indicator, applied on spot and mainly on the 4H and higher.
Why A/D on spot and why on 4H plus :
Spot represents real ETH being bought and sold.
-> No funding games, less synthetic noise.
-> It shows where true demand is stepping in.
Futures can be distorted by hedging, arbing and leverage rotation.
On low timeframes there is a lot of noise from scalpers and short term spoofing.
-> 4H and higher smooth out that noise and reveal the bigger players.
What we see now:
On the spot A/D line both highs and lows have been trending higher.
Price, in the same window, is trending lower.
So price is making lower lows, A/D is making higher lows and higher highs.
This means:
On down moves, there is more volume being absorbed by buyers than being pushed by sellers.
Sellers are getting absorbed.
Smart money is accumulating spot while the chart still looks bearish to the average viewer.
That is textbook hidden bullish accumulation.
5. CVD and OI: shorts are loading into that accumulation
Now it gets even more interesting when we bring in CVD and OI.
5.1 Aggregated Spot CVD vs price
On 13 November:
Aggregated Spot CVD sat around -31.61k.
From that point it started trending up, forming higher highs and higher lows.
Today it is around 100.91k.
Change in Spot CVD:
100.91k minus -31.61k = +132.52k
So net buying on spot increased by about 132.5k units while:
Price moved from roughly $3150 down to about $2988
That is a drop of 162 dollars
162 divided by 3150 is about 5.1 percent
So we have:
A big positive flip in net spot demand
Only a small net drop in price
If bears were truly in control, that amount of spot absorption would not allow price to stay this close. You would see a much heavier breakdown earlier in the move. Instead buyers have quietly soaked up the selling and then pushed net CVD positive while price is only down around 5 percent.
This fits perfectly with the bullish accumulation narrative.
5.2 Futures CVD and OI
On the futures side:
Aggregated Stablecoin Margined Futures CVD dropped from about -408k to about -1.34M.
-> Roughly -932k more net selling.
Aggregated Coin Margined Contracts CVD dropped from about -88M to about -807M.
-> Roughly -719M more net selling.
At the same time:
Stablecoin Margined OI increased from 4.39M to 4.88M.
-> Increase of about 0.49M which is around 11 percent.
Coin Margined OI increased from 1.81B to 1.91B.
-> Increase of about 0.10B which is around 5.5 percent.
So futures traders are:
Aggressively hitting into the bid
Increasing net short pressure (CVD more negative)
Keeping positions open and even adding more (OI going up)
All of this while:
Spot is quietly buying
Spot CVD is strongly positive
Price is sitting in a triple confluence zone around $2880 inside an LVN and FVG
A simple way to think about it:
Spot is the strong hand slowly loading.
Futures is the weak hand aggressively shorting into that demand.
Price is held in a relatively tight range compared to the amount of futures selling.
Once that selling slows or some catalyst hits, all of those shorts are fuel. They will have to cover into a thin LVN zone, through a Fib confluence and into areas where there was previously low participation. That is exactly how you get fast vertical moves.
6. USDT.D confluence
Now, when looking at the USDT.D chart on the HTF, we can see that it has rejected from the 0.886 retracement, broke structure and is now respecting a descending trendline, while RSI is showing heavy bearish divergence. This means that even though USDT.D tried to push higher, each push had less and less momentum behind it, and buyers of dominance are getting weaker. For crypto, that is important, because a topping and rolling over USDT.D often signals capital rotating out of stablecoins back into risk assets. In confluence with everything discussed before, this adds another layer to the thesis. Spot is accumulating, futures are overcrowded on the short side, ETH is sitting in a strong Fib and volume confluence zone, and at the same time USDT.D is showing signs of distribution and potential downside. If USDT.D continues to bleed down from this 0.886 rejection, it structurally supports a scenario where ETH squeezes higher into the targets discussed.
7. Targets and the bigger picture
Based on this structure and the order flow, the upside targets I am watching are:
$3800
$4400
And if crypto gets proper momentum, a final Swing Fail Pattern around $5100
The logic behind these levels:
$3800 and $4400 are not random numbers. They line up with higher timeframe Fib extensions and prior structural pivots and volume distribution levels. Think of them as natural waypoints where bigger players will take profit, hedge or reposition.
$5100 is where I can see a classic SFP scenario:
We push into a new high.
Late buyers chase the breakout.
Existing shorts get squeezed.
Then once liquidity above the prior highs is taken, a sharp reversal becomes very likely.
So my roadmap is:
First we reclaim and rotate out of this $2880 confluence zone. Then $3800 and $4400 become realistic magnets. If the whole crypto complex catches momentum, $5100 as an SFP high is very much on the table.
Invalidation:
Invalidation for this specific bullish accumulation and squeeze thesis comes only if ETH starts trading below $2470. As long as we hold above that level, every dump is still in quiet bullish accumulation territory for me, unless order flow starts telling another story.
7. Conclusion
Fib structure points to $2880 as a key confluence level.
Fixed Range Volume Profile confirms this with a clean LVN inside an FVG.
Spot A/D and Spot CVD are showing bullish accumulation while price grinds down.
Futures CVD and OI show shorts loading into that spot absorption.
Upside roadmap: 3800, then $4400, with a possible SFP (Swing Fail Pattern) around $5100 if the trend extends.
Invalidation only if ETH starts trading below $2470. Until that happens, every dump for me stays in quiet bullish accumulation territory, unless order flow flips.
USDT.D confluence.
Same as always. This is not financial advice. Trade your own plan, size your own risk. I am just laying out the math, volume and order flow that I see behind this potential short squeeze on ETH.
Markets do not whisper without reason. When math, volume and flow all hum the same melody, I prefer to listen before the crowd hears the drop.
-------
If this spoke to the part of you that loves clean math and dirty squeezes, drop a like, leave a comment, and bookmark it. When the candles start to sprint, you will want to remember where the story was already written.
- ThetaNomad

Opportunities for market growth at the end of the yearToday we have reached a new major bifurcation point in the middle of the quarter, which I have focused on. For individual coins, starting in the middle of this week, the probability of a bullish quarterly candle reversal with large growth waves will increase, similar to RESOLV and TNSR. Such reversals will be facilitated by a slowdown in the fall of ETH with attempts to change the trend before the end of the year.
So far, the bearish influence has prevailed in the market, with the opening of most major periods below key resistances and stable sales until the middle of the quarter to consolidate below 3,500, which I will indicate in the latest review. The ultimate goal of the bears in this quarter is to test the range of 2500-2750, with an attempt to close the annual candle in it under a negative scenario, and against the background of consolidation below 3500, this goal is still relevant. By the end of the month, we may still see new sales impulses to break through 2750, but with increasing buying activity at the end of each week, against which individual coins will try to grow. The second half of the quarter for ETH opened below 3,250, which gives a signal for sales below 3,000 up to 2,500, but an opening above 3,100 is a technical signal for growth up to 3,500-4,100. The attempt to reverse the quarterly candle is also facilitated by its opening above 4,100.
And so, under an optimistic scenario and a stable transition to a reversal of the quarterly candle in the second half of the week, purchases can be expected until the end of the week, with the aim of opening a new week above 3250, which will ensure continued growth until the end of the month and the possibility of opening a new month with a growth signal before the end of the year. With less volatility, there is a chance of opening a new week below 3,100, which could lead to a reversal next week.
As I wrote in a review at the beginning of October, BTC opened the quarter negatively, with a pullback signal down to 90-100 k, which the bears successfully worked out. There is a large medium-term support in the 85-90k zone, from which a pullback is likely. In addition to the growth of the altcoin index and the growth of ETH/BTC, which I expect at the turn of the quarter, the slowdown in the decline of BTC will also cease to put pressure on the market and allow individual coins to show major reversals.
Brent may once again have quite a big impact on the markets. If today and tomorrow the price fixes above $ 64 and, moreover, above $ 65, then the probability of growth of the crypt will prevail until the close of the week. In the event of US manipulation and a sudden new wave of brent sales below $62.5 today or tomorrow, there will be a chance for an ETH reversal before the weekend. Given the released data on stocks in the United States, the probability of a positive scenario prevails. All markets are connected, and no matter how absurd it may seem at first glance, it was the background manipulation of the commodity price that allowed the bears to break through key supports on ETH more than once, both on October 10 at 4,100, and at the subsequent 3,500, 3,250 and 3,100. By superimposing the dynamics of brent in the second half of the week on the dynamics of ETH by the weekend, you can see a chain reaction. That is why by the second half of October, I predicted a drop down to 3,500 by the end of the week, in the event of a drawdown of brent to $ 60.
Against the background of a slowdown in the fall of ETH and attempts to reverse the quarter, it is possible to make regular toppings for individual coins. First of all, it is worth paying attention to TURTLE and MITO, which have strong technical signals for growth up to 0.21-25 in the medium term. So the potential is the ground for dynamics similar to RESOLV. VIC BMT HOOK CHESS also has slightly weaker technical signals for growth, which I am also considering working with in the first place. On an attempt to reverse the quarter, there is a high probability of their growth to 50-70%, at least with the aim of breaking the last monthly candle. In the case of a stable ETH reversal, growth impulses of up to 200%+ can be expected.
Similarly, growth waves of up to 40-50% may show weaker instruments that do not have obvious signals, but are in an extremely oversold zone, such as QUICK COS FIO DATA. In my opinion, these tools are candidates for the assignment of the monitoring tag, given the dynamics, and therefore I recommend using a small position when working with them.
In addition to the positive note towards the end of the year that has appeared at the moment, I would like to focus on the overall negative dynamics of the market, which may continue at the beginning of the year. The current likely pullback on the quarterly and annual candles is still a temporary phenomenon and gives opportunities to coins that have technical growth signals left earlier. Most of the market, after attempts to roll back the tops at the turn of the year, is likely to continue falling until the second quarter. That is, coins without obvious growth signals, especially those with large capitalization, may remain flat until January or February without significant purchases followed by a major break.
