Ethereum’s Hidden Fractal Points to $33K by November 2026Most of the space seems to think that the bull market is officially over, that the four-year cycle has come to a close. For most of the cycle, I have thought that way too. 1,064 days is up, and that’s the longest a Bitcoin cycle has ever gone for. So, the idea that the same thing will play out again is very valid, and it’s entirely possible that it is indeed the end. However, my stance is very different — I still think we have one year left in the tank, and I will present a lot of evidence to support why I believe this and why I’m sticking to it.
If you’ve been following me for a while, you know that we’ve found some very interesting bar patterns in history that keep on repeating, and this will be the primary source of evidence used in my thesis.
Bar Pattern Fractals
I have tested hundreds of indicators over the last six years and bought thousands of dollars’ worth of indicators, and in the end, the highest success rate has come from simply following bar pattern fractals. They repeat over and over. They are hard to find, but once you do, you can ride them for months.
ETH 2017 Fractal
What you see above is a fractal I have been following for months now. It has been mirroring the 2017 cycle, with some parts nearly identical in movement and timing, with only a few small deviations here and there. The macro pattern continues to play out like clockwork.
Take a look at this TA from March 2025. We caught near the bottom, called for max pain, and discussed this fractal that could be playing out. The ETH call was under 2000 back then.
I also published TAs on Chainlink and its repeating bar patterns. It was straightforward for catching big macro moves for LINK.
As you can see, these are just two examples of many fractals I’m following. The main one is ETH because it’s been a 1:1 mirror for the most part. The last spike down was a deviation for sure — well, at first I thought it was on the Bitstamp chart because it has the most historical data for ETH, but when I switched to the Binance chart, I found something very interesting.
A view of the bar pattern fractal is telling us where we are.
When switching to the Binance chart, we see a very interesting wick of 26% that nuked the market during that time — very similar to what Binance has done this time around. You cannot make this stuff up. So at first, I thought it was a small deviation, but in fact, after looking at this chart, it’s still a mirror, even including that huge scam wick of 27%. Amazing.
So as you can see, in terms of the bar pattern fractal, I simply cannot ignore the fact that this keeps mirroring, and if it continues, it’s possible that we have one more year left in this bull market, and that this four-year cycle thesis is, in fact, a massive bear trap.
If we take a look at the monthly candle that shook a lot of players out last cycle before the run-up, we can see that we printed a candle with wicks on both ends — very similar to what we are forming right now.
If we zoom into that moment on a smaller timeframe, you can now see the moves are similar — a big drop into a double bottom followed by a slow grind up. This is how ETH normally puts in bottoms.
Looking at ETH’s RSI levels on the monthly chart — during the first cycle, when it broke the all-time high, RSI was extremely overbought at 87. On the last cycle, it was 82. This cycle, ETH is at an all-time high and the RSI is only 59. We’re not even in the overbought range yet — there’s so much room for ETH to expand, it’s crazy.
Since its inception, ETH has always pulled off the same move: one very aggressive wave with an aggressive pullback, followed by one smaller wave that creates a higher high to finish off the cycle. It’s done this every time.
Which means that if the bar pattern fractal continues to mirror, then wave 1 tops in the first week of January 2026, followed by a massive correction that will again fool everyone into thinking the four-year cycle is 100% over. But what if ETH puts in a bottom in February 2026 and rallies back up to all-time highs? Nobody would believe it — the disbelief would be strong because everyone would have sold the top in Q4 2025 due to the four-year cycle theory.
The second major piece of evidence I’m leaning on is the Russell 2000. Since its inception, the Russell 2000 has done the exact same thing before expansion comes:
Double top
Second drop bear trap
V-shaped recovery back to all-time high
Expansion breakout
Same thing every time. Look at the chart and tell me we’re not going into expansion — there’s a very high chance. The last two times, we got that massive monthly candle breakout in November.
Which brings me to the main point — every time the Russell goes into expansion, Bitcoin has started its most aggressive run. The last three times, Bitcoin went on to break its all-time high and put in a cycle top within an average of 355 days.
Gold, shown above, is so close to the 4.236 extension right now that it would be crazy to buy here. There’s a high chance of a major top coming in, and we’re about to see a major rotation back into Bitcoin with those gains.
Just take a look at the Power of Law model for Bitcoin — the bull market hasn’t even started yet.
It’s crazy that people are calling the cycle top with the Mayer Multiple sitting at 1.19.
Conclusion
My view is that there is one more year left in this uptrend in crypto. Bitcoin has turned into a different beast. It has completely detached itself from the rest of crypto for the most part, but the first expansion is coming in 2026. If the bar pattern does not deviate, then greatness lies ahead.
ETH

$255 Million Insider Buys BTC Demand Zone with 200SMA ConfluenceOn-chain data from HyperDash confirms that an insider with a 100% win rate has entered large long positions totaling $255 million in BTC and ETH. The entries occurred directly inside a strong daily demand zone between 103,623–108,000, supported by the 200SMA and lower channel trendline.
The chart highlights this setup clearly:
Demand Zone (Entry Area): 103,623
Partial Take-Profit Zone: 114,640–116,662 (supply zone and 20SMA resistance)
Major Take-Profit Zone: 122,969–126,272 (upper channel resistance and breakout range)
The timing couldn’t be more significant. The Federal Reserve has just confirmed its Payments Innovation Conference for October 21, 2025, featuring discussions on Bitcoin integration, stablecoin frameworks, and CBDC development. This announcement aligns closely with the insider’s massive long exposure visible on HyperDash.

ETH 4H Analysis | Day 4🥳 Hey everyone! Hope you’re doing great! Welcome to SatoshiFrame channel .
✨ Today we’re diving into the 4-Hour Ethereum analysis. Stay tuned and follow along!
👀 Ethereum, the best and largest altcoin in our market, has also broken its descending trendline just like Bitcoin, and the long position scenario we discussed earlier has pretty much played out — I hope you took advantage of it.
🔍 After breaking through its previous resistances, Ethereum is now facing a new resistance area where some sellers have stepped in and some buyers are taking profits. There’s a possibility of a short-term pause in price movement. This zone has created a trigger for us, and the next, more logical long triggers for Ethereum are at $4,252 and $4,723. A breakout above these levels could kick off a strong upward move.
🧮 Looking at the RSI oscillator, it’s approaching the 70 zone but has been rejected near that level. For a confirmed breakout above $4,078, RSI needs to enter the overbought region. There’s also a support zone around 50, which could act as a rebound area for oscillatory movement. Right now, RSI has two key zones — 50 and 70 — that define its structure.
🕯 Notice the Ethereum volume behavior: to break through both static and dynamic resistance zones, the volume increased — this happened because a large number of sell orders were stacked in that area, and those orders needed to be filled before price could move upward smoothly. After that breakout, buying volume started to decline slightly, meaning both price and volume are now resting. For Ethereum to break this resistance zone, we either need sell orders to be absorbed or short positions to get squeezed by trapped traders.
🧠 We can outline a few possible scenarios for Ethereum’s position — some of them might be slightly more complex to manage:
🟢 Long Position Scenario 1
We need patience and a price cooldown. Wait for Ethereum to touch its nearest support zone, then rise with increasing volume. If during this move we see setup candles along with a resistance breakout, we can enter the position with a tight stop size.
🟢 Long Position Scenario 2
We can use an order-book stop-buy setup at Ethereum’s resistance and place a wider stop to catch any breakout spike. This allows participation in a potential price surge and can yield solid profit — though these setups usually take longer to reach an ideal risk-to-reward ratio.
🟢 Long Position Scenario 3
This one’s less likely but still worth noting: Ethereum could break its resistance with rising volume, then pull back to retest that same resistance (now turned support). Afterward, if we see volume increase, setup candles, and a confirmed pullback breakout, we can enter with a small stop size.
🔴 Short Position Scenario
A short setup would only make sense if the micro-buyer zone fails, accompanied by heavy whale candles, strong selling pressure, and an overall market crash.
❤️ Disclaimer : This analysis is purely based on my personal opinion and I only trade if the stated triggers are activated .

$ETH Macro unchangedNothing has changed for me on the CRYPTOCAP:ETH macro. The pullback was shallow for a wave 2 not even hitting the weekly pivot or 0.382 Fibonacci retracement. We expect wave 2 to be a sharper drop to at least the 0.382.
This has me skeptical about higher straight away without further downside.
If the bottom is in then wave 3 should kick in and be a powerful move into price discovery with initial target of the R5 weekly pivot $8500
Further downside should be expected as we are below major High Volume Node resistance, weekly RSI is bearish with rom to fall. The first target is the weekly pivot at $3200, followed by the rising weekly 200EMA, High Volume Node support and 0.5 Fibonacci retracement at $2600
Safe trading

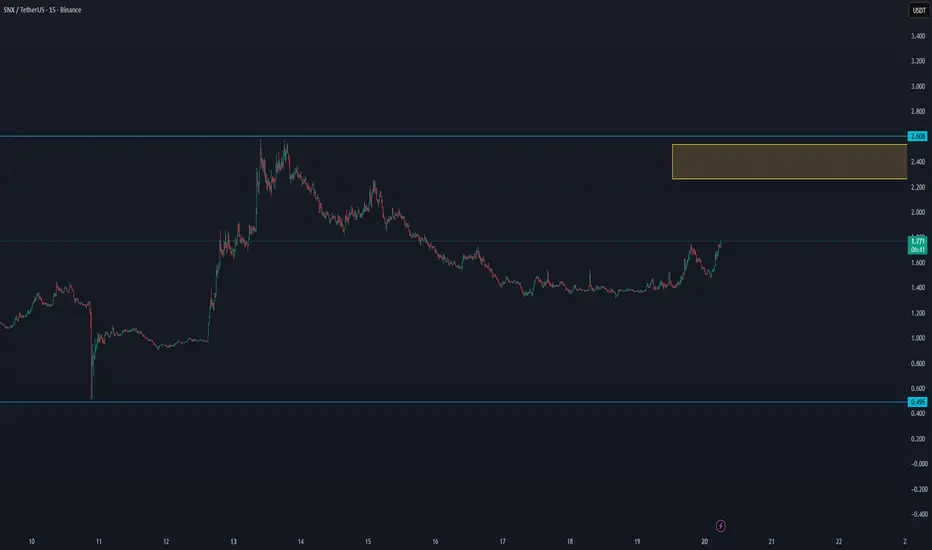
SNX/USDT INCREASE VOLUME On the lower time frames, SNX is showing signs of increasing volume, which could build up over time. For this reason, it’s worth watching SNX closely to see if the trend can break.
BTC/USDT — Volume Strength Returns, Eyes on 110K+ RecoveryBTC/USDT — Volume Strength Returns, Eyes on 110K+ Recovery 🚀
Bitcoin is showing renewed momentum as it re-enters the volume+ zone, signaling stronger market participation after recent consolidation. The move above the low time frame structure confirms short-term strength and suggests a potential continuation to the upside.
Currently, BTC is holding steady around $108.9K, maintaining support within the accumulation range. If momentum continues, a breakout toward $110K+ looks increasingly likely, aligning with short-term recovery signals.
📊 Technical Overview:
Volume Zone: $108K–$109K
Short-Term Target: $111K
Main Resistance: $122.5K
Bias: Positive momentum forming above low time frame
A strong hourly close above $109K would further confirm the shift in trend strength, potentially opening the next leg higher toward $111K–$122K.
📈 Outlook: Bullish short-term structure forming

ZEUS/USDT NEW INCREASE VOLUMEThe last data shows that Zeus has an upcoming volume, which can break in the coming time frames. This token is worth adding to the watchlist to follow the coming trends

ARE NOT BULLISH ENOUGH ABOUT $ETH.ARE NOT BULLISH ENOUGH ABOUT $ETH.
In the 1st and 2nd cycles, Ethereum tested the major demand zone before going parabolic.
Today, the same scene is being re-enacted.
The difference is that most people still leave the theater before the curtain rises.

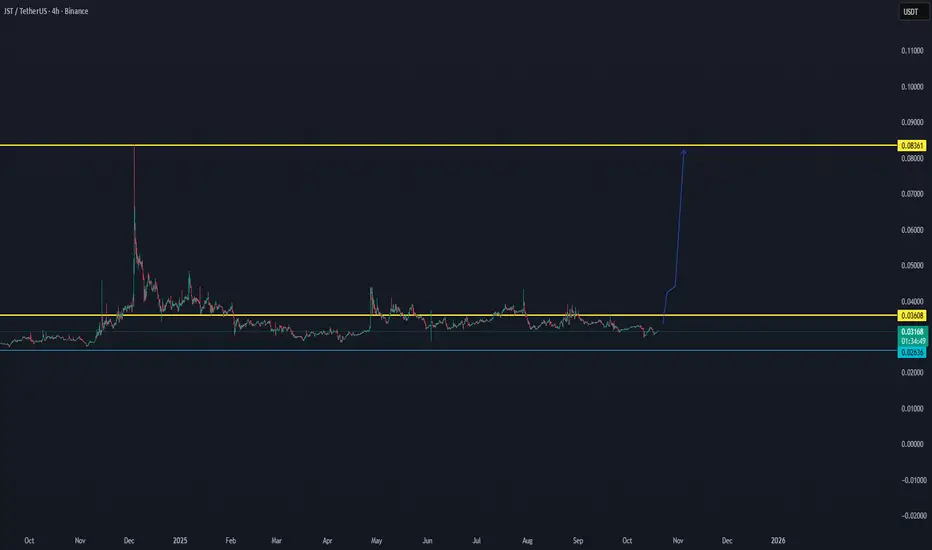
JST/USDT Second BREAKOUT ON WAY..Data view shows that there is a high chance JST can break out for the second time since the last volume data. We will follow these coming time frames to see what is able to do.
Ethereum Testing a Critical ZoneThe crypto market has entered a volatile phase as Bitcoin dips below key support levels and Ethereum struggles to hold its ground. Beyond the technicals, Ethereum continues to stand out both fundamentally and structurally. With institutional inflows returning and CRYPTOCAP:ETH maintaining its leadership in the Layer-1 narrative.
Ethereum is currently trading around $3960, with $3600 firmly holding as the value area low. In the near term, price action suggests that ETH may continue to range between $3,600 and $4,200 before making its next significant move.
However, a decisive break below the $3,600 support would confirm a momentum shift to the downside, potentially opening the door to deeper retracements into $3000 region.
This raises the question: Is this a moment for caution, or a strategic opportunity ahead of a rebound?

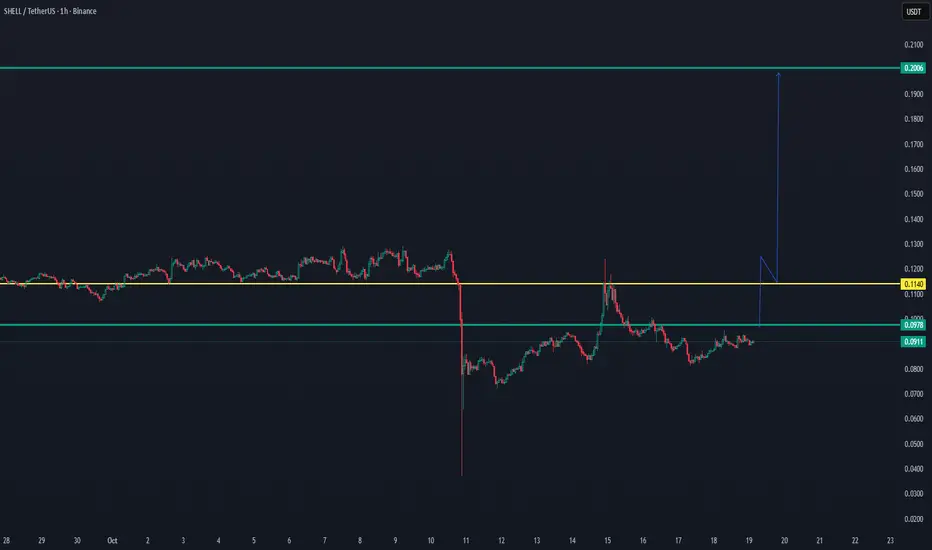
SHELL/USDT — Reclaiming Key Zone, Potential BreakoutThe best DCA coin of the moment for the low cap
SHELL/USDT — Reclaiming Key Zone, Potential Breakout Toward $0.20 🚀
SHELL is currently building momentum near the $0.097–$0.100 zone, after reclaiming short-term structure from its recent drop. This consolidation indicates accumulation, setting the stage for a potential breakout move.
The $0.114 zone remains the key breakout level — a 1H close above it could confirm continuation toward the $0.20 target, aligning with the next major resistance area.
📊 Technical Overview:
Support: $0.090
Breakout Level: $0.114
Main Target: $0.200
Momentum: Recovering with early bullish signals
Once the price confirms above $0.114 with strength, the chart opens a wide “open space” toward the next resistance at $0.20, creating strong potential for a trend expansion.
📈 Bias: Bullish setup forming
🎯 Targets: $0.114 → $0.200
$3,500 ETH Incoming! I AM SHORT!#ETH just rejected from a 4H supply zone. If the bearish PA continues, we will expect the local lows to be taken out and the $3,500 psychological number to be tested.
How long will it take?
Just sit back and enjoy the ride.
Calculate Your Risk/Reward so you don't lose more than 1% of your account per trade.
Every day the charts provide new information. You have to adjust or get REKT.
Love it or hate it, hit that thumbs up and share your thoughts below!
This is not financial advice. This is for educational purposes only.

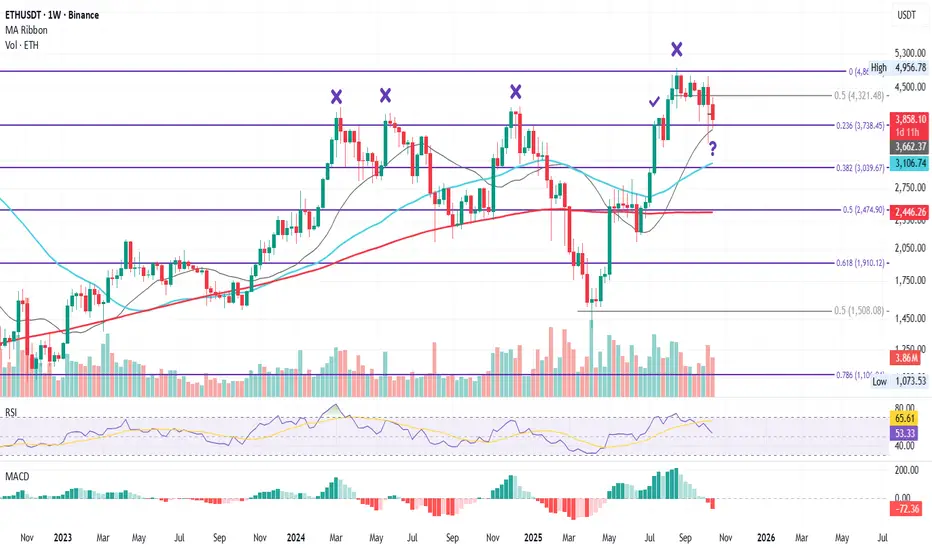
ETH Weekly – Tracking the Fib Battle, Week by Week
This is ETH on the weekly chart.
In this series, the main focus is on Fibonacci levels and the 21, 50, and 200-week moving averages, the key structures shaping ETH’s long-term rhythm.
The goal is to maintain clarity when zooming out from lower timeframes and to understand where ETH truly stands in the broader cycle.
The story here is one of repeated attempts and liquidity hunts.
ETH has tried three times to break through the 0.236 Fib level ($3738) and failed each time, needing deeper pullbacks to reload for another try.
After the first rejection (March 2024), ETH found support at the 0.382 Fib ($3039) near the 21-week MA, which helped fuel a second attempt.
The second rejection sent price lower to the 0.5 Fib ($2474) and the 200-week MA, from which ETH found strength for the third attempt.
The third rejection pushed price all the way to the $1500 zone, but that final deep flush gave enough strength for the fourth attempt, which finally succeeded: ETH broke through the 0.236 Fib.
However, after that success came another test, a rejection at the 0 Fib level ($4868), which now acts as major resistance.
This week, price is retesting the hard-won 0.236 Fib support ($3738), with the 21-week MA sitting just beneath it, forming a potential support confluence zone.
The big question now:
Will ETH repeat its own pattern again; holding the 0.236 Fib and 21W MA to attempt another push toward the 0 Fib level, only to face yet another rejection?
Weekly closes from here will tell the story, one candle at a time.
This chart will be updated each week to track how ETH behaves around these defining levels.
Always take profits and manage risk.
Interaction is welcome.
ETH 4H Analysis | Ethereum price squeeze is reaching its limit🥳 Hey everyone! Hope you’re doing great! Welcome to SatoshiFrame channel .
✨ Today we’re diving into the 4-Hour Ethereum analysis. Stay tuned and follow along!
😅 Yesterday I didn’t get the chance to post Ethereum’s analysis the way I wanted to — but today, I’ve prepared a full 4-hour analysis of Ethereum, and I’d be glad to have you follow along.
👀 Looking at Ethereum on the 4-hour timeframe: after the recent flash crash, ETH formed a support zone around $3,747, then bounced with a strong +10% pump upward. It was later rejected near $4,268 and moved back down, creating a double-bottom structure aligned with the previous support zone — now forming our valid static support.
A descending trendline has been drawn from the rejection points at $4,723 → $3,969, acting as our dynamic resistance. Ethereum is now nearing the apex of this triangle, and we’re waiting for a breakout. Note that this dynamic resistance overlaps with a static resistance zone at $3,969, so a confirmed breakout above that could serve as strong confirmation for a bullish reversal.
🧮 The RSI oscillator shows two key oscillation zones — around 50 and 30, acting as our momentum boundaries. A clean break beyond these zones could bring strong multi-timeframe momentum to Ethereum’s next move and trigger an earlier price breakout.
🕯 In terms of volume, ETH showed heavy selling pressure during the crash, but now, with the formation of a double bottom and clear compression in price, we’re waiting for a volume expansion to confirm direction.
It’s important to note that Ethereum remains the most watched altcoin in the crypto market — if the broader market shifts bullish, ETH could attract significant new buyers and drive capital inflow.
🧠 Based on this analysis, we’ve outlined two high-probability trading scenarios to match Ethereum’s potential reactions:
🟢 Long Scenario: A breakout above both the dynamic resistance and the static resistance at $3,969, combined with rising buying volume and an RSI breakout above 50, would provide a strong signal for opening a long position on Ethereum.
🔴 Short Scenario: A breakdown below the $3,747 support zone, with a strong bearish candle (whale activity) confirming the break of the micro-buyer zone, and an RSI dip into oversold territory, could trigger another wave of selling, presenting a short opportunity on Ethereum.
❤️ Disclaimer : This analysis is purely based on my personal opinion and I only trade if the stated triggers are activated .

ETHEREUM Free Signal! Sell!
Hello,Traders!
ETHEREUM Price has reacted sharply from the horizontal supply area, confirming the presence of institutional selling pressure. A clean rejection signals continuation toward the lower liquidity pool near $3,740 as Smart Money hunts sell-side targets.
-------------------
Stop Loss: $3,888
Take Profit: $3,741
Entry: $3,829
Time Frame: 3H
Setup Risk: High
-------------------
Sell!
Comment and subscribe to help us grow!
Check out other forecasts below too!
Disclosure: I am part of Trade Nation's Influencer program and receive a monthly fee for using their TradingView charts in my analysis.

KMNO/USDT — Bullish Momentum Building Toward $0.10 Breakout KMNO/USDT — Bullish Momentum Building Toward $0.10 Breakout 🚀
KMNO is showing renewed strength after holding its key support zone and forming a steady higher low structure. The current move suggests a shift in momentum, with buyers stepping back in around the $0.066 level.
If KMNO can maintain this recovery and close firmly above the $0.070 zone, the next target area sits around $0.103, marking a potential breakout level for continuation.
📊 Technical Overview:
Support: $0.029 – $0.066
Resistance / Target: $0.103
Momentum: Bullish shift forming on 1H
A confirmed break above $0.070–$0.075 could open space for a strong upward move, with the $0.10 zone as the main focus area in the coming sessions.
📈 Bias: Bullish setup
🎯 Targets: $0.085 → $0.103

ETH Bearish for Now: Watch the Yellow Zone CloselyKey zones for Ethereum have been identified, but the highlighted yellow zone holds greater importance and stronger liquidity attraction. For now, ETH remains bearish — let’s see how it reacts to these levels

The Crypto Black Swan Event > 10 bln USD of liquidations🧭 Executive Summary of the Crypto Black Swan Event
⚡ A sudden U.S. announcement of 100% tariffs on Chinese imports triggered a broad risk-off move across assets. Crypto, heavily levered near record highs, absorbed the shock via a forced-deleveraging cascade.
📉 Bitcoin fell sharply off its Oct 5 all-time high ~$125.2k to intraday lows near $105k–$102k, a ~16%–19% peak-to-trough drawdown across venues.
💥 Within 24h, liquidations surged to a record: credible tallies cluster around ~$9.5B–$19B, with ~1.4M–1.66M accounts affected; longs comprised the vast majority.
______________________________________________________________________________
🧨 What Caused the Liquidations
🧱 Macro shock: The tariff announcement plus mooted export controls abruptly repriced global growth, supply chains, and corporate margins—sparking equity weakness and a USD bid.
⛓️ Leverage overhang: Elevated perpetual futures and options positioning into fresh BTC highs left the market top-heavy. The macro jolt flipped bids thin → stops → liquidations.
🧪 Microstructure feedback: As price gapped, market makers widened spreads; taker flow ate depth; liquidation engines sold into deteriorating liquidity, magnifying slippage and triggering further margin calls.
______________________________________________________________________________
📊 Key Stats of the Black Swan Event
🧮 Total liquidations: ~$9.5B–$19B
👥 Accounts liquidated: ~1.4M–1.66M.
📉 Side: Longs 80%–88% of notional; shorts a minority share.
₿ BTC liqs: Roughly $1.3B–$5.3B depending on the data cut.
Ξ ETH liqs: Roughly $1.2B–$4.4B depending on the data cut.
🏦 Largest single order: About $203M (ETH-USDT) reportedly auto-closed on a perps venue during the flush.
🧾 Open interest: Per-asset OI fell sharply; sample snapshots show ETH OI down mid-single-digits to double-digits %, with billions of OI notionals erased.
🗂️ Cross-asset context: U.S. equities slid >2% on the day; risk proxies weakened as the tariff shock hit.
______________________________________________________________________________
🧩 Price Action & Drawdown
🚦 BTC: From ATH ~$125.2k to low ~105k–102k during the liquidation wave ~16%–19% drawdown, then partial stabilization above ~$110k.
🧷 ETH: Intraday range ~$4.39k → ~$3.54k ~19% swing before retracing part of the move.
🧭 Timing: The steepest losses clustered around the tariff headlines, with > $6B in liquidations occurring in a short burst as per some trackers.
______________________________________________________________________________
🧠 Microstructure Dissection
🪙 Perps dominance: Crypto’s price discovery has migrated to funded perpetuals. When the macro shock hit, perps funding and basis compressed, and auto-deleveraging/liquidation engines amplified downside.
🧰 Liquidity thinning: As volatility spiked, market makers reduced top-of-book size and widened quotes. Forced sell-flows then walked the book, increasing impact and triggering adjacent liquidation thresholds
🧷 Stop-density near round levels: Crowd positioning clustered around psychological levels e.g., $120k / $110k BTC, increasing stop-gamma once those levels broke.
🔁 Vol-targeting & risk controls: Systematic players and options desks cut exposures as realized vol surged; put-skew firmed, further pressuring delta hedges.
______________________________________________________________________________
🧯 Why This Was Worse Than Usual
📌 Catalyst clarity + leverage: A binary, headline-driven macro shock met crowded, momentum-long positioning near all-time highs.
📌 Time-of-day liquidity: Parts of the move unfolded during lower-depth periods, elevating market impact of forced sells.
📌 Cross-venue fragmentation: Liquidation telemetry differs by exchange; some engines throttle reports, but the flows were real—depth collapsed across majors simultaneously.
______________________________________________________________________________
🧪 BTC & ETH: By the Numbers
₿ BTC:
• ATH (Oct 5): ~$125.2k → flush low ~$105k–$102k → settle ~$112k.
• Liquidations: ~$1.3B–$5.3B depending on window/venue.
• Narrative: From “ETF & macro tailwinds” to “trade-war risk & deleveraging.”
Ξ ETH:
• Intraday: ~$4.39k → ~$3.54k (~−19%), partial rebound thereafter.
• Liquidations: ~$1.2B–$4.4B depending on window/venue.
• Options: Defensive put demand rose as traders sought convexity; skew biased to protection.
______________________________________________________________________________
🔭 What to Watch Next
🧷 Policy path: Will tariff scope/timing evolve? Any China counter-measures e.g., rare-earths could extend risk-off.
📉 Residual leverage: Track perps funding, aggregate OI, and basis—a second-wave flush risk fades as these stabilize.
🏦 Liquidity recovery: Top-of-book depth and spreads on major venues Binance/OKX/Bybit/CME are key to gauging re-risk appetite.
🧪 Dealer positioning: Elevated implied vol and persistent downside skew would signal hedging demand and slower mean-reversion.
______________________________________________________________________________
🧰 Risk-Management Takeaways
✅ De-crowd near extremes: Size leverage down when price, positioning, and macro all point one way.
✅ Respect liquidity regimes: Use impact-aware sizing and time-of-day execution filters around macro catalysts.
✅ Hedge the tail: Cheap convexity (puts/put spreads) into binary events offsets liquidation-engine reflexivity.
✅ Diversify collateral: Avoid single-stablecoin collateral concentration; maintain spare margin buffers across venues.

ETHEREUM TO NEW ATHHow many bullish divergences Ethereum needs to break 4800?
daily RSI
daily MACD
daily STOCHASTIC RSI

More down before 150k. Buy zone targeted! COINBASE:BTCUSD If Bitcoin continues previous trends. The last 2 large rallies were preceded by 11-13% drops. We are only at 4% now. If this holds true, 100-98k is where we reverse to 150k.

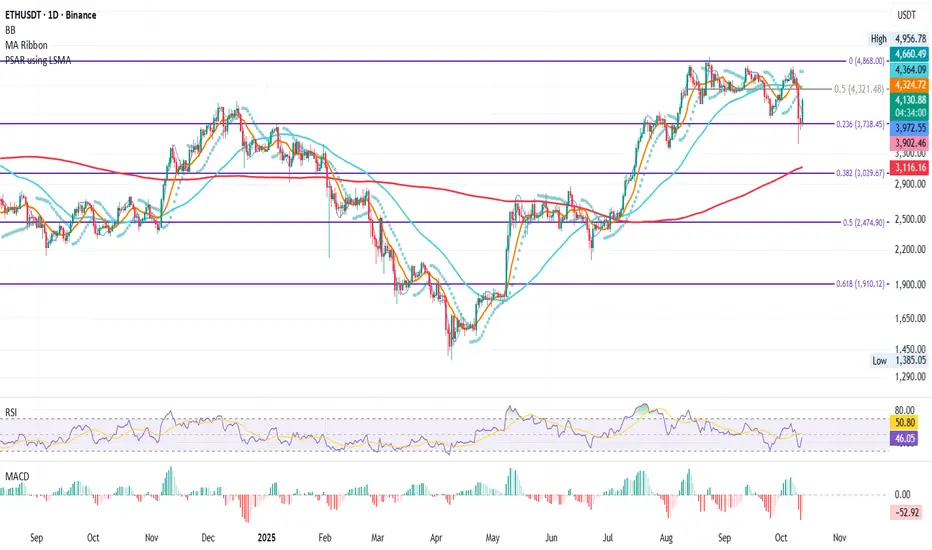
ETH Daily – High Volume, Rising OI, and a Fight for StructureETH Daily – Volume King Leading the Rebound
At this moment, ETH shows the highest trading volume across major assets.
After the sharp crash that dragged price down to 3435$, under the 0.236 Fib level, ETH found strong support near 3738$,the 0.236Fib level.
From that level, price has now reclaimed the 4000$ mark, a psychological and technical milestone.
If momentum continues, the next resistance sits at the 0.5 Fib level around 4321$.
From a system perspective, structure remains technically bearish for now:
SMA < MLR < Price < BB Center, with PSAR still bearish (above price).
To flip structure bullish, ETH would need a daily close above the BB Center with PSAR reversal confirmation.
OI Analysis:
ETH OI +7.70% growth confirms new leveraged exposure entering during this rebound: a positive sign showing traders are adding risk rather than de-risking.
This increase in OI, combined with strong spot volume (74.6B in 24h), suggests conviction behind the recovery rather than a mere short-covering bounce.
However, elevated OI also means volatility risk is rising: if ETH fails to close above 4000$ or BB Center, liquidations could amplify the next pullback.
Bias:
Cautiously bullish, short-term momentum improving, structure still lagging. Watching daily close above 4k today and BBcenter for future confirmation.
High volume and rising OI often mark the start of a structural shift, but confirmation always comes from the daily close.
In moments like this, patience is what separates the trader reacting to price from the one anticipating the next move.
Always take profits and manage risk.
Interaction is welcome.
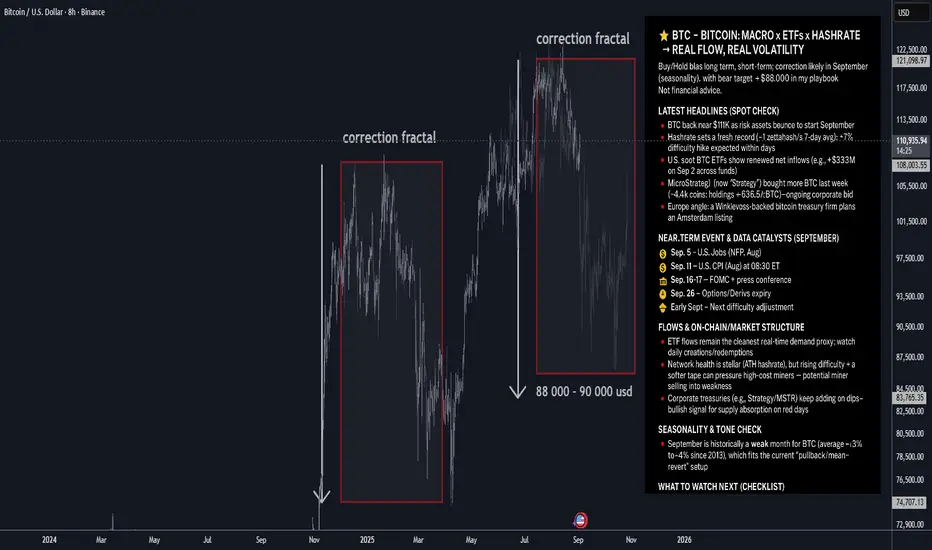
BTC — Bitcoin: Macro x ETFs x Hashrate → Real Flow, Real Volatil⭐️ BTC — Bitcoin: Macro x ETFs x Hashrate → Real Flow, Real Volatility
Buy/Hold bias long term; short-term: correction likely in September (seasonality), with bear target ≈ $88,000 in my playbook.
🔥 Latest headlines (spot check)
🔸BTC back near $111K as risk assets bounce to start September.
🔸Hashrate sets a fresh record (~1 zettahash/s 7-day avg); a >7% difficulty hike is expected within days. Network is the strongest ever, but miner margins tighten.
🔸U.S. spot BTC ETFs show renewed net inflows (e.g., +$333M on Sep 2 across funds). Flows remain a key daily demand gauge.
🔸MicroStrategy (now “Strategy”) bought more BTC last week (~4,4k coins; holdings ≈ 636.5k BTC)—ongoing corporate bid.
🔸Europe angle: a Winklevoss-backed bitcoin treasury firm plans an Amsterdam listing, signaling appetite for listed BTC exposure in the EU.
🗓 Near-term event & data catalysts (September)
🔸Fri, Sep 5 — U.S. Jobs (NFP, Aug) at 08:30 ET. Labor softness would bolster rate-cut odds and risk appetite; a beat could do the opposite.
🔸Wed, Sep 11 — U.S. CPI (Aug) at 08:30 ET. Inflation surprise drives real-rate expectations → BTC beta.
🔸Tue–Wed, Sep 16–17 — FOMC + press conference. Policy path & dot plot = macro volatility for BTC.
Fri, Sep 26 — Options/Derivs expiry:
• Deribit monthly BTC options expire 08:00 UTC (last Friday rule).
• CME Bitcoin monthly options settle Sep 26 as well.
These expiries often amplify gamma flows and spot-vol.
Early Sept — Next difficulty adjustment likely >7% up (tightens miner economics short-term).
Medium-dated overhang
Mt. Gox creditor deadline: Oct 31, 2025. Any schedule/details update could swing “supply overhang” narratives.
📈 Flows & on-chain/market structure
🔸ETF flows remain the cleanest real-time demand proxy; watch daily creations/redemptions. 🔸Sustained positives tend to align with spot strength; outsized outflows can weigh on price.
🔸Network health is stellar (ATH hashrate), but rising difficulty + a softer tape can pressure high-cost miners → potential miner selling into weakness.
🔸Corporate treasuries (e.g., Strategy/MSTR) keep adding on dips—bullish signal for supply absorption on red days.
🧠 Seasonality & tone check
September is historically a weak month for BTC (average ~−3% to −4% since 2013), which fits the current “pullback/mean-revert” setup.
📣 Social/flow buzz (signals, not noise)
🔸ETF flow posts (Farside, Bloomberg desks) are getting traction again—watch after U.S. close for prints.
🔸Saylor/Strategy buying headlines keep the “corporate bid” narrative front-and-center.
🧭 Levels & plan (author’s framework)
🔸Bias: Long-term constructive; near-term: correction mode likely extends through September (seasonality + event risk).
🔸Bear target: $88,000 (where I’d expect volatility to attract responsive buyers).
🔸Invalidation for bears (tactical): A strong reclaim/close above ~$113K–$115K with improving 🔸ETF inflows would weaken the pullback thesis.
🔸Sizing: Respect macro data days (NFP/CPI/Fed) and options expiry week—expect higher realized vol.
🗺 What to watch next (checklist)
🔸Daily U.S. spot BTC ETF flows (post-close updates). Momentum if creations persist; caution on redemptions clusters.
🔸Sep 5 — NFP (Aug) 08:30 ET. Risk-on if soft; risk-off if hot.
🔸Sep 11 — CPI (Aug) 08:30 ET. Headline/core surprises steer the FOMC tone.
🔸Sep 16–17 — FOMC + presser. Watch guidance on cuts, balance sheet, and growth.
🔸Sep 26 — Deribit & CME monthly expiries. Positioning/“max pain” dynamics into that Friday.
Difficulty adjustment (early Sept). If >7% up as projected, monitor miner behavior/sell pressure.
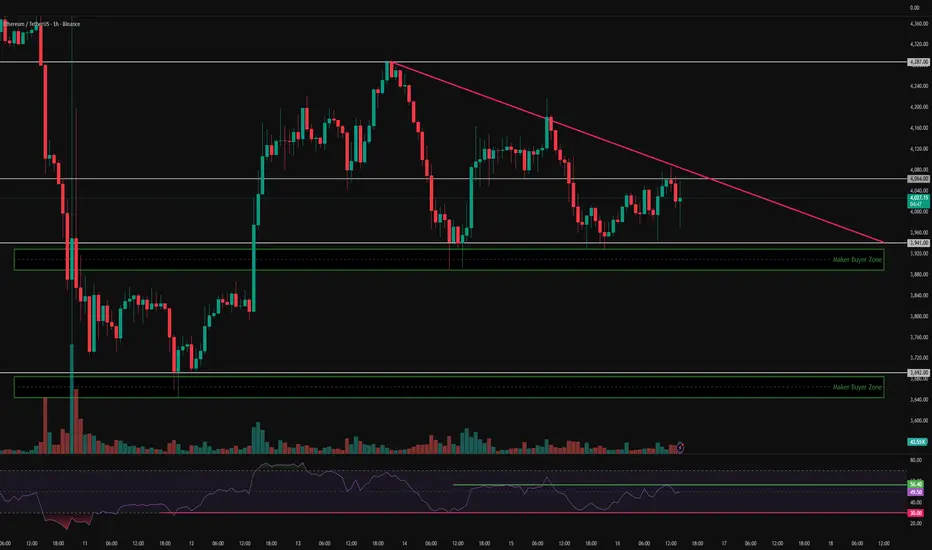
Possible Next Moves for Ethereum | ETH 1H Analysis D2👋 Hey everyone! Hope you’re doing great! - ❤️ Welcome to Satoshi Frame .
📅 Today we’re diving into the 1-hour Ethereum analysis. Stay tuned and follow along!
👀 On the 1-hour timeframe of Ethereum (ETH), we can see that ETH is currently moving inside a triangle compression structure, and it has now reached the final third of that triangle — meaning we’re waiting for a breakout to trigger a trade. The red trendline, which forms the upper edge of the triangle, acts as a dynamic resistance and overlaps with the $4064 resistance zone — creating a strong Long trigger setup. The bottom of the triangle acts as our Short trigger, where a confirmed break below it, combined with a Maker Buyer zone breakdown, could start ETH’s next move and break it out of this compression phase.
🧮 Looking at the RSI oscillator, ETH is currently fluctuating between 56.4 and 30. A breakout beyond either side of this range could enhance trading volatility and increase ETH’s momentum in the upcoming move.
🕯 Analyzing ETH’s volume, we can see that upon reaching the Maker Buyer zone, buying volume has increased — causing a noticeable reversal reaction from that level. If ETH continues to see increased buying pressure, it can break through resistance; otherwise, if it faces selling pressure, a large whale candle will be needed to break the Maker Buyer zone to the downside.
🧠 For Ethereum positioning, we can define two clear scenarios — since the price is near the end of its compression, these setups are relatively simple and well-defined:
🟢 Long Scenario: A breakout above the static + dynamic resistance at $4064, combined with RSI moving above 56.4 and increasing buying volume, could push ETH toward higher resistance levels.
🔴 Short Scenario: A break below the key Low at $3692, accompanied by a large whale candle cutting through the Maker Buyer zone and RSI dropping below 30 to enter its 1-hour OverSell area, would confirm bearish momentum. Note that if ETH dips slightly these days, many major projects, institutions, and even government-linked entities have been accumulating heavily within this identified Maker Buyer zone — so it’s wise to approach short positions with reduced risk exposure.
❤️ Disclaimer : This analysis is purely based on my personal opinion and I only trade if the stated triggers are activated .