ETH Game Plan – FTKZ ModelETH Game Plan – FTKZ Model
📊 Market Sentiment
After the sharp 10/10 crash triggered by Trump’s 100% tariff announcement on Chinese imports, altcoins saw heavy liquidations some exceeding -80%.
On 12/10, Vice President Vance clarified Trump’s remarks, causing a temporary rebound.
However, Trump’s 15/10 statement reaffirming a trade war with China reignited selling pressure.
Sentiment remains bearish, as volatility and geopolitical risk continue to shape short-term direction.
📈 Technical Analysis
ETH maintains a bullish structure on the weekly timeframe.
If the weekly candle closes below 3350$, it would signal a potential bearish reversal.
Price is currently retracing toward the HTF Key Zone, aligning with both an FFVG and HTF trendline confluence ideal for long setups if support holds.
📘 Model to be used – FTKZ Model (HTF FFVG + Trendline + Key Zone)
1️⃣ Determine the HTF weekly trend — trade only in that direction.
2️⃣ Identify the HTF Fair Value Gap (FFVG) that price may rebalance.
3️⃣ Confirm confluence with HTF trendline support.
4️⃣ Locate the HTF Key Zone showing strong order flow.
5️⃣ Enter after LTF confirmation.
📌 Game Plan
I will be watching ETH to test the 3350$ HTF Key Zone (weekly swing liquidity & monthly FFVG).
If the weekly close forms back above 3350$, I will expect continuation toward higher levels.
🎯 Setup Trigger
Weekly close above 3350$ confirming bullish continuation.
📋 Trade Management
Stoploss: Weekly close below 3350$
Targets: TP1: 4300$ | TP2: Bearish Trendline
Move stoploss to breakeven after TP1 hits.
💬 Like, follow, and comment if this breakdown supports your trading! More setups and market insights coming soon — stay connected!
⚠️ Disclaimer: This content is for informational and educational purposes only and does not constitute financial, investment, or trading advice. Always DYOR before making any financial decisions.
ETH

ETHUSD H4 | Bullish Reversal FormationEthereum (RTH/USD) is falling towards the buy entry, which is a pullback support that aligns with the 61.8% Fibonacci projection and the 127.2% Fibonacci extension, and could bounce from this level to the take profit.
Buy entry is at 3,712.02, which is a pullback support that aligns with the 61.8% Fibonacci projection and the 127.2% Fibonacci extension.
Stop loss is at 3,514.48, whichis a pullback support.
Take profit is at 4,2756.43, which is a pullback resistance.
High Risk Investment Warning
Trading Forex/CFDs on margin carries a high level of risk and may not be suitable for all investors. Leverage can work against you.
Stratos Markets Limited (tradu.com ):
CFDs are complex instruments and come with a high risk of losing money rapidly due to leverage. 65% of retail investor accounts lose money when trading CFDs with this provider. You should consider whether you understand how CFDs work and whether you can afford to take the high risk of losing your money.
Stratos Europe Ltd (tradu.com ):
CFDs are complex instruments and come with a high risk of losing money rapidly due to leverage. 66% of retail investor accounts lose money when trading CFDs with this provider. You should consider whether you understand how CFDs work and whether you can afford to take the high risk of losing your money.
Stratos Global LLC (tradu.com ):
Losses can exceed deposits.
Please be advised that the information presented on TradingView is provided to Tradu (‘Company’, ‘we’) by a third-party provider (‘TFA Global Pte Ltd’). Please be reminded that you are solely responsible for the trading decisions on your account. There is a very high degree of risk involved in trading. Any information and/or content is intended entirely for research, educational and informational purposes only and does not constitute investment or consultation advice or investment strategy. The information is not tailored to the investment needs of any specific person and therefore does not involve a consideration of any of the investment objectives, financial situation or needs of any viewer that may receive it. Kindly also note that past performance is not a reliable indicator of future results. Actual results may differ materially from those anticipated in forward-looking or past performance statements. We assume no liability as to the accuracy or completeness of any of the information and/or content provided herein and the Company cannot be held responsible for any omission, mistake nor for any loss or damage including without limitation to any loss of profit which may arise from reliance on any information supplied by TFA Global Pte Ltd.
The speaker(s) is neither an employee, agent nor representative of Tradu and is therefore acting independently. The opinions given are their own, constitute general market commentary, and do not constitute the opinion or advice of Tradu or any form of personal or investment advice. Tradu neither endorses nor guarantees offerings of third-party speakers, nor is Tradu responsible for the content, veracity or opinions of third-party speakers, presenters or participants.

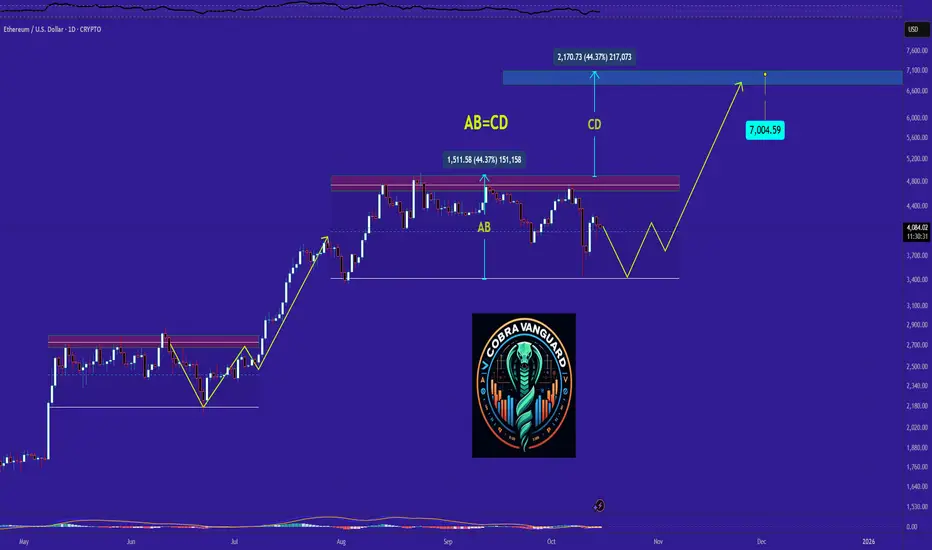
ETH/USDT Long Setup – Demand Zone BounceHi Everyone,
Ethereum is sitting just above the $4,000 support after bouncing from the $3,500–$4,000 demand zone and reclaiming the 20W EMA. As long as price holds this level, I’m looking for continuation to the upside.
My target for this trade is $5300,
A break back below $3,500 would invalidate this setup, however I have my stop loss priced at $3200.
Simple plan: hold above demand, ride it higher.
I believe this trade will hit target within 2-4 weeks.

ETH/USDT 4H chart review📉 Main trend (short-term)
• The price is below the black downtrend line, which means sellers are dominating.
• There is an attempt to break out above the trendline, but there is no continuation - i.e. a false breakout (so-called "bull trap").
⸻
🔴 Key support and resistance levels
• Resistances:
• 4,252 USDT – local resistance, the limit of the previous rebound.
• 4,471 USDT – strong resistance, earlier peak after breakout.
• 4,750 USDT – main resistance from a higher interval (possible target after a trend change).
• Support:
• 3,963 USDT – current price level, acts as local support.
• 3,763 USDT – next strong support, confirmed by the previous rebound.
• 3,435 USDT – critical zone, bottom of the structure.
⸻
📊 RSI (oscillator)
• RSI (bottom chart) is close to the oversold zone (<30).
• This means that the market is overloaded with selling and a technical rebound may occur in the short term.
⸻
🔍 Volume
• Volume decreases with subsequent declines → a sign of supply fatigue.
• This may suggest that a local bottom is approaching and a possible corrective move upwards.
⸻
📈 Scenarios
✅ Bull scenario
• If ETH stays above USDT 3,960-3,970, there may be a rebound to:
👉 USDT 4,250-4,470 (first target).
• Confirmation: a candle closing above the black trend line.
❌ Bear scenario
• If the price drops below USDT 3,960 and stays there for 4H,
next drop target is:
👉 3,760 USDT, and in the event of a breakout – 3,435 USDT.

ETH - Time to buy again!I might be wrong and this might never happen, but it might come true From a technical perspective!!!
TradeCityPro | Ethereum: Break Key Levels for Bullish Momentum👋 Welcome to TradeCity Pro!
In this analysis, I want to examine Ethereum for you. The queen of the crypto market, with a $497 billion market cap, is ranked 2nd on CoinMarketCap.
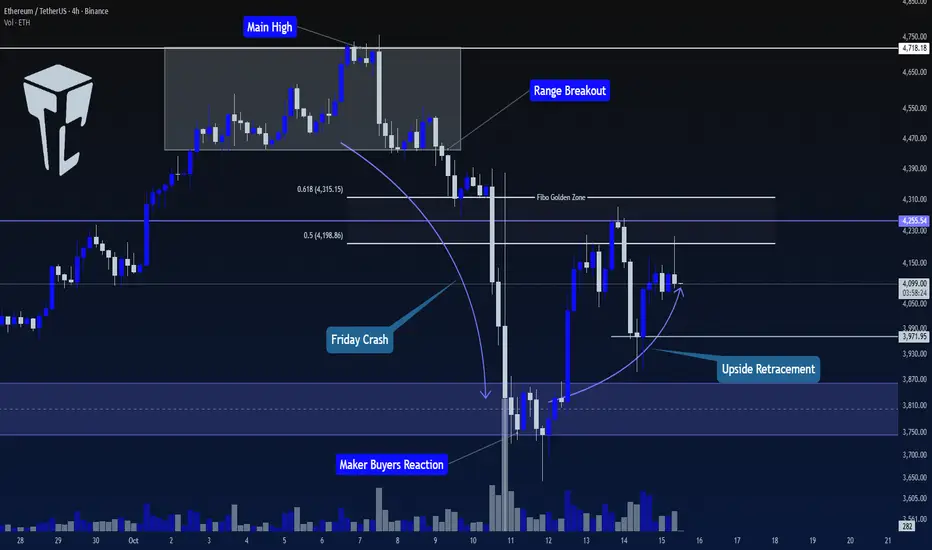
⏳ 4-Hour Timeframe
This coin, in the 4-hour timeframe, after breaking the range box at the ceiling and moving towards the $3800 level, is now in a corrective phase and has made an upward movement.
⭐ The $3800 range is a very important level for Ethereum, and this zone was not broken even during the Flash Crash that occurred on Friday, and it managed to hold the price.
🚀 Now, the price has moved towards the range between 0.5 and 0.618 Fibonacci, and has been rejected once from this zone.
📊 The volume has not increased significantly during this move and has mostly been range-bound, but since the price has created a higher low at the $3971 level, if the buying volume increases, we can get a bullish confirmation with a break of the $4255 level.
💥 Since this coin is bullish on higher timeframes and is currently undergoing a correction on lower timeframes, if the price gives us a small bullish confirmation, we can take advantage of it and open a long position.
💡 The main resistance for Ethereum is the $4718 level. Breaking this level will initiate the next wave for Ethereum on higher timeframes, such as weekly charts. Therefore, I will try to open a long position on Ethereum before this level is broken.
📈 The suitable trigger right now seems to be a break of $4255. With this break, the price can move towards $4718, and if this level is broken, we will have a very good and attractive entry point for a long position on Ethereum.
📝 Final Thoughts
Stay calm, trade wisely, and let's capture the market's best opportunities!
This analysis reflects our opinions and is not financial advice.
Share your thoughts in the comments, and don’t forget to share this analysis with your friends! ❤️
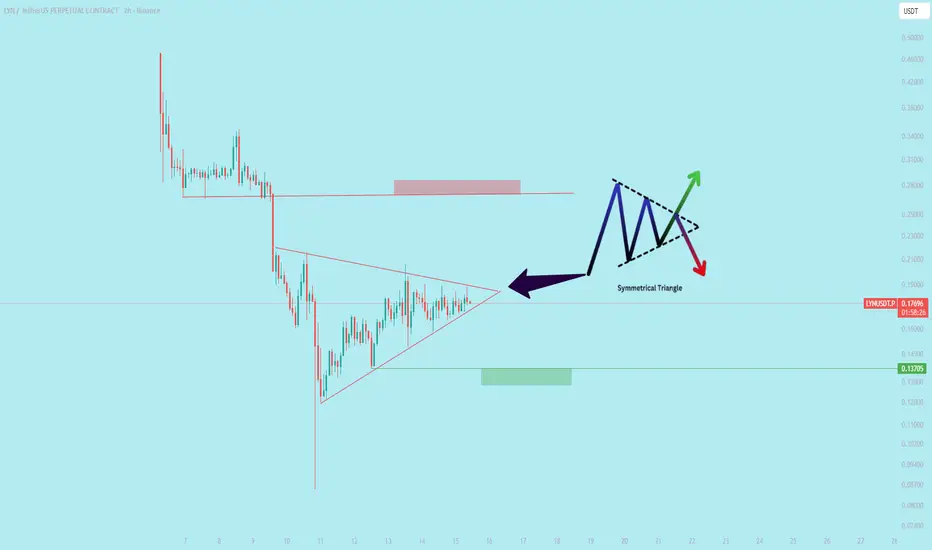
$LYN Performing a symmetrical triangle**$LYN** **Performing a symmetrical triangle** `symmetrical triangle is a chart pattern formed by two converging trendlines that connect a series of lower highs and higher lows. It represents a period of market consolidation and indecision, with neither buyers nor sellers having a clear advantage. The price range narrows as it moves toward the triangle's apex, or point of convergence.`
Ethereum 1H Analysis – Key Battle at $4,278 Resistance | D1👋 Hey everyone! Hope you’re doing great!
💥 Welcome to Satoshi Frame — today we’re diving into the 1-hour Bitcoin analysis. Stay tuned and follow along!
👀 1-hour timeframe of Ethereum, and we can see that Ethereum, after the heavy drop it experienced, broke down from the 4278$ area and moved toward its lower support levels. A major support level has formed around the 3692$ area, where we saw strong buyer support, and they pushed the Ethereum price upward. After the upward movement and buyer support, as Ethereum approached its resistance in the 4278$ area, the buying volume decreased, and then buyers’ strength ended. Sellers, with strong momentum and multiple red candles, pushed the price down toward the 3941$ support, where the price was supported again. Now a higher low has formed compared to the 3941$ bottom, and the price is moving toward its key resistance area at 4278$.
🧮 We can see in the RSI oscillator that there is a key level around 70, which is the OverBuy boundary. If the fluctuation limit passes this area, Ethereum can break its resistance around 4278$.
🕯 Regarding volume, there is an educational note that when the price approached the 4278$ resistance, it faced a decrease in buying volume and was rejected from this area with many red candles. Now that the price is moving toward this resistance, if it is accompanied by an increase in buying volume, it increases the probability of breaking this resistance for us.
🧠 For the Ethereum position, a breakout of the 4278$ area is needed, and now if the price moves toward this area, it will form our second touch and create several scenarios for us.
↗️ First scenario for long position: breakout of resistance accompanied by an increase in volume and setting the trigger at 4278$, which gives us a large stop size and reaches its risk-to-reward ratio later.
↗️ Second scenario for long position: wait for the price to have a reaction to the 4278$ area and then create a higher high and higher low for us, and we can enter on the created higher low and place our stop below that same low.
❤️ Disclaimer : This analysis is purely based on my personal opinion and I only trade if the stated triggers are activated .

ETH Consolidates Below Yesterday Cloee ETH 30M – Waiting for Long Confirmation
After a sharp pullback, Ethereum is now consolidating right below key dynamic levels, the perfect zone where patience pays more than prediction.
🧭 System Overview:
I track 3 confirmation signals:
1️⃣ MLR10 crossing above SMA3.
2️⃣ MLR10 crossing above BB center
3️⃣ PSAR flipping below price.
⚙️ Current Time Frame (30m):
PSAR (gray) still above price → bearish bias not yet invalidated.
MLR10 (blue) is between SMA3 (magenta) and BB center (orange) → neutral zone.
RSI at 49.7 → momentum flat.
MACD turning red → fading strength.
200MA (red) near 4000 → key structural support.
💡 Interpretation:
ETH is preparing, not breaking.
There’s potential energy building, but entry discipline is crucial.
Until PSAR flips below and MLR reclaims both SMA and BB center, we stay flat.
📊 Market context:
Open Interest ↓ 1.8% → leverage cooling off.
Funding neutral → no retail squeeze in play.
Liquidations balanced → no directional aggression.
➡️ Conclusion:
No confirmed long yet, but structure shows early recovery potential.
A valid System Long will trigger once all 3 signals align.
Key levels:
Resistance: Yesterday close , dotted line
Support: MA50
Next long trigger → when PSAR flips & MLR > SMA3 > BB center
Always take profits and manage risk.
Interaction is welcome.

Ethereum is headed for a massive bull market. Hope you guys are ready for the fun part, because Ethereum—according to my analysis—is ready for some massive moves. This means altcoin season is coming in full force very soon. Be ready and ignore the FUD.
As always, stay profitable.
– Dalin Anderson

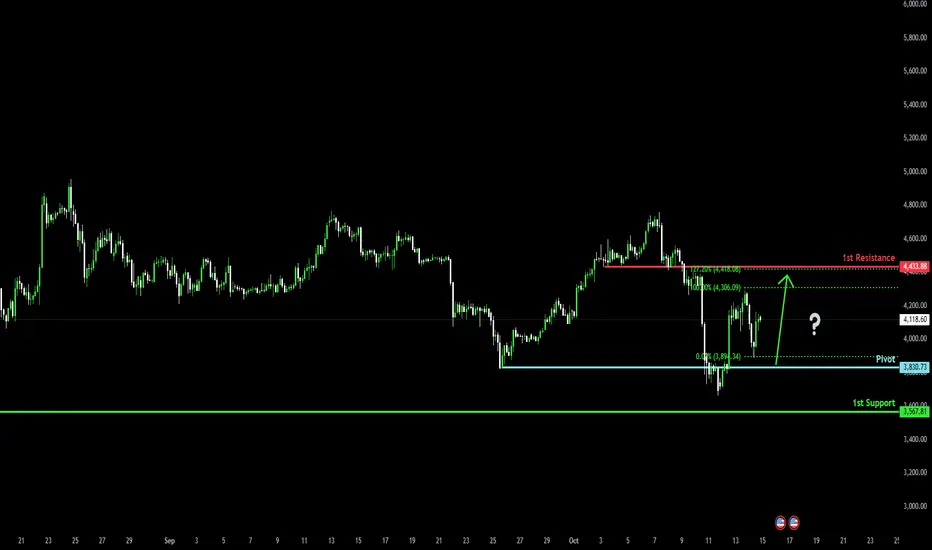
Bullish reversal setup?The Ethereum (ETH/USD) is falling towards the pivot and could bounce to the 1st resistance that aligns with hte 127.2% Fibonacci extension.
Pivot: 3,830.73
1st Support: 3,567.83
1st Resistance: 4,433.88
Disclaimer:
The above opinions given constitute general market commentary, and do not constitute the opinion or advice of IC Markets or any form of personal or investment advice.
Any opinions, news, research, analyses, prices, other information, or links to third-party sites contained on this website are provided on an "as-is" basis, are intended only to be informative, is not an advice nor a recommendation, nor research, or a record of our trading prices, or an offer of, or solicitation for a transaction in any financial instrument and thus should not be treated as such. The information provided does not involve any specific investment objectives, financial situation and needs of any specific person who may receive it. Please be aware, that past performance is not a reliable indicator of future performance and/or results. Past Performance or Forward-looking scenarios based upon the reasonable beliefs of the third-party provider are not a guarantee of future performance. Actual results may differ materially from those anticipated in forward-looking or past performance statements. IC Markets makes no representation or warranty and assumes no liability as to the accuracy or completeness of the information provided, nor any loss arising from any investment based on a recommendation, forecast or any information supplied by any third-party.
Volatility Period: October 16 (October 15-17)
Hello, traders!
Follow us to get the latest information quickly.
Have a great day!
-------------------------------------
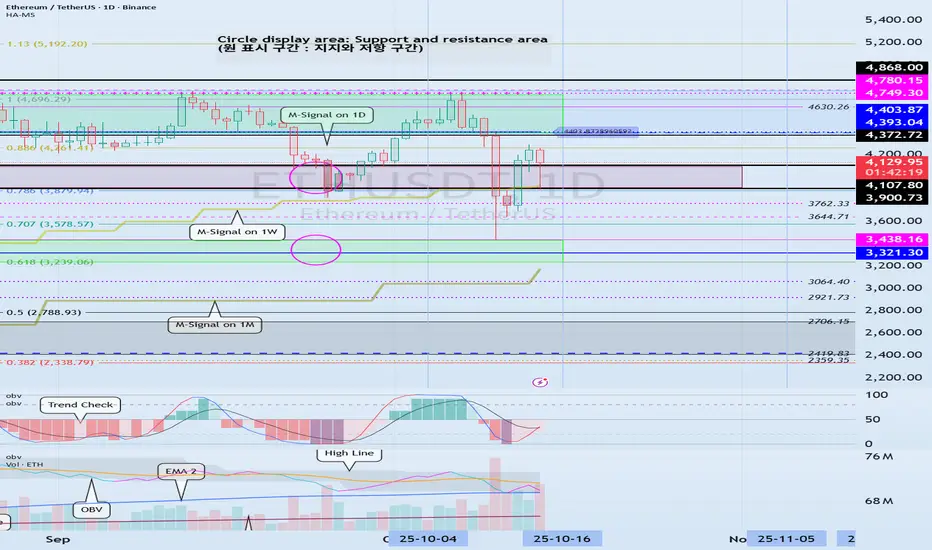
(ETHUSDT 1D Chart)
Following BTC, ETH is also entering a volatility period.
This period of volatility for ETH is expected to last until October 16th (October 15th-17th).
After this period of volatility, the key question is whether the price can find support around 3900.72-4372.72 and rise above 4403.87 to maintain its price.
If the price fails to rise, it is expected to encounter the M-Signal indicator on the 1M chart, so a response plan should be considered.
-
(1M chart)
The StochRSI indicator on the 1M chart is entering an overbought zone, potentially limiting its upward movement.
Therefore,
1st: 3900.73-4107.80
2nd: 3321.30-3438.16
We need to determine whether the price can rise after finding support near the 1st and 2nd levels above.
In other words, we need to see if the price remains above the M-Siganl indicator on the 1M chart.
-
(1W chart)
Looking at the 1W chart, the HA-High ~ DOM (60) range is formed in the 4393.04-4780.15 range. Therefore, a rise above this range is necessary for a stepwise uptrend.
Ultimately, the key question is whether the price can rise above the 4393.04-4780.15 range.
----------------------------------
Therefore, the key question is whether the 4393.04-4780.15 range, which corresponds to the HA-High ~ DOM(60) range on the 1W and 1D charts, can rise after this period of volatility.
As I always say, to break above this important point or range and continue the uptrend,
1. The StochRSI indicator must be trending upward. If possible, it's best to avoid entering the overbought zone.
2. The On-By-Sign-Observable (OBV) indicator must be trending upward. If possible, it should remain above the High Line.
3. The TC (Trend Check) indicator must be trending upward. If possible, it should remain above the 0 level.
If the above conditions are met, the uptrend is likely to continue.
It's recommended to draw support and resistance points or ranges on the 1M, 1W, and 1D charts and utilize auxiliary indicators to determine the significance of these points or ranges.
When drawing support and resistance points or zones, we often think of them as important, but it can be difficult to recognize how important they actually are.
Therefore, when drawing support and resistance points or zones, it's important to be able to develop a basic trading strategy.
Once you've established a basic trading strategy, the key to trading is figuring out how to maintain that strategy and respond accordingly.
No matter what chart analysis you use, you'll ultimately need to draw support and resistance points or zones.
Therefore, the first step is to draw support and resistance points or zones on the 1M, 1W, and 1D charts.
Next, you should check auxiliary indicators to determine the importance of the drawn support and resistance points or zones and determine whether you should respond.
To achieve this, you need to understand your investment size and how to manage your reserve funds.
You should always keep a certain portion (approximately 20%) of your total investment in cash.
This allows you to respond to volatility when it occurs.
If you've invested too much money in a single coin (token, stock), it's a good idea to sell some of it when the price rises to a certain level and secure cash.
Ultimately, overcoming the relentless volatility of the beginning and achieving profit depends on how you manage your funds.
-
Thank you for reading to the end.
I wish you successful trading.
--------------------------------------------------
BTC/USDT — Volume Confirmation Points Toward UptrendBitcoin has reclaimed strength within the low time frame zone, while also showing rising volume activity — a key technical signal that supports the early stage of a potential uptrend continuation.
BTC volume has been increasing since the last 7H step by step.
Currently, BTC is stabilizing between $111K and $113.6K, forming a supportive base within this range. The volume range just above acts as a confirmation layer — once price holds above this level with consistent demand, the uptrend momentum could accelerate.
📊 Technical Highlights:
Low Time Frame Support: $111K–$113.6K
Volume Zone: $116.6K area and important confirmation zone.
Main Resistance / Target: $118-120K
A sustained move above the volume zone ($116K) would be the main confirmation that BTC’s next leg toward $126K is underway.
📈 Bias: Bullish continuation forming
🎯 Key levels: $113.6K → $116K → up 118K

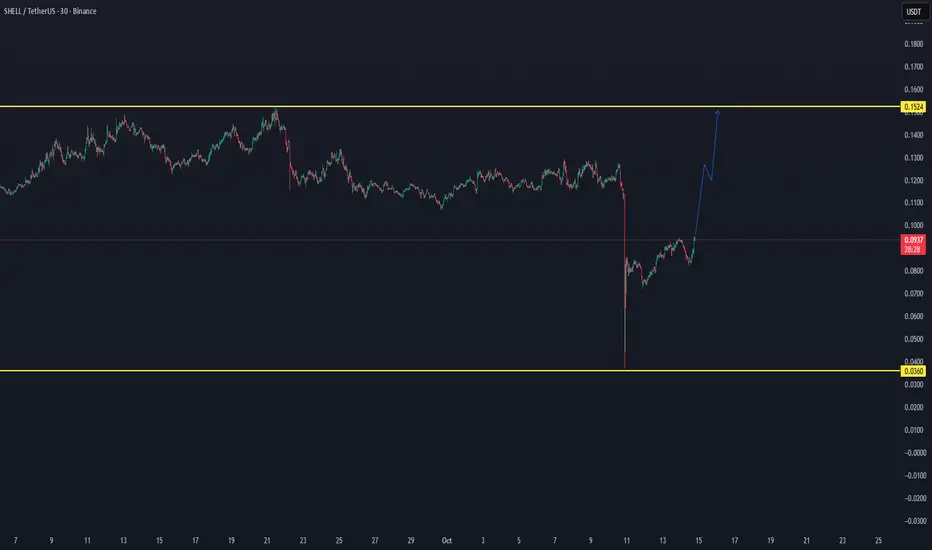
SHELL/USDT — Breakout Setup Building, Eyes on $0.1524SHELL/USDT — Breakout Setup Building, Eyes on $0.1524 🚀
SHELL has formed a clear bottom structure and is now showing early signs of trend recovery after a sharp correction. The price is currently reclaiming strength above the $0.09 level, suggesting a potential shift in short-term momentum.
📊 Technical Overview:
Support zone: $0.0360
Current price: $0.093
Breakout target: $0.1524
A breakout above $0.10–$0.11 could confirm a new upward phase, opening the path toward the $0.1524 zone, which acts as the next significant resistance level.
Momentum indicators and price structure indicate that buyers are gradually stepping in — pointing to a possible continuation move if volume supports the trend.
📈 Bias: Bullish setup forming
🎯 Targets: $0.115 → $0.1524
🕓 Watch for confirmation: A 4H close above $0.10
ETH – Key Scenarios #ETH – Key Scenarios
Current price: $3,913
Ethereum remains inside a corrective structure following rejection near $4,250–$4,300.
The chart outlines three potential paths — continuation, consolidation, or deeper correction.
Technical Context
• ETH lost momentum after failing to break above the prior swing high near $4,300.
• Price action remains guided by a descending channel, while short-term volatility spikes around macro events.
• The mid-term structure depends on whether ETH can break above this channel or remain trapped within it.
1️⃣ Bullish Continuation (White / Cyan Path)
• Structure: Impulse wave 1–2–3–4–5 forming a new major wave (3).
• Confirmation: breakout above $4,200–$4,300, supported by high volume.
• Targets:
– Wave 3 ≈ $4,700–$4,900
– Extended 5th ≈ $5,200+
• Invalidation: daily close below $3,700.
• Probability: Moderate–High, if risk appetite returns and BTC leads the rally.
2️⃣ Extended ABC Correction (Orange Path)
• Structure: A–B–C correction unfolding toward lower Fibonacci retracements.
• Key levels:
– Wave A ≈ $3,600
– Wave B bounce ≈ $3,900–$4,000
– Wave C ≈ $2,800–$2,600
• Narrative: macro tightening or BTC rejection near resistance.
• Probability: Moderate, especially if liquidity contracts or sentiment weakens.
3️⃣ Channel Consolidation / Range Scenario (Gray Path)
• Structure: price remains within the descending channel, oscillating between support and resistance.
• Range:
– Upper boundary ≈ $4,200–$4,300
– Lower boundary ≈ $3,400–$3,600
• Character: prolonged sideways correction forming a triangle or complex W-X-Y pattern.
• Implications: market indecision, volatility compression before the next macro move.
• Probability: High (short-term) — typical after sharp drops and in anticipation of new catalysts.
🧭 Summary
• ETH is currently consolidating inside a descending channel, forming a decision point for Q4.
• Three paths remain open:
- Breakout and impulsive continuation above $4,300.
- Range-bound sideways phase within the channel.
- Full ABC correction toward $2.8K–$2.6K.
Trend bias: Neutral-bullish while above $3,700, turning bearish on a confirmed channel breakdown.

Bitcoin is going to the hell???hi follow me , boost this post and read
everything shows me that bull trend is over , weakness in highs , candles and the momentum
the targets for retracement is 83 to 74 and after that 50k
i know its hard to hear that but this is market he do what he wants so accept it.
thank you. i reply to questions anytime.

$ETH the big picture is still in play.After breaking out of its long-standing downtrend, Ethereum is currently only retesting the demand zone and trend line.
This move is a healthy retest inherent in a bullish structure.
Fluctuations on short timeframes don't change direction; it's the longer timeframes that matter.
The macrotrend is still upward.
The bigger picture hasn't yet spoken.

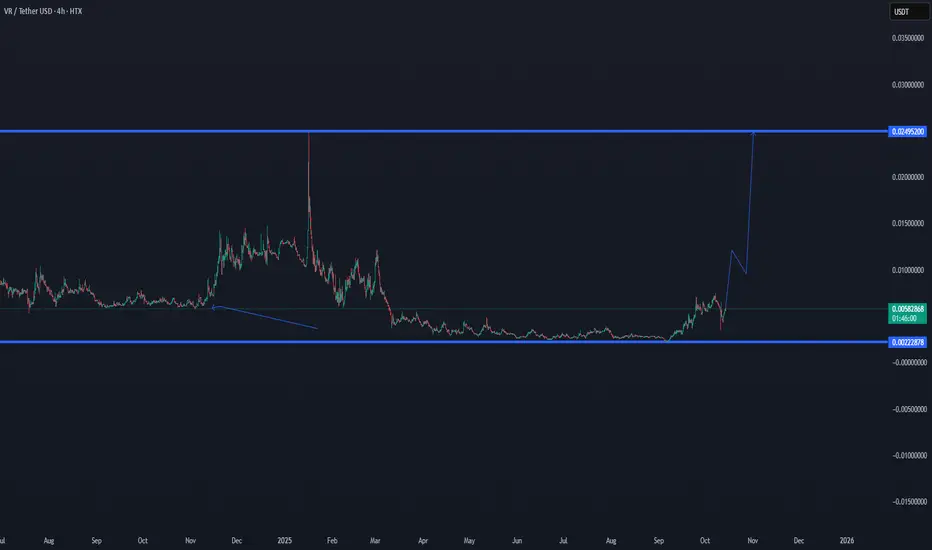
VR/USDT Accumulation Zone Update📊 Market Update — VR/USDT
VR is trading inside a clear range zone. The lower support is around 0.0022, and the top resistance sits near 0.0249.
Currently, VR is holding above the mid-level with solid volume — if it can confirm higher with a 4h close, a move toward 0.01+ looks possible, and later a push into the range high could follow.
✅ Outlook
Still early-stage accumulation, but structure looks bullish as long as price holds above support.
If BTC stays stable or trends up, VR could continue this breakout move.
ETH - Buy the Confluence, Not the DipPrice is pulling back into a chunky demand block that overlaps the rising channel’s lower trendline and the correction’s (falling wedge) lower rail—a classic confluence.
As long as this intersection holds, I expect the up-trend to resume from here.
My plan is simple: wait for a bullish rejection, then ride the bounce.
If it triggers, I’ll look up into ~4,350 → 4,600 → 4,900. The setup is invalidated on a decisive daily close below the zone and trendline, which would open a deeper mean-reversion toward ~3,500 → 3,250 first.
⚠️ Disclaimer: This is not financial advice. Do your own research and manage risk.
All Strategies Are Good; If Managed Properly!
~Richard Nasr

ETH Bulls Defending $4000. Can They Spark the Next Rally?After breaking out from a major resistance, BINANCE:ETHUSDT delivered a clean and healthy retest, just as expected. The bounce from that level showed strong buyer confidence, confirming that bulls are still in control.
Currently, Ethereum is holding a crucial support zone around the $4000 range. This level will play a key role in determining the next big move. If CRYPTOCAP:ETH manages to sustain and bounce from here, we could see the price rallying towards the $7000–$8000 zone in the coming weeks.
However, traders should stay cautious, a drop below $3500 could signal further downside and a deeper correction. As always, risk management is key in every setup.
Watch the $4000 zone closely, the next CITYINDEX:ETHUSD wave could be massive!
Follow Our Tradingview Account for More Technical Analysis Updates, | Like, Share and Comment Your thoughts
ETHUSD H1 | Bullish BounceETH/USD is falling towards the buy entry at 4,199.93, which is a pullback support that aligns with the 23.6% Fibonacci retracement and could bounce from this level to the upside.
Stop loss is at 4,080.59, which is a pullback support that lines up with the 50% Fibonacci retracement.
Take profit is at 4,412.84, which is an overlap resistance that lines up with the 61.8% Fibonacci retracement.
High Risk Investment Warning
Trading Forex/CFDs on margin carries a high level of risk and may not be suitable for all investors. Leverage can work against you.
Stratos Markets Limited (tradu.com ):
CFDs are complex instruments and come with a high risk of losing money rapidly due to leverage. 65% of retail investor accounts lose money when trading CFDs with this provider. You should consider whether you understand how CFDs work and whether you can afford to take the high risk of losing your money.
Stratos Europe Ltd (tradu.com ):
CFDs are complex instruments and come with a high risk of losing money rapidly due to leverage. 66% of retail investor accounts lose money when trading CFDs with this provider. You should consider whether you understand how CFDs work and whether you can afford to take the high risk of losing your money.
Stratos Global LLC (tradu.com ):
Losses can exceed deposits.
Please be advised that the information presented on TradingView is provided to Tradu (‘Company’, ‘we’) by a third-party provider (‘TFA Global Pte Ltd’). Please be reminded that you are solely responsible for the trading decisions on your account. There is a very high degree of risk involved in trading. Any information and/or content is intended entirely for research, educational and informational purposes only and does not constitute investment or consultation advice or investment strategy. The information is not tailored to the investment needs of any specific person and therefore does not involve a consideration of any of the investment objectives, financial situation or needs of any viewer that may receive it. Kindly also note that past performance is not a reliable indicator of future results. Actual results may differ materially from those anticipated in forward-looking or past performance statements. We assume no liability as to the accuracy or completeness of any of the information and/or content provided herein and the Company cannot be held responsible for any omission, mistake nor for any loss or damage including without limitation to any loss of profit which may arise from reliance on any information supplied by TFA Global Pte Ltd.
The speaker(s) is neither an employee, agent nor representative of Tradu and is therefore acting independently. The opinions given are their own, constitute general market commentary, and do not constitute the opinion or advice of Tradu or any form of personal or investment advice. Tradu neither endorses nor guarantees offerings of third-party speakers, nor is Tradu responsible for the content, veracity or opinions of third-party speakers, presenters or participants.

Bitcoin Eyes $116.6K Breakout Confirmation📊 Market Update — Bitcoin (BTC/USDT)
BTC has successfully confirmed the low time frame zone, holding steady above both the support and volume range, which signals continued short-term strength.
Currently, price action is consolidating within the upper boundary of the range — a sign of buyer absorption before potential expansion.
🔹 Key Level to Watch: $116.6K
This level acts as an important confirmation point — a 1-hour (or higher) close above this zone could validate a breakout continuation, opening the path toward the $120K–$125K range.
If BTC sustains this structure, the bullish momentum remains intact, with low time frame structure aligning with higher trend support.
📈 Bias: Bullish Continuation
🎯 Next Targets: $116.6K → $120K → $125K

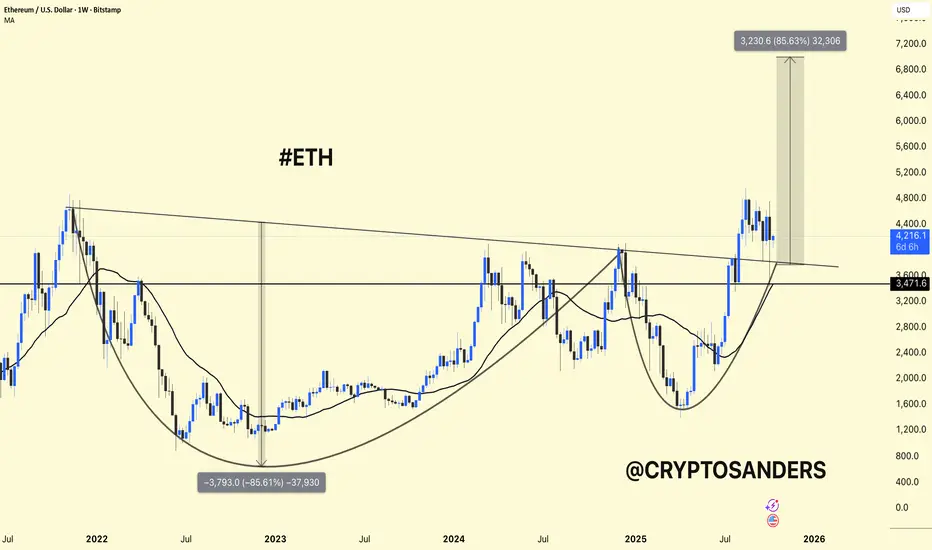
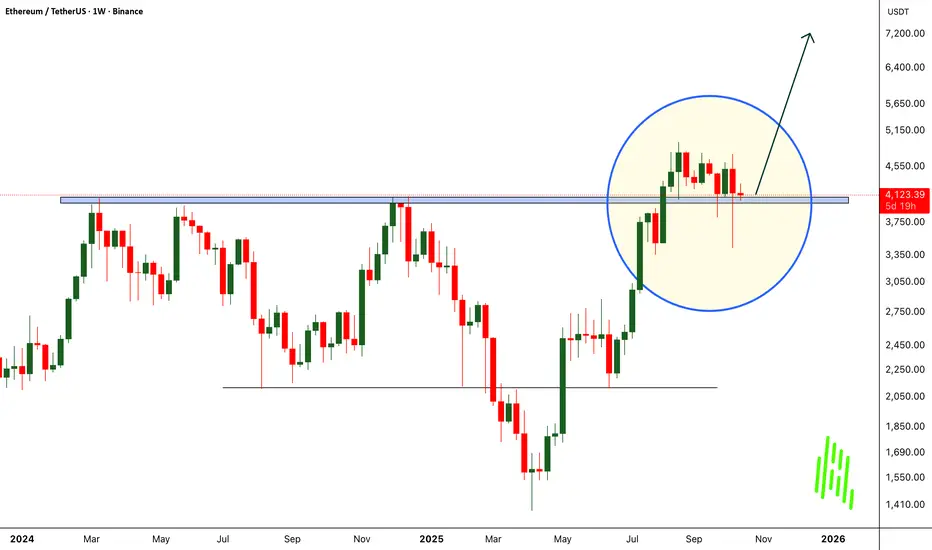
ETH/USDT Weekly Chart Analysis !!ETH/USDT Weekly Chart Analysis.
Structure: The chart shows a large cup-and-handle pattern – a classic bullish formation that signals a long-term trend reversal.
Current Price: Around $4,150, trading above the $3,470-$3,600 support area, which was the previous breakout area.
Moving Average (MA): ETH remains above the weekly MA (~$3,460) – confirming bullish momentum.
Breakout Area: The key downtrend line of 2022 has already been broken to the upside, showing strength.
Upside Target: If ETH maintains a price above $3,600, a potential upside move towards $7,000-$7,200 (≈ approximately +85%) is possible, as shown in the chart.
ETH is consolidating after its breakout, remaining stable above its support level.
Holding $3,600 → Bullish momentum likely to continue.
Loss of $3,400 → Could trigger a deeper decline towards $3,000.
DYOR | NFA