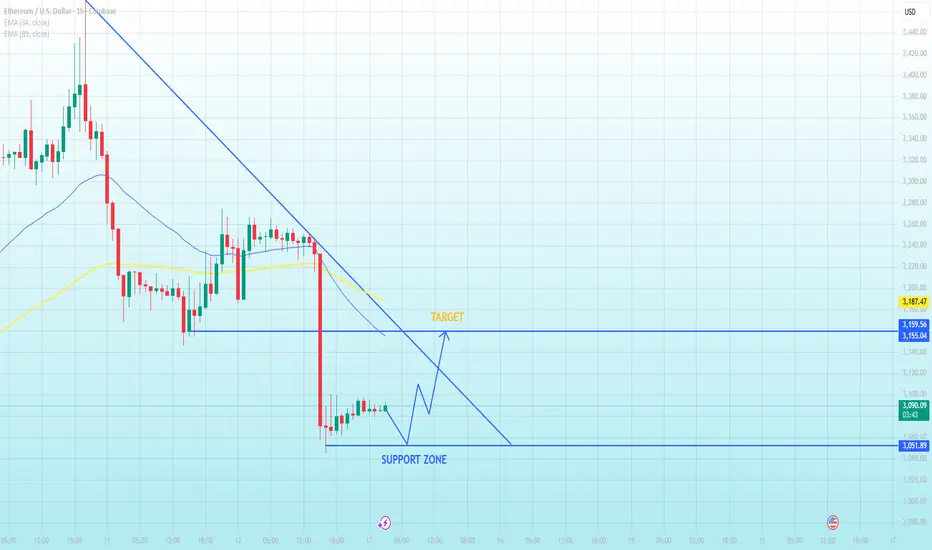
Is Ethereum Ready to Bounce Back or Will It Fall Deeper?Ethereum (ETH/USD) – 1-Hour Chart
Current Market Structure:
- Ethereum has recently seen a sharp drop, followed by a consolidation phase.
- Price is now positioned near a key support zone, as indicated by the horizontal blue line.
- The trendline above suggests a descending resistance that could play a significant role in price action going forward.
Key Levels:
- Support Zone: $3,051.89 - The price is currently near this level, and it will be critical in determining whether Ethereum will reverse or continue lower.
- Target Zone: $3,159.56 - If Ethereum successfully bounces from the support zone, the next target is near this level, marked by the blue arrow.
- Resistance Trendline: The price is approaching a downward sloping resistance. A break above this trendline would signify a potential bullish breakout.
Probable Scenarios:
- Bounce from Support Zone: The current level looks like a potential buy zone, with a bounce toward $3,159.56 as the first target.
- Continued Rejection at Resistance: If price fails to break the resistance trendline, expect further downside action toward lower support zones.
- Breakdown of Support: If price breaks below the support zone, a move lower toward the next support level is likely, potentially extending the decline.
Market Impact:
- Short-Term Volatility: There is likely to be volatility due to the support and resistance interaction, so keeping an eye on price action near these levels is crucial.
- Upcoming Events: Be aware of external factors like economic announcements that could disrupt price movement.
Trading Strategy:
Buy at Support: Look for a confirmation of the bounce from the support zone, aiming for the target near $3,159.56.
Sell at Resistance: If price fails to break above the resistance trendline, consider shorting with a target near the next support zone.
For now, patience is recommended until the price shows clear behavior near these key levels.
ETH
Gold Holds Steady as Traders Position Ahead of Key Fed Outlook🔹 MARKET BRIEFING – XAU/USD (4H)
Market State:
– Price is holding above short-term support and consolidating sideways, with momentum still leaning toward the buyers.
Key Levels:
– Support: 4164
– Resistance: 4264
– Breakout Zone: 4300–4340
Next Move:
– Bullish momentum remains in control; a breakout above 4300 would open the path toward 4340 and 4380.

Gold Just Paused at a Strange Level What is Coming Nex🔹 MARKET BRIEFING – XAU/USD (1H)
Market State:
– Price has broken out of the short-term consolidation, followed by a clean retest structure forming right at the breakout zone a classic continuation signal.
Key Levels from Chart:
– Entry Zone: around the retest area just above 4280–4286
– Stop Loss: 4262 – 4264
– Take Profit 1: 4317
– Take Profit 2: 4381
Next Move:
– As long as price holds above the SL zone and respects the breakout retest structure, XAU/USD is positioned for a continuation leg toward 4317, with potential extension toward 4381.

GBPUSD: Market Pullback Before the Next Upside Expansion1. MARKET CONTEXT
- GBPUSD has just completed a mild corrective pullback after a strong bullish leg, reflecting a healthy market reaction following the latest UK GDP release.
- The GDP data came in stable and slightly better than expected, not spectacular but strong enough to ease recession fears.
This creates a constructive environment for GBP not explosive, but certainly not bearish.
2. MACRO DRIVERS
✓ UK GDP Stability Supports GBP
Yesterday’s GDP print showed steady growth, reinforcing the view that the UK economy is gradually improving.
→ This reduces downside pressure on GBP in the short term.
✓ BOE Expected to Hold Rates Higher for Longer
With services inflation still sticky, the market is pricing in that the BOE will delay any rate cuts.
→ This acts as a tailwind for GBP during pullbacks.
✓ USD Softening as Markets Price Early Fed Cuts in 2025
Not aggressively bearish, but the USD is losing momentum as traders anticipate a shift toward Fed easing.
→ This opens the door for GBPUSD to resume its upside.
3. TECHNICAL STRUCTURE
On the GBPUSD 1H chart, price is forming a clean corrective pullback into the 1.3375 – 1.3380 support zone.
Key technical signals:
- Price is building a Higher Low after the pullback → bullish continuation structure
- Long lower wicks → declining sell pressure
- The 1.3375 support has been retested multiple times → strong demand
- The ascending trendline remains intact → uptrend not broken
→ The structure currently shows accumulation before upward breakout.
4. TRADE IDEA / PRICE EXPECTATION
As long as price holds above 1.3375, the bullish continuation setup remains valid.
Upside targets (matching your chart):
TP1: 1.34156
TP2: 1.34379
TP3: 1.34716
Expected behavior:
✔ Minor pullback
✔ Sideways accumulation
✔ Bullish leg toward TP1 → TP2 → TP3
5. MARKET SENTIMENT & OUTLOOK
With supportive GDP data, BOE’s higher-for-longer stance, mild USD weakness, and a clean bullish structure on the chart:
→ Short-term Trend: Sideways → Support → Bullish Continuation
→ Directional Bias: Upside toward all 3 targets

Bitcoin Rejected at Supply1. MARKET CONTEXT
Bitcoin on the 1H timeframe has just tapped into a clear resistance / supply zone, where previous bearish impulses originated.
The reaction is identical:
- Immediate slowdown
- Loss of bullish momentum
- Selling pressure absorbing every attempt to push higher
This confirms the market is still range-bound, with liquidity building between supply above and demand below.
2 . TECHNICAL ANALYSIS
The chart structure highlights:
• Supply Zone Rejection
Price entered the resistance zone and instantly stalled — showing strong sell orders waiting in that area.
• Lower-Timeframe Shift
The current candlestick sequence shows a micro shift from bullish impulse → correction → bearish intent.
• Liquidity & Imbalance Below
There is an unfilled region between current price and the demand zone, creating a clean path for the market to drop.
• Demand Zone Waiting at 89,300 – 87,770
This is where previous strong buy orders originated, making it the most logical target for the next bearish leg.
Overall, the structure favors a continuation downwards after a small corrective pullback.
3. TRADE IDEA
Bias: Short from the Supply Zone
The entry is positioned inside the resistance zone, aligning with institutional sell reaction.
Expected Price Behavior:
Minor bullish correction
Bearish continuation
Price targets the Demand Zone at 89,300 – 87,770
Trade Structure Shown on Chart:
Stop Loss: Above the supply zone
Entry: At resistance rejection
Take Profit: Demand zone below
This setup follows clean smart-money flow from supply → demand, with no structural break supporting a bullish reversal yet.

BTC: Price Slice. Capital Sector. 71689.50🏷 BTC: Price Slice. Capital Sector. Dated: 15.12.2025
🏷 71689.50 — Price not yet reached at time of publication
🏷 BPC Ξ-Passport: Energy Exigency & Covenant Priority
BPC 30 71689.50 EΞ = Energy Exigency | Covenant Priority: ACTIVE | Price Obligation Imminent Ξ3837 10.969065124
🏷 Screenshot
🏷 I. Interactive Reference Guide: BPC — The Bolzen Price Covenant
🏷 II. Execution Tithe
Instruction for the International Arena: Execution Tithe
🏷 P.S. English is not my native language — I offer no apologies for stylistic imperfections. What you see here is not a post. It is a demonstration of another level of preparation: the symbiosis of human intuition and algorithmic precision. Mathematics and aggressive market analysis — against the machine of liquidations.
The Architect
BPC — The Bolzen Price Covenant

ETH: Price Slice. Capital Sector. 3033.73🏷 ETH: Price Slice. Capital Sector. Dated: 12.12.2025
🏷 3033.73 — Price not yet reached at time of publication
🏷 BPC — The Bolzen Price Covenant 7
🏷 Screenshot
🏷 Interactive Reference Guide: BPC — The Bolzen Price Covenant
🏷 P.S. English is not my native language — I offer no apologies for stylistic imperfections. What you see here is not a post. It is a demonstration of another level of preparation: the symbiosis of human intuition and algorithmic precision. Mathematics and aggressive market analysis — against the machine of liquidations.
The Architect
BPC — The Bolzen Price Covenant

BTC: 82 804.29 — The Price the Market Remembers.🏷 BTC
🏷 17.11.2025
🏷 Capital Sector. Price Slice. System of Intelligent Anticipation.
🏷 82,804.29 — As of publication, this price has not been reached.
You must understand: the market has prices — and each has its own timeframe of execution. Such is the mechanics of the market. One price may execute on the 1D timeframe; another, on the 1M. The retail sector must trade from levels with risk discipline — or comprehend the market, its mechanics, and move toward the price. You must understand that a price is being fulfilled — and allow the instrument to deviate from your target, creating momentum and distance toward its realization — then capture the move on significant, higher timeframes. ATH, bear market, or bull market — these are emotions. Timeframes, patience, and strategy — these are your allies.
Some paint decor and cling to indicators — but you must understand: the institution knows. Large capital paints the data behind your indicators. With one hand, it aids others; with the other, it drives you into losses. The liquidation machine understands technical analysis and the behavioral factors of the masses. Anticipatory markings — dynamic prices — outpace algorithms. By applying observation and statistical rigor, you can avoid being deceived by the theater of market makers — and take your move.
The trend for this week, as of publication, is defined by the price of 98,200. Over the coming days, we will advance above this level in the long zone, and decline below it in the short zone. Upper targets: the instrument is directed toward the price sector of 112K–118K. Beyond this range, the probability of executing unfulfilled prices within this period is minimal. Afterward, the instrument will continue its decline to collect liquidity and execute the prices that remain pending.
Instrument volatility averages 15–18%, distributed equally in both directions. In the prior publication, 88,194.49 was established as the decisive zone — confirmed by statistical behavior of institutional capital.
Our advantage lies not only in analysis — but in the price sector we define in advance. Until these prices are executed, the dynamic marking remains active.
We do not predict the market.
We record its reality.
Please excuse any stylistic imperfections—English is not my native language. I write not to perfect form, but to reveal substance. My authority lies in the structure of the market, not in syntax.

ETH - UPDATECRYPTOCAP:ETH - Update:
Very neutral PA yet, completely stuck between 2 key levels on almost all timeframes. ⏳
Upper levels to watch: 3,175− 3,250
Lower support: 3,020− 2,980
Very tricky market nowadays, with a lot of sideways moves.
Weekly support to be maintained: $ 2,720
A weekly candle close under could confirm a medium/long-term sell alert! ⚠️
My opinion:
If price keeps consolidating above 2,980, then we could see a push toward 3,500+ 📈

ETH/USDT 1D CHart Long-Term.
🔍 Market Structure (Price Action)
1️⃣ Trend
Long-term: The uptrend has been broken (a downward breakout from the black trend line).
Medium-term: A sequence of lower highs and lower lows → a downtrend.
The current rebound is a correction in the downtrend, not a confirmed reversal.
📐 Key Levels (very well marked)
🔴 Support
2768 USDT – key support (current local bottom).
2157 USDT – final support from the previous structure (if 2768 breaks → a very real pullback).
🟢 Resistance
3506 USDT – current nearest resistance (retest after a downward breakout).
4101 USDT – strong supply zone + former support.
4477 USDT – main structural resistance (region of previous highs).
👉 Price is now exactly in the decision zone between 2768 and 3506.
📉 Trendline
Breaked and rejected (retest ended with a decline).
This is a classic signal of a downtrend continuation.
Until the price returns above 3506 and sustains, there is no uptrend.
📊 Stochastic RSI
The oscillator frequently reaches the 80–100 zone.
Currently: Moving out of overbought → signal of weakening upward momentum.
No bullish divergence → no confirmation of a trend change.
🧠 Scenarios
🐻 Baseline scenario (more likely)
Rejection of 3506
Return to around 3000 → 2768
Breakthrough of 2768 = open path to ~2150
🐂 Alternative (conditional) scenario
Daily close above 3506
Retest of 3506 as support
Only then is a move towards 4100 possible
🎯 Final conclusions
This is not a market for longs without confirmation.
The current rebound looks like a pullback in a downtrend.
Safeest:
Short at resistance (3506 / 4101)
Long only after a breakout and holding of 3506

ETH versus the worldNot pretending to be an expert but I think that what we called higher highs and higher lows.

ETHUSD - Waiting for Breakout This resistance line is being tested for the final time right now as support. Prior this line has been seen as strong resistance since the last bull run.
Price will likely break out strongly after the retest is done due to no resistance.
Still hodling out for an alt season
Daily timeframe

Be careful with Ethereum !!!The price can form a head and shoulders pattern. If that is happen, expect a significant price increase.

BRIEFING Week #50 : Post FOMC updateHere's your weekly update ! Brought to you each weekend with years of track-record history..
Don't forget to hit the like/follow button if you feel like this post deserves it ;)
That's the best way to support me and help pushing this content to other users.
Kindly,
Phil

ETHUSD H1 | Bearish Reversal Off 38.2% FIibonacci ResistanceMomentum: Bearish
Price is rising towards the sell entry, which aligns with the 38.2% Fibonacci retracement and remains below the Ichimoku cloud.
Sell Entry: 2,867.98
Overlap resistance
38.2% Fibonacci retracement
Stop Loss: 2,972.02
Pullback resistance
Slightly above the 61.8% Fibonacci retracement
Take Profit: 2,695.74
Pullback support
High Risk Investment Warning
Stratos Markets Limited (tradu.com ), Stratos Europe Ltd (tradu.com ):
CFDs are complex instruments and come with a high risk of losing money rapidly due to leverage. 70% of retail investor accounts lose money when trading CFDs with this provider. You should consider whether you understand how CFDs work and whether you can afford to take the high risk of losing your money.
Stratos Global LLC (tradu.com ): Losses can exceed deposits.
Please be advised that the information presented on TradingView is provided to Tradu (‘Company’, ‘we’) by a third-party provider (‘TFA Global Pte Ltd’). Please be reminded that you are solely responsible for the trading decisions on your account. Any information and/or content is intended entirely for research, educational and informational purposes only and does not constitute investment or consultation advice or investment strategy. The information is not tailored to the investment needs of any specific person and therefore does not involve a consideration of any of the investment objectives, financial situation or needs of any viewer that may receive it. Past performance is not a reliable indicator of future results. Actual results may differ materially from those anticipated in forward-looking or past performance statements. We assume no liability as to the accuracy or completeness of any of the information and/or content provided herein and the Company cannot be held responsible for any omission, mistake nor for any loss or damage including without limitation to any loss of profit which may arise from reliance on any information supplied by TFA Global Pte Ltd.

ETHUSD H4 | Bullish Bounce Off Pullback SupportMomentum: Bearish
Price is currently falling toward the buy entry, which aligns with a pullback support level sitting slightly above the 38.2% Fibonacci retracement. The market is also trading above the Ichimoku cloud, suggesting this zone could provide potential support for a bounce.
Buy Entry: 3,079.09
Pullback support
Slightly above the 38.2% Fibonacci retracement
Stop Loss: 2,876.32
Pullback support
Slightly below the 61.8% Fibonacci retracement
Take Profit: 3,407.09
Pullback resistance
Slightly above the 161.8% Fibonacci extension
High Risk Investment Warning
Stratos Markets Limited (tradu.com ), Stratos Europe Ltd (tradu.com ):
CFDs are complex instruments and come with a high risk of losing money rapidly due to leverage. 70% of retail investor accounts lose money when trading CFDs with this provider. You should consider whether you understand how CFDs work and whether you can afford to take the high risk of losing your money.
Stratos Global LLC (tradu.com ): Losses can exceed deposits.
Please be advised that the information presented on TradingView is provided to Tradu (‘Company’, ‘we’) by a third-party provider (‘TFA Global Pte Ltd’). Please be reminded that you are solely responsible for the trading decisions on your account. Any information and/or content is intended entirely for research, educational and informational purposes only and does not constitute investment or consultation advice or investment strategy. The information is not tailored to the investment needs of any specific person and therefore does not involve a consideration of any of the investment objectives, financial situation or needs of any viewer that may receive it. Past performance is not a reliable indicator of future results. Actual results may differ materially from those anticipated in forward-looking or past performance statements. We assume no liability as to the accuracy or completeness of any of the information and/or content provided herein and the Company cannot be held responsible for any omission, mistake nor for any loss or damage including without limitation to any loss of profit which may arise from reliance on any information supplied by TFA Global Pte Ltd.

ETHUSD H4 | Bullish ReversalMomentum: Bullish
Price is currently pulling back toward the buy entry, which aligns with the 50% Fibonacci retracement, a strong area where a bullish bounce may occur.
Buy Entry: 3,079.09
Strong overlap support
50% Fibonacci retracement
Stop Loss: 2,901.08
Pullback support
78.6% Fibonacci retracement
Take Profit: 3,407.09
Pullback resistance
High Risk Investment Warning
Stratos Markets Limited (tradu.com ), Stratos Europe Ltd (tradu.com ):
CFDs are complex instruments and come with a high risk of losing money rapidly due to leverage. 70% of retail investor accounts lose money when trading CFDs with this provider. You should consider whether you understand how CFDs work and whether you can afford to take the high risk of losing your money.
Stratos Global LLC (tradu.com ): Losses can exceed deposits.
Please be advised that the information presented on TradingView is provided to Tradu (‘Company’, ‘we’) by a third-party provider (‘TFA Global Pte Ltd’). Please be reminded that you are solely responsible for the trading decisions on your account. Any information and/or content is intended entirely for research, educational and informational purposes only and does not constitute investment or consultation advice or investment strategy. The information is not tailored to the investment needs of any specific person and therefore does not involve a consideration of any of the investment objectives, financial situation or needs of any viewer that may receive it. Past performance is not a reliable indicator of future results. Actual results may differ materially from those anticipated in forward-looking or past performance statements. We assume no liability as to the accuracy or completeness of any of the information and/or content provided herein and the Company cannot be held responsible for any omission, mistake nor for any loss or damage including without limitation to any loss of profit which may arise from reliance on any information supplied by TFA Global Pte Ltd.

ETHUSDT (4H) chart update !!ETH is trading within a contracting structure and remains above the rising support trendline.
The price was recently rejected by the descending resistance and is now retracing towards the 2,800–2,900 support zone.
As long as this support holds, a move towards 3,300 → 3,600+ remains possible.
A 4H close below 2,500 would invalidate the bullish structure and signal further downside.
DYOR | NFA

FED Turns Hawkish — Bitcoin Drops HardBitcoin has begun to move exactly in line with the projected downside structure. After rejecting the resistance zone around 91,543, price has broken below the short-term support and is now entering a clean retracement phase.
At this stage, BTC is likely to continue following the descending path toward the key liquidity zones highlighted on your chart:
Target 1: 89,068
Target 2: 87,794
Target 3: 86,386
The market structure shows clear lower highs and lower lows, signaling that sellers are currently in control. Until BTC can reclaim the mid-range zone above 90,800–91,000, the bearish outlook remains valid.
This corrective move is healthy for the broader trend, helping sweep liquidity and rebalance price before any larger directional expansion.

ETH Holding the Trendline - Bulls Aiming for the Resistance Zone1. MARKET CONTEXT
Macro sentiment remains stable, with crypto recovering after minor pullbacks. No major bearish catalysts risk assets are still supported as liquidity conditions remain favorable.
2. TECHNICAL ANALYSIS
Price is riding a clean ascending trendline.
A support zone sits directly below current price, providing a strong demand base.
Market structure remains higher highs – higher lows, confirming bullish control.
Expectation: a small pullback into trendline + support → continuation move upward.
3. TRADE IDEA
Bias: Long on retracement into support/trendline
Target: Resistance zone at 3440–3450
Invalidation: Break below the support zone
ETH is primed for a trend-continuation move as long as price respects the ascending structure.

ETH/USD Just Found Key Support - Is the Next Breakout Coming?🔹 MARKET BRIEFING – ETH/USD (1H)
Market State:
– Ethereum is holding strong above the key support level around 3,050, showing bullish momentum after bouncing from this level. A retest of the support zone seems to have set up the potential for another leg higher.
Key Levels:
– Support Zone: 3,050
– Target 1: 3,100
– Target 2: 3,150
– Resistance Zone: 3,200
Next Move:
– With price respecting support at 3,050, ETH/USD is poised for another rally toward 3,100 and 3,150, aiming for a test of the 3,200 resistance.

Is BTC Ready for a Major Breakout? Watch These Levels!BTC/USD 1-Hour Market Analysis
1. Current Price Structure
BTC has been trading within a range, bouncing between the resistance zone around 94,000 and the support zone near 89,300.
The chart shows clear retracements with higher lows forming within the support range, signaling potential for upward movement.
2. Liquidity Zones
The resistance zone (94,000) continues to act as a solid barrier. A breakout above this level could pave the way for price to surge higher towards the target levels.
On the downside, support zones (89,300) have been effectively holding, providing a floor for the price action.
3. Potential Scenarios
Bullish Scenario: If BTC breaks the resistance level (94,000), we can expect an impulsive rally targeting 94,500 and then reaching 95,000+.
Bearish Scenario: If BTC fails to hold above 89,300, it might retest the support zone, opening the door for a decline towards 87,000.
4. Market Sentiment
The market seems to be in a consolidation phase with liquidity accumulation at key support and resistance levels.
Investors should be cautious of false breakouts in this range as the market is in a waiting mode before key data releases (i.e., NFP, ADP) that could dictate the next major move.
5. Trading Strategy
Buy near Support at 89,300 with a target around 94,000.
Sell near Resistance at 94,000 if price fails to break through, targeting 92,000-91,500.
Be sure to monitor the liquidity closely as this could indicate a potential breakout or breakdown.

ETH: Price Slice. Capital Sector. 2648.94 🏷 ETH: Price Slice. Capital Sector. Dated: 13.12.2025
🏷 2648.94 — Price not yet reached at time of publication
🏷 BPC — The Bolzen Price Covenant 5
🏷 Screenshot
🏷 Interactive Reference Guide: BPC — The Bolzen Price Covenant
🏷 P.S. English is not my native language — I offer no apologies for stylistic imperfections. What you see here is not a post. It is a demonstration of another level of preparation: the symbiosis of human intuition and algorithmic precision. Mathematics and aggressive market analysis — against the machine of liquidations.
The Architect
BPC — The Bolzen Price Covenant
