ETH SELL SETUP ACTIVEETH SELL SETUP ACTIVE ⚡
📌 Trade Plan:
🔓 Entry: 2900 - 2890
❌ Stop Loss: 2860
🎯 Target: 2960
ETH rejected from a strong supply zone after showing clear weakness and momentum shift. Smart money distribution + structure break confirms a high-probability sell. Clean risk management, clear levels — trade the plan, not emotions.
📌 Follow for more accurate, level-based setups
⚠️ Educational purpose only. Not financial advice.
Ethanalysis

ETH | UPDATE📊 ETH Update — Momentum Zone in Focus
Ethereum is trading near an important structure area where buyers have previously stepped in. Holding above this support keeps the bullish bias intact, and a strong reaction from this zone could open the door for a move toward the next resistance level.
🔓 Entry: 2,948
❌ Stop Loss: 2,865
🎯 Target: 3,027
Volume and price behavior around these levels will be key.
Do you see continuation from here or a pullback first? Share your view below 👇
A like/support helps this idea reach more traders 🚀
⚠️ Disclaimer: This reflects personal market analysis and is not financial advice.

ETHEREUM Analysis (12H)From the point where we marked the green arrow on the chart, the Ethereum triangle has begun, and at the point where we placed the red arrow, this triangle has completed and the price has entered a bearish phase.
It seems that we are currently in the late stages of wave C of this phase. Just note that this is the 12-hour timeframe, and this phase has not finished yet; its completion requires more time. We expect wave C to finish within the green zone, which is a supportive flip area.
From the green zone, wave C is expected to complete and the price should enter wave D, for which we have marked the targets on the chart.
Let’s see how it will unfold.
For risk management, please don't forget stop loss and capital management
When we reach the first target, save some profit and then change the stop to entry
Comment if you have any questions
Thank You

ETHEREUM Analysis (12H)A large amount of liquidity has been hunted at the top, which corresponds to the all-time high. After this liquidity was taken, the price entered a bearish structure with strong momentum.
For this bearish structure to reverse or slow down, sufficient liquidity needs to be collected from the lower areas of the chart.
There is a possibility of a temporary rebound from the current levels, but the main reversal should come from the lower zone that we have identified.
We still maintain this outlook on Ethereum in the daily and 12-hour timeframes
Do not enter the position without capital management and stop setting
Comment if you have any questions
thank you

ETHmas Tree...Oh, ETHmas Tree...Thy Candles are so Falling!!!What in the World is going on with ETH, you say??? Well, this is following our market structure almost to a T. See my previous posts on ETH to see how we got here and why the market is moving the way it is. This is Structural Market Making Moves, and has absolutely nothing to do with the News, Tariffs, Fed Reports, etc.
What just happened:
In the last look, we had an H1 BOS up that led us all the way back up to this H4 Supply Zone. Over the Thanksgiving Holiday and long weekend, the market tried to push up and break out of this zone. BUT...it is an H4 Supply zone, and as mentioned previously, there are a LOT of sellers waiting to sell their ETH here. After failing to overcome those sellers, we have seen the huge rejection expected.
What is significant about this move:
It is VERY important to note now that during all of this up and down over the weekend, and the ultimate failure to break any higher, we have gotten an H4 BOS Up from the lows....This H4 Supply Zone was broken with a closed H4 Candle. So, at this point we are looking for the market to push back down to the Source of that H4 BOS ~ (2680 - 2750). So, this huge fall we've just seen should take us back down to that area to retest and see IF the overall Fall from All Time Highs is finally over.
What to look for:
From here, we need to watch as we approach this H4 BOS Source and look for signs on the 15 min that the drop will end there. The H4 BOS could hold, but there is still the prevailing Weekly Demand Zone (~2150 - 2670) that is what is overall pulling the price down. So, this H4 BOS zone is the first attempt to see if the Weekly Zone is satisfied.
If this H4 BOS Zone holds and we do not get an H4 close below it, ETH could finally start to regain strength. Otherwise, if this H4 BOS Zone gets broken with an H4 close, then the weekly takes over again, and we're back to looking at the Weekly View. The Daily Source of that large weekly zone is still the target (~2150-2300).

ETH vs BTC- Sometimes when we look at markets, we get confused by all the noise, Trump and governments news, ETFs, FED, bans, SEC, FUD, FOMO, fake stories, and more.
- As a trader, you must always step back from news, view the trend from a distance, and filter out that noise.
--------------------------------------------------------------------------------------------------------
Trading Parts (Monthly TF) :
--------------------------------------------------------------------------------------------------------
- Look at the trend and indicators, that’s what you should focus on first. ETH reached its all-time high in November 2021, and then retested that same ATH level in August 2025.
- Now look at the RSI and MACD levels at that time... In 2021, the RSI was overbought and the MACD crossed downward.
- Alright, now compare with where we are today. The RSI is only halfway to the top (even though ETH has already reached $5K again), and the MACD just crossed upward a few months earlier.
--------------------------------------------------------------------------------------------------------
In my opinion, we’re not topped yet and ETH still low. They will always try to scare you out so they can buy your bags cheaper.
Keep your attention on the opportunities others can’t see.
Happy Tr4Ding !

Ethereum Roadmap: Will ETH Bounce or Begin a Deeper Correction!?Today, I’d like to dive into an analysis of Ethereum ( BINANCE:ETHUSDT ). Given that over 80% of tokens in the crypto market are built on the Ethereum blockchain, Ethereum’s performance can serve as a roadmap for other tokens on the network.
So, stay tuned!
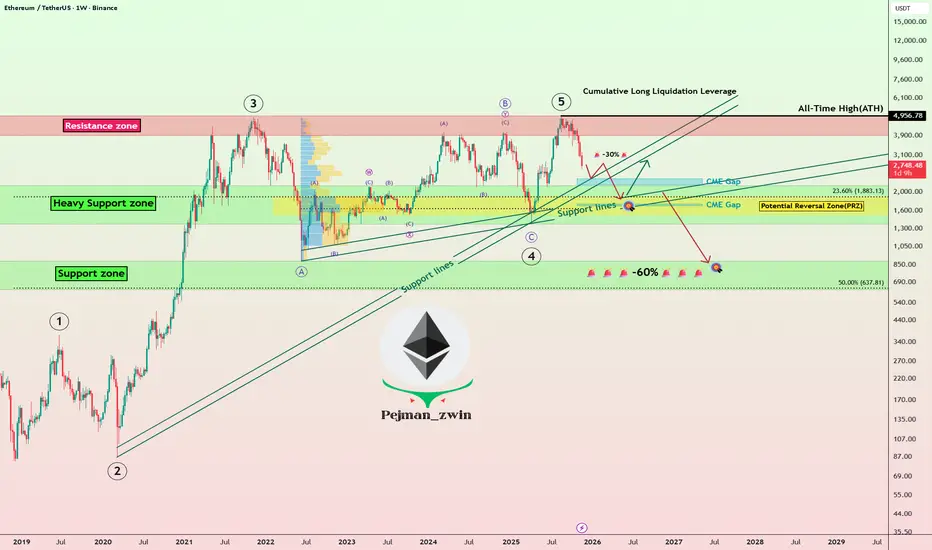
In recent times, Ethereum hasn’t been able to keep pace with Bitcoin’s growth and struggled to set a new All-Time High(ATH=$4,956). After Bitcoin’s decline, Ethereum also started to drop and is currently moving near the Heavy Support zone($2,160-$1,370), Support lines, Cumulative Long Liquidation Leverage($1,745-$1,629), and Potential Reversal Zone(PRZ) .
From an Elliott Wave perspective, it seems that Ethereum has completed its main five-wave impulsive. This suggests that we might now be entering a corrective phase. The extent of this correction will depend on multiple factors, and technical analysis alone won’t predict the exact magnitude of Ethereum’s decline in the coming days or weeks. Nonetheless, I’ll keep you updated step-by-step.
Looking at the USDT.D%( CRYPTOCAP:USDT.D ), it’s currently on an upward trend. This rising dominance can lead to further declines in Ethereum, reinforcing the bearish outlook.
Another important index is the US 10-Year Government Bond Yield ( TVC:US10 ). If the US 10-Year Government Bond Yield continues its upward movement, it can put additional pressure on risk assets like Bitcoin( BINANCE:BTCUSDT ) and Ethereum, leading to further declines.
Now, the question is: where might we see Ethereum resume its upward trajectory?
It’s likely that Ethereum will continue its downward movement(-30%), potentially filling the CME Gap($2,344-$2,186), CME Gap($1,745-$1,629) near the $2,000(Round Number). Once it stabilizes around that zone, we could look for signs of a recovery.
However, if Ethereum breaks below its Heavy Support zone($2,160-$1,370), we might face even more significant declines, potentially exceeding -60%.
Where do you think Ethereum will start to rise again? Or are more red days ahead?
💡 Please respect each other's opinions and express agreement or disagreement politely.
📌Ethereum Analyze (ETHUSDT), Weekly time frame.
🛑 Always set a Stop Loss(SL) for every position you open.
✅ This is just my idea; I’d love to see your thoughts too!
🔥 If you find it helpful, please BOOST this post and share it with your friends.
ETHEREUM Roadmap (3D)This is a broader outlook on Ethereum in the higher timeframe.
From the point marked as "Start" on the chart, it seems that Ethereum's correction has begun, forming an ABC pattern. Wave B appears to have completed as a symmetrical structure, and we are likely in wave X of B or wave C.
We expect a price rebound from the green zone.
So, keep a close eye on the chart and monitor it carefully.
For risk management, please don't forget stop loss and capital management
When we reach the first target, save some profit and then change the stop to entry
Comment if you have any questions
Thank You

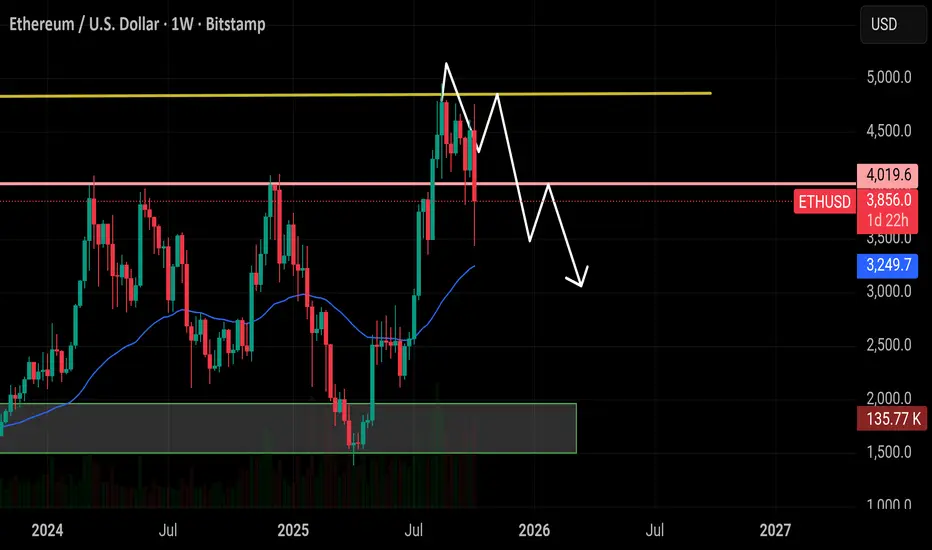
Ethereum Recovery Stalls — $3K Retest on the Horizon?After the flash crash on October 10th, ETH recovered quite well — but as mentioned at that time, for a full recovery and return to a bullish tone, the price needed to reclaim the $4,300 resistance.
That never happened...
After a second attempt on Monday, the price is now back below $4,000, testing the recent short-term support zone.
Looking at the broader structure since early August, the market has turned decisively bearish, showing two clear phases of distribution.
As previously noted, the price continues to press against the confluence support, and I expect a breakdown to occur soon.
If that happens, ETH could fall toward the $3,000 area to retest the major support level that dates back to 2024.

ETH Analysis (4H)After the heavy dump on altcoins, the market is still quite volatile. However, after several days and weeks of ranging, it’s gradually returning to normal and becoming more predictable for analysis.
Ethereum has formed a reversal pattern at the bottom and has made three higher lows. It’s expected to move toward the red zone while holding the green area, and then get rejected toward lower levels.
The best area for a long buy is the green box, and the best area for a short sell is the red box.
Let’s wait and see what happens next.
For risk management, please don't forget stop loss and capital management
When we reach the first target, save some profit and then change the stop to entry
Comment if you have any questions
Thank You

BTC Reign Pauses. Can ETH Lead the Charge Temporarily?A Tale of Two Titans: Divergence in the Making
Following the market-wide drop on October 10th, 2025, a significant divergence in character has emerged between the two crypto titans, Bitcoin and Ethereum. While Bitcoin's bullish structure appears compromised, Ethereum is exhibiting remarkable resilience, tenaciously holding key support and potentially setting the stage for a period of ETH-led market action.
This analysis explores the possibility of a temporary decoupling, where Ethereum takes the reins while Bitcoin enters a period of consolidation.
Bitcoin: Structure Compromised
From my perspective, the recent crash has severely compromised the prior bullish structure on Bitcoin's daily and weekly charts. The upward momentum has been invalidated, leaving BTC in a state of structural weakness. The most probable path forward for BTC appears to be a prolonged period of sideways consolidation, likely forming a complex flat correction. For now, the king seems to be resting in its coffin.
Ethereum: The Resilient Contender
In stark contrast, Ethereum’s chart tells a very different story. Here's why ETH is capturing our full attention:
Crucial Support Holds Firm: ETH is impressively defending the critical support zone around $3,756. Its refusal to follow BTC into a deeper decline is a powerful statement of relative strength.
Intact Market Structure: Unlike Bitcoin, Ethereum’s weekly and daily upward structures remain intact. The long-term bullish thesis is not yet broken (Weekly chart upward structures & Elliot are still holding targeting around 5900 USDT)
Emerging Elliott Wave Count: As illustrated on the daily chart, a weak but valid Elliott Wave count is taking shape. We appear to have completed a Wave (2) correction right at this key support. If this level holds, it paves the way for a powerful Wave (3) impulse to the upside.
Confluence of Bullish Divergences: Adding significant weight to this outlook are the strong bullish divergences flashing on both the Daily and 4-Hour charts. Around the $3,756 support, both the RSI and MACD are showing higher lows while price has tested lower lows — a textbook signal of waning bearish momentum and a potential reversal. Should this scenario materialize, we can expect a notable increase in weekly and monthly volatility as momentum shifts.
RSI divergence on 1D chart
MACD Divergence
OBV (4H chart) note that obv always making higher lows around the current support
BBWP contraction on 4H chart
The Big Question: A Changing of the Guard?
This brings us to a fascinating and potentially market-defining question: Can Ethereum lead the crypto market to new all-time highs while Bitcoin moves sideways?
We may be witnessing a temporary 'changing of the guard,' where ETH's fundamental strength and resilient technicals allow it to become the market's temporary primary driver. While Bitcoin's gravity is undeniable, the current situation suggests that Ethereum might be carving its own path.
The confirmation of this thesis rests on the $3,756 support. A sustained hold above this level could be the opening act for the next major bull run, led by an unexpected protagonist.
Share your thoughts in the comments

ETH/USDT — Critical Retest at 3950–3520 Before Next Major Move?Ethereum has once again faced strong rejection from the key supply zone between 4,940–5,272 (Fib 0.5–0.618), signaling heavy selling pressure at this multi-year resistance area.
Price action now points toward a potential retracement into the major demand zone (yellow block) between 3,950–3,520, where the next directional move is likely to be decided.
---
📊 Key Technical Structure
Major Supply Zone: 4,940 – 5,272 (Fib 0.5–0.618)
Minor Support: 4,120
Primary Demand Zone (Yellow Block): 3,950 – 3,520
Next Supports (if broken): 3,210 → 2,132
Bullish Fibonacci Targets: 6,345 → 8,082 → 10,891
---
📈 Bullish Scenario — “Reclaim & Expansion”
ETH still maintains a macro structure of higher-highs and higher-lows on the weekly timeframe.
As long as the 3,520 support holds, the broader trend remains bullish.
A strong rebound from 3,950–3,520 followed by a weekly close above 5,272 would confirm bullish continuation and open up:
Target 1: 6,345 (Fib 1.0)
Target 2: 8,082 (Fib 1.618)
Target 3: 10,891 (Fib 2.618 — potential cycle top)**
The key confirmation for bulls is a weekly reclaim above 5,272 with volume.
---
📉 Bearish Scenario — “Breakdown & Deeper Retracement”
If the selling pressure continues and ETH closes below 3,520, the bullish structure will be invalidated.
Such a breakdown could trigger a deeper retracement toward:
3,210 (Fib 0.618 confluence)
2,132–1,955 (deeper structural retracement)
Failure to defend the yellow block would shift ETH into a lower-high / lower-low structure, signaling a medium-term trend reversal.
---
🔍 Market Context
ETH is currently retesting the same macro resistance zone that marked the all-time high area in 2021.
The rejection at 5K highlights that supply remains dominant in this region, while the 3,950–3,520 demand block now serves as the key battlefield for bulls and bears.
As long as the yellow block holds, this pullback can still be considered a healthy correction within a macro uptrend.
But if it breaks, the market may enter a prolonged consolidation phase before the next cycle begins.
---
📍 Summary
Ethereum stands at a major inflection point:
Bullish Case: Bounce from 3,950–3,520 and reclaim 5,272 → targets 6.3K – 8K – 10.8K
Bearish Case: Breakdown below 3,520 → deeper correction to 3.21K or even 2.13K
The 3,950–3,520 demand zone is the final defense for ETH’s mid-term bullish structure — hold it, and the trend continues; lose it, and momentum fades.
---
#Ethereum #ETHUSDT #Crypto #TechnicalAnalysis #Fibonacci #PriceAction #CryptoMarket #WeeklyChart #ETHAnalysis #MarketStructure

$ETH hit our first target at $3,500 exactly as expected.CRYPTOCAP:ETH hit our first target at $3,500 exactly as expected. As mentioned, a short bounce from that zone played out with an $800 move, pushing the price above $4,300. Now ETH is trading around $3,800. For a sustained upside, it needs to reclaim $4,000 as support. I’m still holding my short setup if $4,000 isn’t regained, the next downside targets remain $3,500 and $3,000.
Only your like motivate me
BITCOIN, BITCOIN DOMINANCE, ETHEREUM ANALYSIS 9-14-25Bitcoin has done a nice pullback from the initial sell off from the all time high and found a good support on the 21 EMA on the weekly chart. From the 21 EMA on the weekly chart it's now at a fib resistance level of 0.5 and could potential push up to the 0.618 fib level( 118k) otherwise my expectation is that the pullback is done and another sell off is likely to send price done to the 200 EMA on the daily chart or potential target of $105,530 in the coming week.
Ethereum is also struggling at the 2021 resistance high and more likely to pullback to the 0.382 level ($3,823) before it's continuation to higher high breakout of the 2021 resistance level.
BTC dominance is still in a strong down trend but quite oversold and likely to bounce up a little to the 58% level before continuation of the down trend. I think BTC. Dominance will ultimately reach a bearish Pennant Target of about 55% before a potential reversal.
Thank you for reviewing my analysis and don't hesitated to share your thoughts in the comments section. cheers and I wish you the best of trades this week.

ETHERUM New Analysis | Be Careful (4H)This analysis is an update of the analysis you see in the "Related publications" section
Considering the lack of price penetration and the formation of higher highs at the first supply zone, Ethereum may have already started its drop without a recovery and could move from the current area toward the $3,700–$3,500 range. So stay alert and manage your risk carefully.
There is still a slight chance of a price rebound to the upside.
For risk management, please don't forget stop loss and capital management
Comment if you have any questions
Thank You

Ethereum Analysis (4H)It seems the price is not yet ready for a strong rejection to the downside, and buyers still hold strength. It is expected that, with the interaction or liquidity hunt that previously triggered a strong upward move, we may see another bullish wave. This move would both reinforce a bullish sentiment in the market and allow major players’ orders to be filled.
For a rejection to occur, it will either happen from the premium zone of the previous wave, or a new all-time high might form.
Let’s see how the market reacts to the highlighted red zone.
For risk management, please don't forget stop loss and capital management
When we reach the first target, save some profit and then change the stop to entry
Comment if you have any questions
Thank You

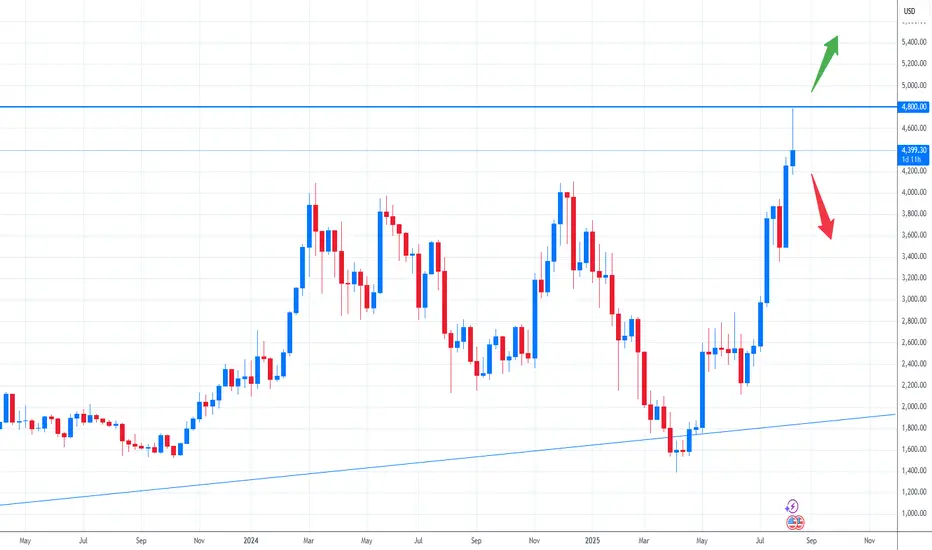
Bullish Ethereum will happen; New top happens upon 4900$After a clear pullback to 4399$ Ethereum is heading toward its ATH in order to break it. Candle shape near the bullish trendline and on the support level illustrates a bullish move to 4900$. A break at 4900$ means a new ATH at 5k and higher.

Ethereum New Analaysis (4H)Now, Ethereum may face a serious correction after making one more high. So pay close attention to the $4900–$5000 zone.
For this bearish scenario to play out, the SWAP zone on the 12H or daily timeframe must be broken and price must hold below it.
A daily candle closing above the invalidation level would nullify this analysis.
For risk management, please don't forget stop loss and capital management
When we reach the first target, save some profit and then change the stop to entry
Comment if you have any questions
Thank You

Ethereum Correction Ending? Next Bullish Wave Loading!In the previous idea , I was able to find the Ethereum price top at $4,788 . The question is, has the Ethereum correction begun, or is there still hope for the creation of a new All-Time High(ATH)?
Ethereum ( BINANCE:ETHUSDT ) is currently trading near the Support zone($4,240-$4,186) , Cumulative Long Liquidation Leverage($4,205-$4,158) , and important Support lines .
In terms of Elliott Wave theory , it seems that Ethereum has completed a corrective wave . The corrective wave has a Double Three Correction structure(WXY) . If the Resistance zone($4,410-$4,324) and Cumulative Short Liquidation Leverage($4,416-$4,375) are broken, we can confirm the end of the corrective wave .
I expect Ethereum to start rising from important support lines and rise to at least $4,373 .
Second Target: $4,484
Third Target: $4,607
Stop Loss: $4,097
Note: Today's Fed Chair Powell Speaks can create excitement in financial markets, especially crypto.
Please respect each other's ideas and express them politely if you agree or disagree.
Ethereum Analyze (ETHUSDT), 1-hour time frame.
Be sure to follow the updated ideas.
Do not forget to put a Stop loss for your positions (For every position you want to open).
Please follow your strategy and updates; this is just my Idea, and I will gladly see your ideas in this post.
Please do not forget the ✅' like '✅ button 🙏😊 & Share it with your friends; thanks, and Trade safe.
ETHEREUM GETTING BULLISH AGAINOn the daily chart, Ethereum holds above the trendline and 20 MA; yesterday's candle is a bullish engulfing. Sub-4k was tested as expected, and Ethereum is ready to take off again to break its all-time high at 4800.

Ethereum Faces Correction After Retesting All-Time HighEthereum (ETH) is currently trading around USD 4,391 after testing its all-time high from November 2021. The rejection at that level mirrors Bitcoin’s pullback on the same trading day last week, suggesting broader weakness across the crypto market.
The weekly chart shows a bearish pinbar candlestick, signaling potential continuation of the correction. This setup reinforces the risk of further downside, with the double top formation adding negative momentum. The USD 4,000 zone remains the first key support, as it previously acted as a major resistance. A decisive break below could pave the way toward USD 3,400, a deeper but technically significant support area.
Other factors also point to caution. Rising U.S. Treasury yields and ongoing dollar strength weigh on crypto sentiment, while profit-taking after a sharp rally is adding to pressure. On-chain data shows a slowdown in active wallet growth, which may indicate waning short-term demand.
Still, medium-term fundamentals remain supportive, with strong interest in Ethereum’s DeFi and staking ecosystem. However, in the short run, technical signals favor a correction. Traders should watch whether 4,000 holds—failure could open the door to a deeper retracement before the uptrend resumes.
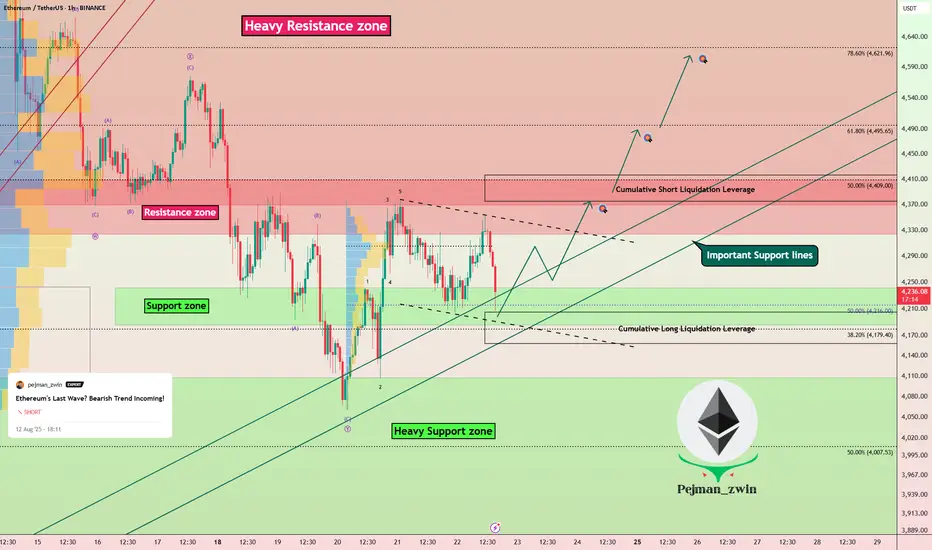
Ethereum's Last Wave? Bearish Trend Incoming!Ethereum ( BINANCE:ETHUSDT ) started to rise and pump as I expected in the previous idea .
Ethereum is currently trading in a Heavy Resistance zone($4,868(ATH)-$3,977) near the Potential Reversal Zone(PRZ) , Cumulative Short Liquidation Leverage($4,527-$4,452) , and the upper line of the ascending channel(potential) .
In terms of Elliott Wave theory , Ethereum appears to be completing microwave 5 of main wave 5 . Main wave 5 could complete at the Potential Reversal Zone(PRZ) .
Also, we can see the Regular Divergence(RD-) between Consecutive Peaks .
Before any conclusions, let's take a look at the ETHBTC ( BINANCE:ETHBTC ) chart.
ETHBTC also indicates the end of the uptrend, and if the market falls , we can expect ETH and the tokens on the Ethereum blockchain to undergo a correction this time.
I expect Ethereum to bearish trend in the coming days and at least close the CME Gap($4,185-$4,080) .
One of the tokens that we can use for short positions alongside Ethereum is the ENS token ( BINANCE:ENSUSDT ). ENS is the decentralized naming system built directly on the Ethereum blockchain, simplifying crypto addresses into human-readable names .
Cumulative Long Liquidation Leverage: $4,145-$4,094
CME Gap: $3,461-$3,417
Note: Stop Loss: $4,780
Do you think Ethereum will create a new All-Time High(ATH) soon, or should we wait for a correction?
Please respect each other's ideas and express them politely if you agree or disagree.
Ethereum Analyze (ETHUSDT), 4-hour time frame.
Be sure to follow the updated ideas.
Do not forget to put a Stop loss for your positions (For every position you want to open).
Please follow your strategy and updates; this is just my Idea, and I will gladly see your ideas in this post.
Please do not forget the ✅' like '✅ button 🙏😊 & Share it with your friends; thanks, and Trade safe.

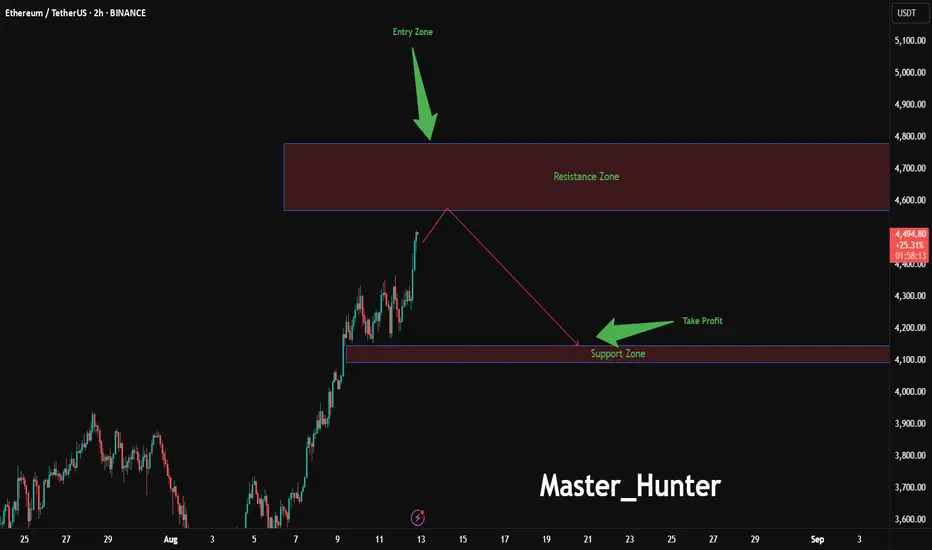
Ethereum Drop Zone Approaching?BINANCE:ETHUSDT is flashing warning signs on the 2-hour chart, with an entry zone between 4570-4780 near a critical resistance level that has capped recent rallies.
This setup suggests a potential reversal , targeting a profit zone between 4145-4093 where strong support and the 200-day EMA converge. Set a stop loss at 4780 on a close above to protect against a false breakout, keeping risk tightly controlled. A break below 4550 with increasing volume could confirm the downward move, especially if Bitcoin leads the market lower.
Keep an eye on Ethereum network upgrades and overall crypto market sentiment, as these could act as key catalysts. This trade offers a strategic opportunity for those ready to navigate the volatility—share your insights below!
#ETHUSDT #EthereumTrading #CryptoSignals #TechnicalAnalysis #TradingView #DayTrading #MarketAnalysis