The 4 TOTAL Crypto Charts with Easy to see performance values
These charts use the " RK's 10 ∴ MA Types Ribbons (Fibonacci, Guppy and others) " indicator in TradingView.
It is simply SUPERB and is unparalleled.
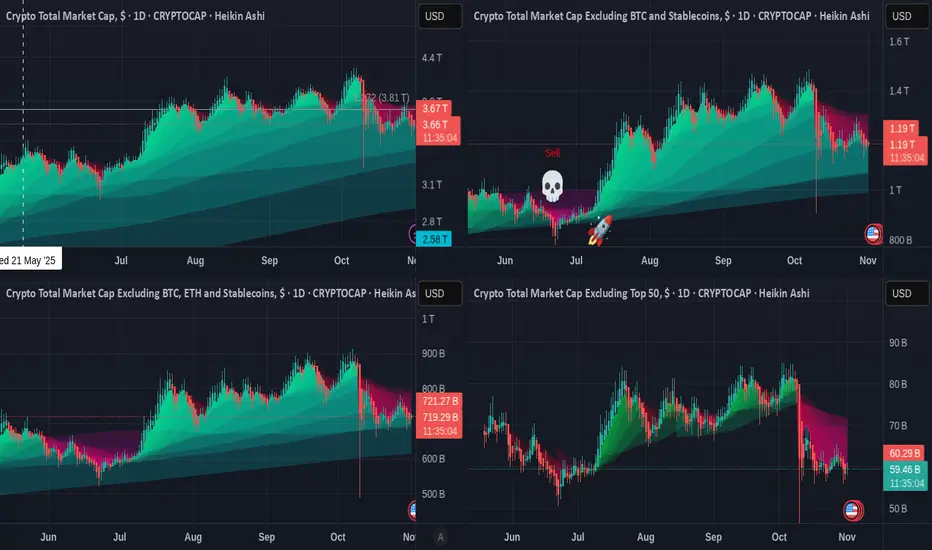
So, to business. These are all DAILY charts from around mid MAY 2025
Top Left TOTAL chart - Top Right TOTAL2 (Excluding Bitcoin)
Bottom Left TOTAL3 ( Excluding BTC & Eth ) - OTHERS ( Top 125 coins minus top 10 by Market Cap )
First thing to notice is simply how the TOTAL chart is the Deepest, showing a Bigger Market trading volume. This shows us how it is BITCOIN that holds the market as all the other charts EXCLUDE Bitcoin and are more Shallow by comparison.
We can also see how the TOTAL2 chart ( exc BTC) is the only one with a SELL signal. This is the Fragility of ETH.
Looking to the RED zones on these Charts. This is where Moving Averages Fell, crossing each other as Price dropped.
The TOTAL chart has the smaller red zones, showing more resilience,
And we can see the progressively worsening situation in the ALT market, with OTHERS having a truly terrible time.
There are people out there Still Claiming an ALT Season like we used to know, is on its way.
I am sorry but while it is obviously possible, It seems obvious to me that Times HAVE changed.
The 4 DOMINANCE charts also tell us a story
These are WEEKLY charts :-
Top Left BTC.D - Top right ETH.D
Bottom Left OTHERS.D - bottom Right USDT.D
We all know about Bitcoins utter Dominance this cycle, the main cause of the lack of a sustained ALT season. TOTAL chart, or BITCOIN is the only one that remains above its 100 EMA (blue), 128 EMA ( green) and the 200 EMA ( Yellow)
None of the other charts involve Bitcoin and they are Not as strong.
We See how ETH.D was falling away until recently when it turned higher in late April 2025 but as we see from the main chart, this failed to really make any inroads into Bitcoins status, and is now once again falling away
What is VERY Telling os how the OTHERS.D has been falling away since March 2024.
ALTS have been loosing the battle for over a year now, a sustained growth never appeared.
Quick flash in the Pan rises followed by massive sell offs.
Apart from some coins that have sustained growth, like SOLANA and BNB but this is another story for another post.
What I do find very interesting is how USDT.D is in a diminishing pennant....the use of USDT getting smaller and smaller as "Cashing out" is reduced.
So, where are we in the Market ?
I feel that the ALT Traders will soon begin to loose Faith and may begin the flow of whats left into the ore established ALTS...like SOLANA, BNB and maybe XRP etc. Rotation will begin.
The USa Will continue to push ETH as an alternative for BTC
I think we have a Very strong possibility this "Bull run" will morph into the Normality of Crypto, we may not see the massive sell off we got used to previously.
This will curb the massive profit possibilities and no one wants to see this but Bitcoin has Matured away from the petulant teenager...and is now an Adult.
This is very much my opinion and YES, I do still Hold some ALTS.....
But BITCOIN has ABSOLUTELY CONTROLLED THIS and will continue to do so.
Ethdominance
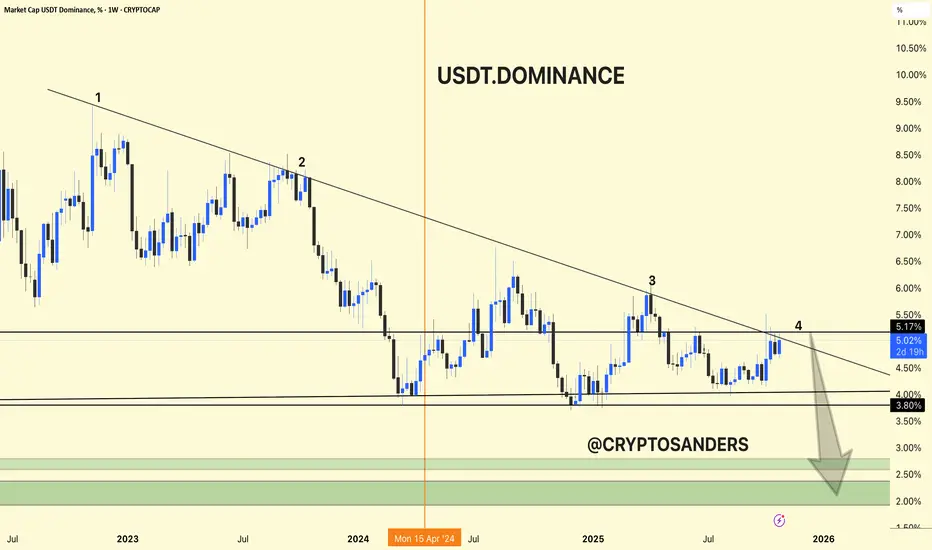
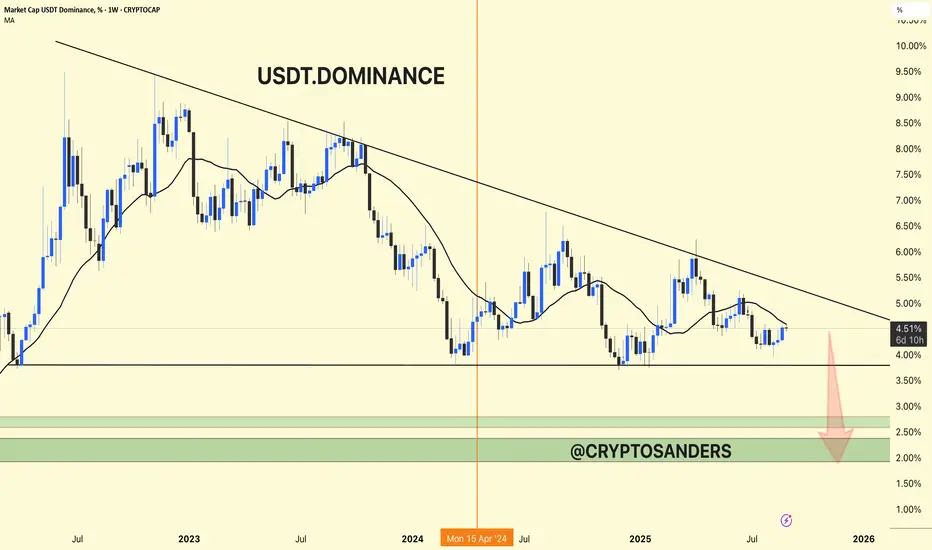
USDT.DOMINANCE CHART ANALIYSIS !!USDT Dominance Chart Update.
USDT dominance is again rejecting at the long-term trendline resistance (point 4), currently around 5.17%.
Structure suggests another potential move lower, with possible targets in the green zone (2.0%–3.0%) if the downtrend continues.
This scenario typically favors fresh capital rotation into Bitcoin and altcoins as traders de-risk from stablecoins.
Summary:
USDT dominance remains weak below the trendline. A sustained drop could spark further altcoin momentum and a broader crypto rally.
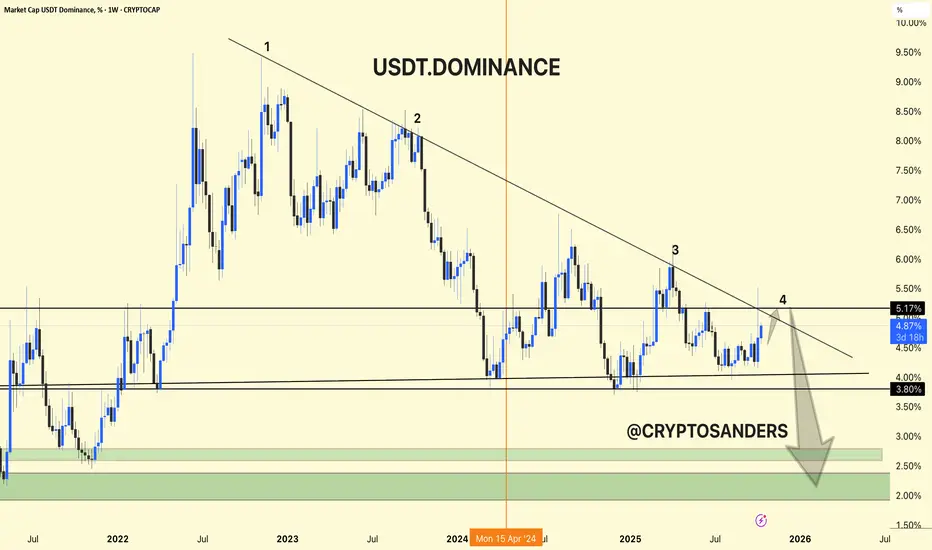
USDT Dominance - Weekly Chart Overview !!USDT Dominance - Weekly Chart Overview
Current Level: 4.88%
Trend Structure: The chart clearly forms an aspect ratio pattern, consisting of a series of lower highs and lower lows since mid-2022.
Ascending Telgero/Declining Channel - Continuous pressure is being displayed from the ascending Telgero.
1. Key Resistance Area (5.0%–5.2%)
USDT Dominant is currently undergoing a restart test of the ascending critical line, which has acted as strong resistance several times in the past.
Every time the price retests this trend line, it corrects – indicating a shift of funds from stablecoins to crypto assets.
If the price does not close above 5.2%, it could trigger the next bearish move to the downside.
2. Support Levels
First Support: Around 3.8% – a key chocolate demand area.
Key support zone: Between 2.0%-2.5% (green zone applied).
This level is typical of the Initial Petroleum Model and historically marks major crypto bull runs.
3. Uptrend Outlook
The large downward arrow on the chart indicates a continuation of the slope.
If dominance is below 3.8%, it could move towards the 2-2.5% zone, which indicates that traders are shifting investments from USDT to BTC and altcoins – a bullish trend for the crypto market.
This means that traders are selling crypto and holding stablecoins → risk-off, fear in the market.
When USDT dominance falls:
It means that money is flowing from stablecoins to BTC and altcoins → risk-off sentiment, confidence is returning.
DYOR | NFA
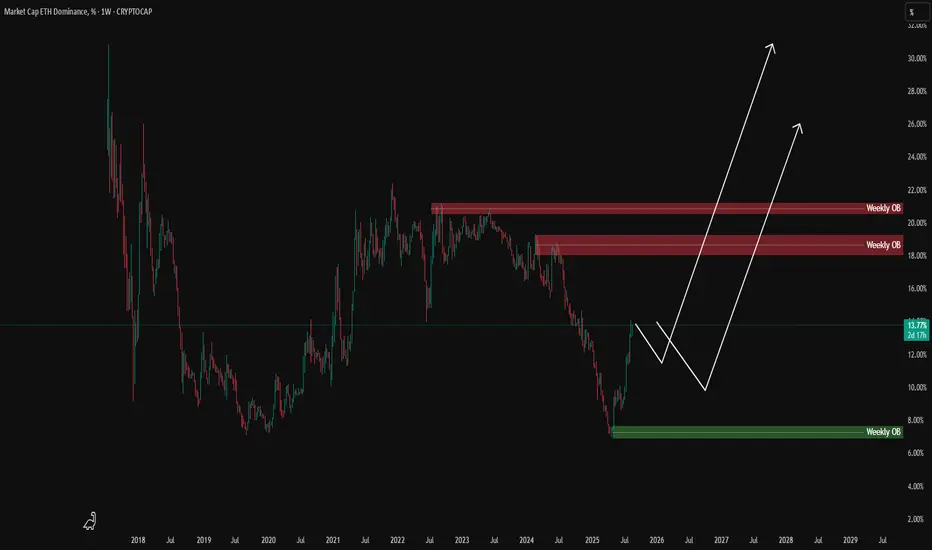
ETH.D (Ethereum Dominance) Weekly TF 2025
Summary:
Ethereum Dominance (ETH.D) has likely bottomed after retracing to its 78.6% Fibonacci level (~6.59%) and is showing early signs of a structural reversal. With institutional inflows, growing staking adoption, and key upcoming Ethereum upgrades, ETH.D may reclaim significant market dominance over the next 12–18 months. Our chart anticipates a bounce-pullback-rebound structure, aiming for 3 target zones: TP1 (23.5%), TP2 (30.8%), and TP3 (39%).
Contextual Market Alignment:
This ETH.D bullish bias aligns strongly with our broader market outlook:
TOTAL Market Cap Analysis → Bullish breakout structure, indicating overall crypto expansion.
TOTAL2 (Altcoin Market Cap Ex-BTC) → Bullish retracement completion and extension targets active.
BTC.D (Bitcoin Dominance) → Bearish confluence zone, suggesting Bitcoin may underperform versus ETH and altcoins, freeing up dominance space for ETH.D to rise.
Chart Context:
This weekly ETH.D chart uses a Fibonacci retracement from the top (~30.81%) to bottom (0%) to identify potential reversal zones. The dominance hit a key support area at the 78.6% Fib retracement (6.59%), showing a reaction that may develop into a reversal. The roadmap includes:
Rebound toward TP1 (23.54% = 23.5%)
Minor correction or consolidation
Breakout continuation toward TP2 (0.0% = 30.8%)
Extension leg targeting TP3 (–27% = 39%)
Key Technical Observations:
Support Levels:
78.60% = 6.59% (bottom support)
88.60%=3.5%
Possible Resistances:
61.80% = 11.77%
48.60% = 15.84%
38.20% = 19.04%
Resistance & TPs:
TP1: 23.54% (23.6% Fib)
TP2: 30.81% (Full retrace = 0%)
TP3: 39.13% (–27% extension)
Current level: ~9.36%
Clear bullish structure with a “bounce–pullback–rebound” sequence
Indicators:
Fibonacci retracements from ~30.81% to 0%
Structural pattern: rounded bottom / double bottom
Hidden bullish divergence forming on weekly timeframe
Fundamental Context:
Institutional Inflows & ETF Dynamics:
Since July 2024’s launch of spot Ether ETFs, inflows have been strong with a 15-day streak totaling approximately $837 million (~25% of total net inflows).
Recently, the SEC approved options trading on spot ETH ETFs (e.g., BlackRock, Grayscale), deepening liquidity and offering hedging mechanisms.
BlackRock is now pushing to add staking functionality allowing yield generation within an ETF wrapper. If approved, this could markedly increase demand.
Staking Growth & On-Chain Supply Dynamics:
27% of ETH is already staked, and ETF inflows could lift that by >10%.
A staking ETF would institutionalize ETH staking: more capital locked, less circulating supply → supply constraints could support dominance and valuation.
Ethereum Backbone in DeFi & RWA:
Ethereum still leads the Real-World Asset (RWA) space: over 50% market share and ~$5–6 billion in assets tokenized on-chain.
Its core infrastructure underlies the majority of DeFi, smart contracts, and stablecoins, reinforcing ETH.D’s structural resilience.
Network Upgrades & Tech Progress:
The Pectra upgrade (mid-2025) is on the horizon, introducing EIP-7251/7702, improving validator flexibility and network usability.
Combined with recent Dencun improvements, Ethereum is becoming cheaper and more efficient, boosting adoption in L2 ecosystems.
Price action & on-chain indicators:
ETH price has surged ~46% in the past 30 days, driven by ETF demand; some analyst forecasts target $3,000–5,000 year-end.
The withdrawal of ~$1.2 billion ETH from exchanges suggests increasing long-term holdings and less selling pressure.
Integrating with Your Technical Setup:
Level: 78.6%–61.8% bounce zones (6–11%)
Fundamental Support: Institutional re-entry via ETFs often begins with accumulation near support.
Level: TP1 at 23.6% (23.5%)
Fundamental Support: Could coincide with ETF inflows + early vesting of staking narratives.
Level: TP2 (~30.8%)
Fundamental Support: Full retrace driven by mass ETF adoption, options trading, and upgrade momentum.
Level: TP3 >39% (–27% ext.)
Fundamental Support: If staking ETF and yield-bearing structures go live, ETH.D could reach new dominance highs.
Summary of Fundamental Catalysts:
Spot ETH ETF inflows (~$800 M), with options exposure adding liquidity.
Upcoming staking ETF (BlackRock, Grayscale) with >10% locked-up supply implications.
Ethereum remains the DeFi and RWA backbone, sustaining structural demand.
Protocol upgrades (Pectra, Dencun) enhance scalability and adoption.
On-chain withdrawal trends show growing holder conviction.
Narrative / Bias & Strategy Implication:
ETH.D has likely completed its correction and is primed for a staged bullish reversal, mirroring prior cycles. The chart forecasts a rally toward TP1, where some short-term profit-taking and rotation to alts may occur (Alts season). Following that, a retrace may set up the next impulsive move to reclaim lost dominance and eventually challenge prior highs.
Time Horizon: Mid-2025 to late 2026

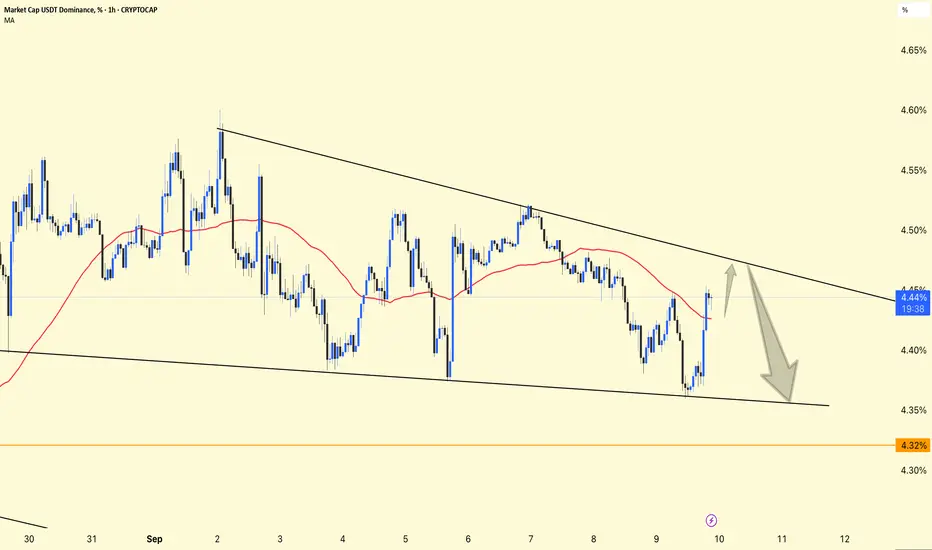
USDT.D 1H Analysis !!USDT.D 1H Analysis
Price is consolidating inside a descending triangle (lower highs + flat bottom).
Currently sitting around 4.44%.
50MA (red) is acting as dynamic resistance, keeping pressure on dominance.
Support Zone
Key support lies near 4.35% (triangle bottom).
A breakdown below this zone could send dominance lower toward 4.32% (orange line).
Resistance
The upper trendline around 4.48%–4.50% is the first big resistance.
Break above → short-term relief rally in dominance.
📈 Outlook
Bullish case: If USDT.D breaks above 4.48%, dominance may rise toward 4.55%–4.60%, usually bearish for crypto prices.
Bearish case: If it rejects and breaks below 4.35%, we can see a move toward 4.32%, which would support bullish momentum in BTC/altcoins.
👉 In simple terms:
Watch 4.48% (resistance) and 4.35% (support).
A breakout = bearish for crypto.
A breakdown = bullish for crypto.
$ETHBTC rolling over. $ETH.D in uptrend. $SOL.D looks bullishWhat is happening in the Altcoin universe ? Is Altcoin season in? CRYPTOCAP:ETH and CRYPTOCAP:SOL are the best indicators of the overall sentiment in the Crypto market. Altcoin season usually starts when BINANCE:ETHBTC and CRYPTOCAP:ETH.D both bottoms out. That happened in April. Since then, BINANCE:ETHBTC and CRYPTOCAP:ETH.D have been in an uptrend. Our cycle target for CRYPTOCAP:ETH.D remains 17%.
CRYPTOCAP:BTC.D : Cycle tops are in. CRYPTOCAP:ETH.D : Bounce form the all-time lows for CRYPTOCAP:BTC.D by RabishankarBiswal — TradingView
But there is another phenomenon which can indicate the rotation to lower cap Crypto. The BINANCE:ETHBTC is rolling over in the last couple of weeks and CRYPTOCAP:SOL.D is attempting a breakout. CRYPTOCAP:SOL.D did reach the cycle peak of 3.9% and since then it has rolled over and currently 2.92%. If CRYPTOCAP:SOL must prove its serious Mega cap in the Altcoin space, then it must at least reclaim the previous highs.
Verdict: Altcoin season is on. CRYPTOCAP:ETH and CRYPTOCAP:SOL looks promising now. CRYPTOCAP:ETH.D should reclaim 17% and CRYPTOCAP:SOL.D should reach 4%.

USDT Dominance Weekly Chart Update!!USDT Dominance Weekly Chart Update
USDT dominance continues to decline and is hitting lower highs. This indicates that capital is slowly shifting from stablecoins (USDT) to crypto assets (BTC, ETH, and altcoins).
Support Zone: The main support is between 3.5% - 2.5%. If dominance falls into this zone, it could trigger a strong bullish move in altcoins and BTC.
Perspective: A decline of 2-2.5% would signal the start of a big altcoin season.
⚡ Current Status (4.49%): The market is moving in an uptrend. If dominance continues to decline, expect strong inflows into crypto.
DYOR | NFA
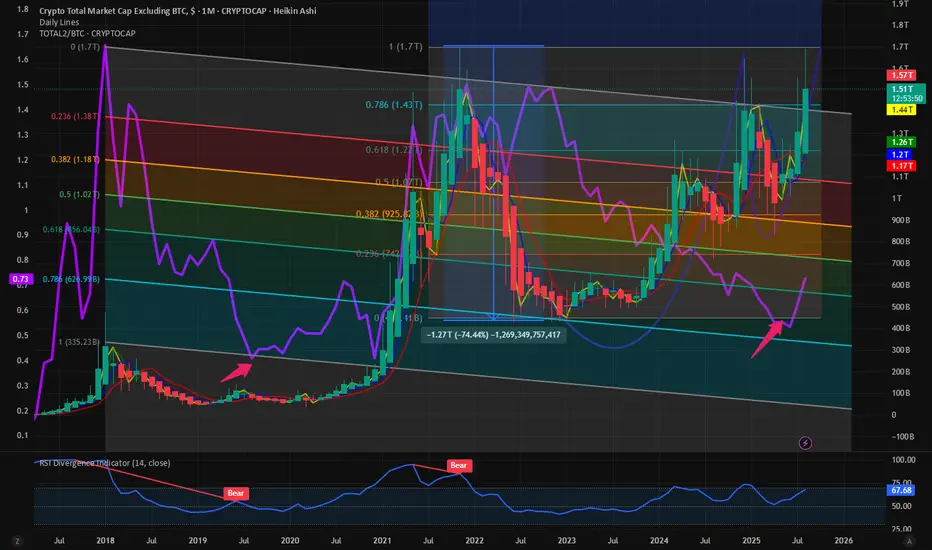
$TOTAL2 vs BTC shows momentum with $TOTAL2 nearing ATHWhere is the Alt season? CRYPTOCAP:TOTAL2 is the best indicator of the Altcoin rally which does not include CRYPTOCAP:BTC and Stablecoins. CRYPTOCAP:TOTAL2 peaked at 1.7 T $ in the last cycle. In this cycle we are very close to our target. But this outperformance can only happen if CRYPTOCAP:ETH breaks out above its previous cycle highs. Please visit my view on CRYPTOCAP:ETH and CRYPTOCAP:ETH.D in this blog.
CRYPTOCAP:BTC.D : Cycle tops are in. CRYPTOCAP:ETH.D : Bounce form the all-time lows for CRYPTOCAP:BTC.D by RabishankarBiswal — TradingView
Our target is 9K on $ETH. So if this happens then the CRYPTOCAP:TOTAL2 will break out of the Cup and handle formation we have been tracking since months on $TOTAL2. As the CRYPTOCAP:TOTAL2 is trying to break out of its ATH the ratio of CRYPTOCAP:TOTAL2 vs CRYPTOCAP:BTC is also making a reversal towards the upside. In the chart below I tried an unorthodox method to plot the Fib retracement levels of a downward slopping pattern joining the top of the lower lows in the ratio charts. Here we can clearly see that in this cycle it bottomed out at somewhere near to 0.786 level. Just extrapolating and following the pattern of lower lows and lower levels on the Fib retracement level I can predict to a certain degree of confidence that the ratio of CRYPTOCAP:TOTAL2 vs BTC can top out at 1.1 during this cycle. And the CRYPTOCAP:TOTAL2 might top out @ 2.6 T – 2.7 T $ which indicates a 60% rally to the next Fib retracement level on $TOTAL2.
Verdict : CRYPTOCAP:TOTAL2 vs BTC chart is on rally mode. CRYPTOCAP:TOTAL2 target remains 2.7 T $ and CRYPTOCAP:TOTAL2 vs BTC ratio target 1.1.
Altseason Checklist! To spot the beginning of an Altseason, there are several key charts you need to track on TradingView. These indicators show whether capital is really leaving Bitcoin and flowing into altcoins.
1. Altseason Starts with ETH
Almost every time, the first signs come from Ethereum (ETH). When ETH gains strength, the rest of the altcoins usually follow.
2. BTC Dominance (BTC.D) ⬇️
Condition: forming Lower Low / Lower High
Interpretation: money is rotating out of BTC and looking for better opportunities in altcoins.
3. ETH Dominance (ETH.D) ⬆️
ETH’s share of the market is increasing.
This shows Ethereum is taking leadership over the flow of capital.
4. ETH/BTC Pair (ETHBTC) ⬆️
Key: breakout to the upside with weekly confirmation
This ratio reveals whether ETH is truly outperforming BTC.
When ETHBTC breaks up ⇒ strong trigger for ETH leadership.
5. TOTAL2ES ⬆️
Represents market cap of all altcoins excluding BTC.
Growth here means real money is flowing into alts, not just cycling into stables.
6. TOTAL3ES ⬆️ (with delay)
Represents market cap of all altcoins excluding BTC and ETH.
When this chart starts rising ⇒ after ETH, the rest of the alts join in.
This is usually the final confirmation of Altseason.
7. USDT Dominance (USDT.D) ⬇️ or ↔️
Should move down or at least stay flat.
If it rises too much ⇒ capital is not entering alts, it’s parking in stablecoins ⇒ Altseason trap.
⚠️ Key Note – Watch Out for the Trap
The biggest trap is when BTC.D is dropping and ETH.D is rising, but USDT.D is also climbing.
That doesn’t mean Altseason – it means money is leaving BTC but hiding in stablecoins instead of flowing into alts.
📌 Summary:
Starts with ETH
Confirm with BTC.D ⬇️, ETH.D ⬆️, ETHBTC ⬆️
Money entering alts ⇒ TOTAL2ES ⬆️
Expansion to full alt market ⇒ TOTAL3ES ⬆️
Watch USDT.D to avoid the trap.
ETH.D : 5-Wave Bull Run Over –Bitcoin to Outshine EthereumeEthereum Dominance (ETH.D) has completed a textbook 5-wave impulsive rally on the weekly timeframe, signaling the end of its upward cycle and entry into a deep corrective phase. As of August , ETH.D at 13.37% is rejecting the key order block at ~14%, hinting at weakening momentum. This shift favors Bitcoin's outperformance, as capital rotates from ETH to BTC, potentially boosting BTC/ETH ratio and Bitcoin returns during the downturn.
NeoWave Wave Count (Daily Chart):
The rally from ~10.5% lows unfolded in 5 waves: Wave 1 to ~11.41%, Wave 2 correction to ~10.11%, Wave 3 extended to ~13.97% (161.8% of Wave 1), Wave 4 shallow to ~13.32%, and Wave 5 topping at 13.97% with the 1.618 Fib extension (1.141%).
Monowave count (~55-70 subwaves) validates the impulse, with alternation (Wave 2 deep/time-extended, Wave 4 shallow/short). The ascending channel (yellow) has been touched multiple times, and the recent rejection confirms exhaustion.
Weekly Chart Insight:
On the weekly TF, ETH.D has hit a major order block at ~14% (1.425%), not the channel top, coinciding with the 1.618 Fib extension from 2023 lows and historical resistance from 2018 highs (~52%). This multi-year descending channel holds firm, with price failing to break the OB—suggesting reversal to midline ~12.5% or lower (38.2%-50% Fib retrace of rally).
Why Bitcoin Outperforms From Here:
As ETH.D corrects (likely a Zigzag or Flat, targeting 11%-12%), Bitcoin gains dominance, driving better returns for BTC holders. Expect BTC/ETH ratio to climb (current ~12.5, target 14-15), with Bitcoin yielding 10-20% superior performance in risk-off environments. If ETH.D drops below 12.5%, correction accelerates to 10% (78.6% Fib), amplifying BTC's edge.
Trade Idea (Bearish ETH.D / Bullish BTC):
Entry: Short ETH.D (or long BTC/ETH pair) below 13.32% on BOS confirmation in weekly.
Targets: TP1 at 12.5% (channel midline), TP2 at 11% (50% Fib).
Stop Loss: Above 14.25% (OB high, R:R ~1:3).
Sizing: 1-2% capital; trail stops on midline breaks. Watch dominance flips—crypto rotations can spark quick BTC pumps.
ETH bulls, pivot to BTC now! #ETHDominance #NeoWave #BitcoinOutperformance #CryptoAnalysis

This Ethereum SeasonThis Ethereum Season
Ethereum Dominance / Bitcoin Dominance
CRYPTOCAP:ETH.D / CRYPTOCAP:BTC.D

ETH Dominance Eyes 12.60%ETH.D on the Daily
Next resistance is approaching near the 0.236 Fib level, around 12.60%.
In my view, this level will eventually flip to support — but it may take time. Price could need a retest, or wait for the 50MA (maybe even the 200MA) to assist the breakout.
Either way, we’ll be here to watch it unfold.
Always take profits and manage risk.
Interaction is welcome.

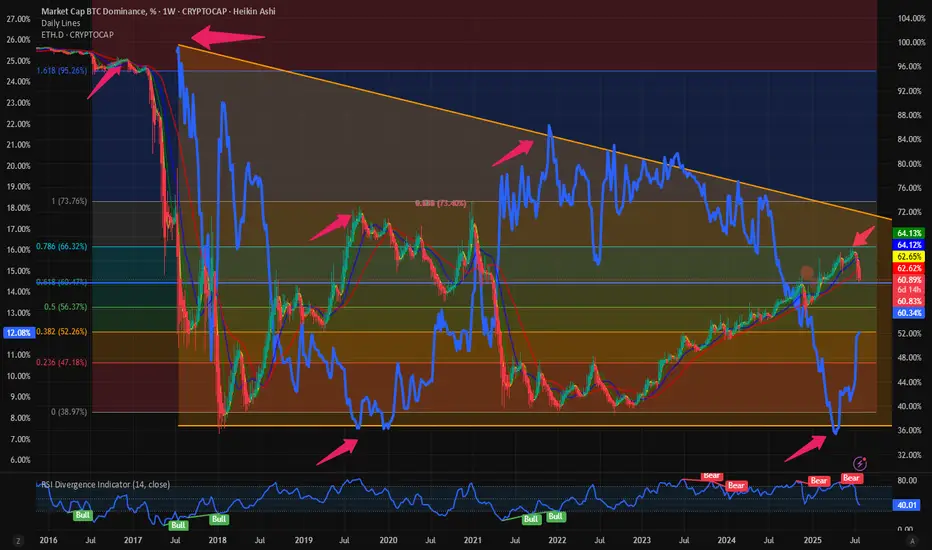
$BTC.D: Cycle tops are in. $ETH.D: Bounce form the all-time lowsIn my opinion the most important chart in all Crypto is the $BTC.D. We have been writing and observing CRYPTOCAP:BTC.D for almost 6 months. I predicted here that we will see CRYPTOCAP:BTC dominance @ 66% before the end of this cycle. And we saw CRYPTOCAP:BTC.D touch 65.9% on June 23 as visible from the weekly chart, which is close to our cycle target of 66%. See my blog from April 14.
CRYPTOCAP:BTC.D to 66%, CRYPTOCAP:TOTAL2 / BTC down to 0.43 for CRYPTOCAP:BTC.D by RabishankarBiswal — TradingView
But since then, CRYPTOCAP:BTC.D is going through reversal. Currently @ 61% the dominance has tumbled in July. Even if CRYPTOCAP:BTC is holding on to its ATH with price near to 118K $ the dominance is clearly in a downtrend.
But then we see something which CRYPTOCAP:ETH.D has not done since 2019. In the chart below we have super imposed the CRYPTOCAP:ETH dominance on the CRYPTOCAP:BTC Dominance. CRYPTOCAP:ETH Dominance as the name suggests is the % of Crypto Market Cap that can be attributed to $ETH. The CRYPTOCAP:ETH.D double bottomed in 2019 @ 8% and then went on for a reversal with CRYPTOCAP:ETH.D peaking @ 22% on Nov 21. Both the Dominance charts have an inverse correlation but have one thing in common. The trend in the Dominance charts is lower. In each cycle the CRYPTOCAP:BTC.D makes a lower low peaking at 95% in 2017 cycle, 73.5% in last cycle and 66% in this cycle. The same is true for CRYPTOCAP:ETH.D , starting @ 26% in 2017, 21.5% in the last cycle. So, the obvious question in your mind is where will the CRYPTOCAP:ETH.D peak this cycle. If we draw the downward slopping wedge in the CRYPTOCAP:ETH.D and assume the cycle end by Dec 2025, then we can see the CRYPTOCAP:ETH.D will peak around 17% in this cycle. Currently at 12%, I am predicting another 40% upside form here. Pricewise BITSTAMP:ETHUSD may give a higher return than the $ETH.D.
Verdict: CRYPTOCAP:BTC.D top for this cycle is 66%. CRYPTOCAP:ETH.D can top @ 17% this cycle. BITSTAMP:ETHUSD can double from here for CRYPTOCAP:ETH.D to top @ 17%.
ETH Dominance – Golden Cross, New Era?This is ETH Dominance on the Daily chart.
A golden cross just printed, and the last time we saw this, at similar levels, was February 2020. Back then, dominance climbed steadily, bouncing off the 200MA repeatedly.
Today, price is approaching the 0.236 Fib level, which could act as short-term resistance and send us back to retest the 200MA as support.
But unlike 2020, everything has changed:
– ETH is getting institutional support via ETF flows
– The SEC confirmed ETH is not a security
– The RWA narrative is gaining serious traction
That’s why this golden cross could mean more than just a signal, it may be the start of a much stronger structural uptrend.
My humble guess?
ETH Dominance continues climbing with the 200MA as support.
It won’t be a smooth ride, but the direction might be set.
Always take profits and manage risk.
Interaction is welcome.

Ethereum season is here for a yearWho's leading the crypto market right now?
- Coinbase, Base, and Farcaster
Let me ask you a question. Will base launch its own token? No.
USDC on Base is their main token, and they are happy with it.
What people don't see yet is, base is base.eth.
Also, ETH hit its all time low dominance, and bouncing back up.
Ethereum foundation laid off many people, and going through hard reform.
I think Ethereum market dominance will hit 14% within a year.
That would be about 1ETH = $10,000.
Let's come back in a year.

USDT dominance chart!The chart shows USDT.D (Tether dominance) moving within a descending channel.
Currently, USDT.D is testing the upper resistance of the channel, around 4.65%.
If the dominance gets rejected at this level, the next potential target is the lower channel support around 3.9-4.0%.
This could indicate a risk-off environment where traders move capital from stablecoins (USDT) to more volatile assets like Bitcoin or altcoins.
The 50 and 200 moving averages provide dynamic resistance levels that support this potential downside move.
Thanks for your support!
DYOR. NFA

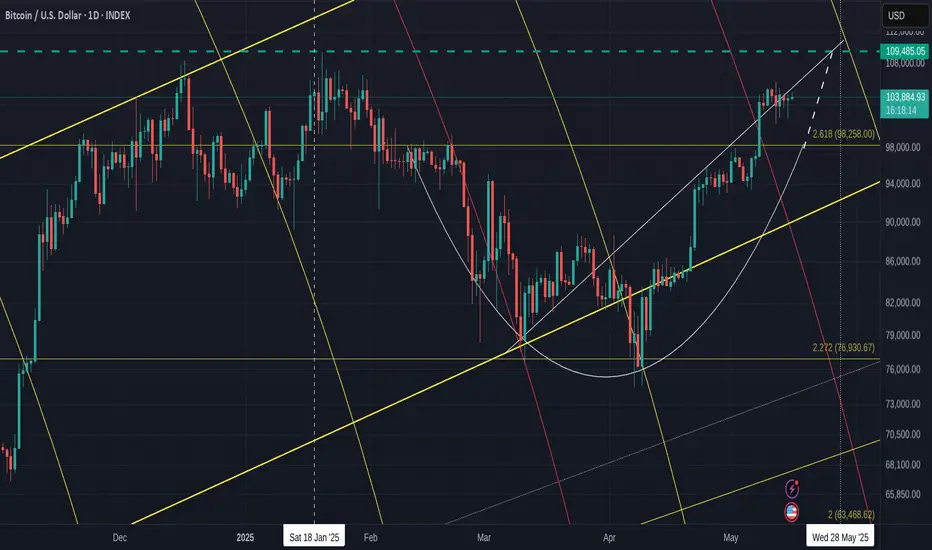
Comprehensive BITCOIN Analysis for the next 7 days - DAILY chart
First Off - Sorry for all the lines on the chart but EVERY one is very relevant to what is happening right now.
The Dashed Blue Horizontal line is the current ATH line. possible Resistance.
The 2.618 Fib extension has not yet been tested as support. This could happen still, at any point till end of month and is around the 98K usd zone.
PA has Ranged through the Local rising line of support, as if it no longer existed, which was a little surprising given the strength that PA has still. There maybe some uncertainty in the air.
PA is above the neckline of the Cup pattern it printed and, again, it would not be unusual to see PA come back down to test this Neckline as support, which is on that 2.618 Fib extension.
The Bold Yellow line is Long Term Support line since 2015, showing that Bitcoin PA is in the Lower side of a Long Term ascending channel, with plenty of room to rise,
PA has a lot of inert strength right now, so, we may not see this retest happen.
We just have to wait.
BUT you can see that Rising dashed line, the extension of the Cup pattern.
PA may range across into this and bump into it next week. If it acts as support again, PA will then be pushed into a tight Squeeze against the other rising line of support, with an Apex on the current ATH line.
PA ALWAYS REACTS BEFORE THE APEX
All that points towards some Volatile times next week if PA remains in this area.
The other descending line there is a 618 Fib Circle. You can see that 98% of the Time, PA is effected by these.
All this shows us 4 points of resistance, in the same Zone, All Next week and PA will Either Shoot through it with a Big push, Or we may see PA Drop back down. The Big question being, how Far ?
We do not want to loose the 2.618 Fib ext at 98K
But what else can we look at. ?
The RSI DAILY
This is still up high in the near Over Bought zone. It can range up here for extended periods but this is something we should be aware of as the possibility of a drop does exist.
On the weekly, RSI has room to move higher & the 4 hour is in neutral zone, again with ability to push higher.
The MACD DAILY
This is once again curling over and about to test the red signal line as support.
On a 4 hour chart, the MACD is down on Neutral line, giving it strength to push higher and if that continues, we will see the yellow MACD line bounce off the Red signal line on the Daily chart.
Once again, Look at the Histogram and the similarity to the area that the Arrow is pointing at.
We could repeat this but on a larger scale. We have to wait and see if this happens.
But also note how there was a Visit into a red Histogram ( for 4 days ) before the bigger push and I remind you about what has been said above.
So, what else can we look at that may offer some ideas ?
The Chart below is the 4 main Crypto Dominance charts by market Cap - 4 hour
BTC.D - ETH.D
OTHERS.D - USDT.D
( OTHERS = Top 125 Coins MINUS Top 10 by Market Cap) Mid to Low cap
We have recently seen a Drop in Bitcoin dominance, giving the ALTS some time to push higher. This is seen with the BTC.D dropping and the ETH.D and OTHERS.D rising
Also note how USDT.D Dropped, showing that stable coins were being exchanged for Crypto,
And as we see now, we have the possibility of BTC.D being rejected by its 50 SMA ( Red)
ETH.D is above its 50 SMA, showing it had a good push and may get support if PA drops
OTHERS.D has already fallen below its 50 SMA, showing a brutal sell off, rapid profit taking.
That is the world of ALTS.
In the last 48 hours, we saw a return for Bitcoin as it rose from a shallow Low in its Range. This was enough to cause a sell off of the ALT coins as we see in the Drop in Others.D
ETH however, remains in a range with obvious intention to continue higher if the market allows.
Lastly, we can compare Bitcoin to the other Markets
Bitcoin - CFD GOLD
DXY - S&P500
Bitcoin has performed well. It has reclaimed some position on Gold recently while it climbed alongside the S&P
We can also see how BTC climbed while DXY dropped.
This highlights some Flaws in using the BTC USD pair to judge the success of BTC but this is explaned better in another post. But in short, If the $ looses Value and your BTC USD pair appears to climb, theg ain is lost as the $ is worth less.
Use BTC XAUT pairs. Bitcoin Gold Pair - Historically, GOLD looses little Value by comparison. So when Bitcoin gains against Gold..It is WIN WIN
So, in conclusion, we see Bitcoin under some pressure to avoid Lower or sharper Drop in the short tern.
The Lower Timeframes show us that BTC has the ability for a Continued Range but with caution.
We see ETH ( and larger Alts ) intent on remain in the game now they have had a small glimpse of Gains
And we see that Mid and Lower Cap Alts are mostly just money makers providing you play the game right. And that game may have some more time if Bitcoin Stumbles in the next 7 days.
And that possibility does exist.
Today is crucial in many ways and will set the tone for the following week.
There is Financial Data being released by the USA today and if unfavourable, we may see some sharp moves.
And ,Longer Term VERY BULLISH - I HOLD AND CONTINUE TO BUY WHEN I CAN ON SPOT ORDERS
I hope this helps and I am grateful for comments
4 X Crypto Dominance charts showing Where the money goingCRYPTO MARKET DOMINANCE CHARTS
These are 4 hour charts, showing PA from Mid April to now.
BTC.D - ETH.D
OTHERS.D - USDT.D
RED line = 50 SMA
BTC.D - Dips, Showing money flow into other Assets. PA has fallen below the 50 SMA and yet the price has remained static above 100K. The fact that the Dominance chart is dropping is more a sign of the increase in Selling, Profit taking and the increase in Dominance of other Assets and the fact that the price is unchanged, slightly higher, also shows the demand for BTC remains strong.
ETH.D - Climb showing some ETH recovery though no where near the climb that Bitcoin has made. The ETH Dominace can also be reflecting the increased Dominance of ALTS on the ETH network. In the last 24 hours, The ETH dominance has Fallen slightly
OTHERS.D - Rapid climb - Top 125 coins minus the Top 10 ny market dominance.
MID to LOW Cap ALTS taking most of the Money. This will include all ALTS on any Vlockchain, including the TH network. Some Massive gains here signaling ALT Season though I am uncertain how long this will ast.
BE CAUTIOUS
USDT.D Drops showing money leaving Stable coins and moving to Assets. When stable coins get sold off, it is a sign of confidence in the market, Foe me, MOST of the money flowing into ALTS right now are coming from the Stable coin sell off
As I mentioned just now, I remain cautious about this right now,
Watch that BTC.D like a Hawk because THAT is the signal of change in this.
The Table below explains ( sorry for the formatting )
BTC.D- BTC - ALTS
increase- increase- Decrease
increase- Decrease- Decrease Rapid
increase- Stable- Stable
Decrease- Increase- Increase Rapid
Decrease -Decrease- Decrease / Stable
Decrease -Stable- Increase

The 4 Crypto Dominance charts and 4 x TOTAL charts -ALT ?
There are some charts we should always refer to in times where we feel change may be upon us.
The chart above are
Bitcoin Dominance ( BTC.D ) - Ethereum Dominance ( ETH.D )
Others Dominace ( OTHERS.D) and USDT Dominance ( USDT.D) ( I use USDT as it remains the largest Stablecoin by market cap)
The RED line in these Daily charts is the 50 day SMA
In most of my posts recently, I have been mentioning how Strong BITCOIN is remaining while under a Lot of resistance.
But we really should not forget the rest of the market. THE ALTS
The Fabled ALT Season has been running away from us, making many wonder just what is happening.
To explain, while BTC.D remains high, it shows us that the Money remain invested in Bitcoin.
When this Dominance Drops, in the past, it has signalled the rise of investment into ALTS.
Called ROTATION, the money rotates from one asset to another.
Due to the corporate investment in Bitcoin, this rotation has not happened.
BUT IS IT ABOUT TO ?
Let look at a few things
BTC.D has been rising continuously for Months now, It is way above that 50 day SMA. PA could fall a Long way before the support of that 50 SMA is required and I notice as I type, that is is beginning to drop. It's local support may help
ETH.D has begun to Rise but we need to pay attention to this as it could get rejected once again by the 50 SMA. Ethereum has had a very hard time this cycle and has yet to show any sustained recovery
OTHERS.D - Now OTHERS is the one I watch most. Others is the Top 125 Coins MINUS the Top 10 by market cap. This shows us the Mid to Low cap Alts coins.
This is also rising right now but once again, we need to wait and see if it breaks through the 50 SMA that has rejected it many times.
The USDT.D has been dropping. This shows that USDT has been rotated into other assets. Bullish but I have to say, that as I write this, I have just noticed that this has begun to rise also though only on a 1 hour chart so maybe just Noise but it is worth watching.
So, on these dominance charts, we see a potential start to a rotation but with the likely hood of rejection of the 50 SMA, It could be the First step of a bigger move.....But with potholes in front.
The Next Logical thing to do is to look at the TOTAL market Cap charts, to compare this dominance.
This chart shows us the Daily charts for
TOTAL Crypto market Cap - TOTAL2 ( minus BTC )
TOTAL3 ( Minus BTC & ETH ) - OTHERS ( Top 125 coins Minus top 10 by Dominace )
SMA;s in chart are RED= 50, BLUE = 100, GREEN = 128, YELLOW = 200
The TOTAL is the ONLY one that has PA above all the SMA's, potentially offering Support on many fronts. It has also had the most sustained Rise. Hence the high level of Dominance in the Market.
TOTAL2 is above the 50 SMA that has rejected it previously and is about to hit into the 100. We need to see if this will be rejected or not.
Remember how the ETH.D is also facing rejection off the 50SMA - ETH is under pressure
TOTAL3 is above the 50 and appears to have broken through the 100. This is VERY Bullish for the ALT coins and could show us some potential for a continued rise as sentiment continues to turn positive. But we should watch that 200 as a potential problem
OTHERS has the largest and strongest rise and again, is above the 50 and appears to have broken through the 100. This chart has the largest gap between current PA level and the next SMA that may reject it. This is the same on the Others.D chart
SO, in conclusion, The potential for a Rotation does exist but it is going to be hard fought. There is the possibility of a HIGH volitle state for the next few days, possibly Weeks.
If you are going to rotate out of Bitcoin, Be VERY CAUTIOUS until at least the next SMA have been claimed on both sets of charts.
The nest bets are on the Mid to lower Cap ALT coins.
BUT I will say this. I cannot See BITCOIN Selling off to invest in ALTS. I also see Bitcoin continuing higher against the USD.
IF we get an ALT season now, It will be Quick, Volatile and possibly with Quick Pump and Dumps on most ALTS.
The larger ALTS will survive this better than the Meme, small caps in my opinion
For me, the ROTATION that creates an ALT Season will occur with the rotation of money from ALT to ALT and NOT BTC to ALT
What ever you do, Remain in Peace and Safety

Super bullish ETH now. ETH.D, ETHBTC, ETHUSD all bottom signalsMy forecast for ETH Dominance. I believe it will come back with vengeance relative to BTC. CRYPTOCAP:ETH.D BINANCE:ETHBTC BINANCE:ETHUSD COINBASE:ETHUSD BITSTAMP:BTCUSD

USDT.DOMINANCE 4HOUR CHART UPDATE !!A downward trend in USDT dominance typically signals growing confidence in riskier assets (such as Bitcoin and altcoins), as traders move funds out of stablecoins and into crypto investments.
Breakout Attempt
The latest price action shows a breakout from the descending channel.
This signals a potential reversal, during which traders may return funds to USDT due to market uncertainty or a correction in crypto prices.
The black line forecasts a strong upward move in USDT dominance.
If this happens, it could indicate that investors are selling crypto holdings and moving funds into stablecoins in anticipation of a market decline.
If you found this analysis helpful, hit the Like button and share your thoughts or questions in the comments below. Your feedback matters!
Thanks for your support!
DYOR. NFA

USDT.DOMINANCE WEEKLY CHART UPDATE. Current Market Structure:
Breakout Confirmation: USDT Dominance has broken out of its descending trendline and is now in a retest phase.
50MA as Support: The 50-week moving average now acts as dynamic support, reinforcing the bullish outlook.
Rejection or Breakout? The price is currently testing resistance. If it gets rejected, a temporary pullback is likely before further gains.
If you found this analysis helpful, hit the Like button and share your thoughts or questions in the comments below. Your feedback matters!
Thanks for your support!
DYOR. NFA

Real Actual Alt Season Tracker!In Crypto Autumn (post halving years), look at how BTC/TOTAL2 collapses and OTHERS/BTC soars into Quarter 2 & 4! Will this year be different?
