Will ETH push to $1800 with the current level of RSI?I wanted to share some Ethereum (ETH) trading updates with you. While ETH moved slightly higher, it is still trading below $1,800. In today's session, the price of ETH/USD reached a high of $1,757.89, an improvement from yesterday's low of $1,723.09. The recent surge in price was due to bullish activity at a floor of $1,730, with the RSI bouncing from a floor of its own at 38.00.
Per the daily chart, the current price strength is tracking at 39.33, with the next visible point of resistance being 43.00. If the index moves beyond this ceiling, there is a strong possibility that ETH will climb to $1,800.
I hope this information is helpful to you. If you have any questions or concerns, please do not hesitate to comment in this idea.
Ether
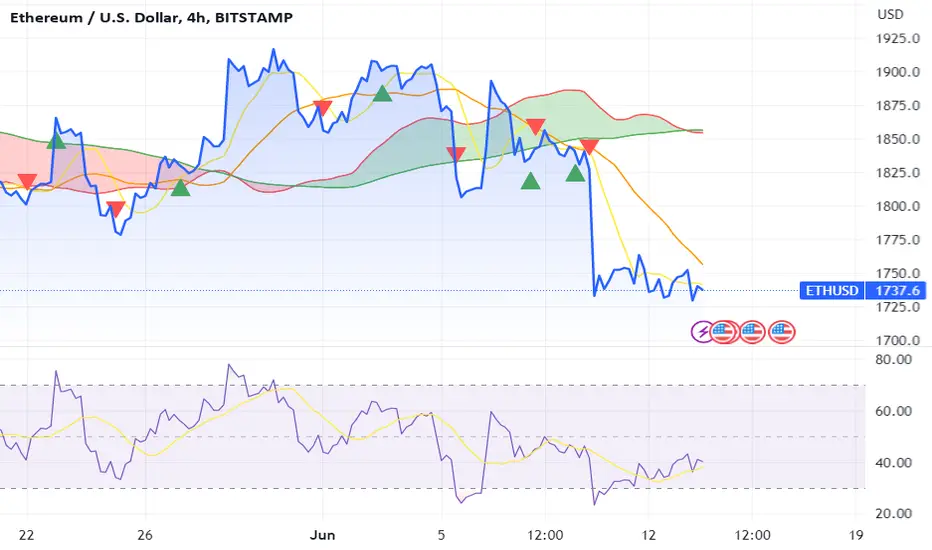
ETH volatility could start to spike but RSI is lowI am bringing to your attention the current state of Ethereum's price trend. As of now, Ethereum has been experiencing a notable downward trend in price when observed on a daily timeframe chart. It is currently trading at approximately $1,740, which reflects a decline of over 5%.
It’s becoming increasingly evident that Ethereum is experiencing a bearish trend in the market, as indicated by its RSI dropping below 40. To add fuel to the fire, the current volatility level of Ethereum is at a measly 0.01%. If you're a Bitcoin trader, it's time to pay attention and make informed decisions accordingly. Check out Furthermore for more insights.
Additionally, the Bollinger Band analysis indicates that ETH is currently experiencing a certain level of volatility. However, the band's elasticity suggests that the current volatility is relatively minimal.
I hope this information is helpful to you. Please let me know if you have any questions or concerns in the comments.

ETH Head & Shoulders!KUCOIN:ETHUSDT
ETH has had an impressive run to 2140.
Pullback sits currently at 1874 and in a Head & Shoulders.
Break of Neckline will possibly provide short ideas with target ideas to 1690, 1520, 1370 zones.
If the Neckline does not break and volume sets in go long - for targets see my 18-Apr ETHUSDT post
with this chart: www.tradingview.com
Always having Plan A and Plan B scenarios so we can react once the markets provide an opportunity to execute our edge.
If you liked this idea or if you have your own opinion about it, write in the comments.
The information and publications are not meant to be, and do not constitute, financial, investment, trading, or other types of advice or recommendations.

ETH Ethereum Head and Shoulders Bearish Chart PatternIf you haven`t sold Ethereum here:
Then you should know that Ethereum, currently trading at $1841, has formed a head and shoulders pattern, indicating a potential bearish trend. This pattern consists of three peaks, with the middle peak forming the head and the other two forming the shoulders. The neckline, a key support level, must be closely watched as a break below it may trigger a further price decline.
While the target for the head and shoulders pattern suggests a larger drop, attention should also be given to the 200-day moving average support at $1620. This level has historically served as a significant support zone. Traders and investors should monitor Ethereum's price movement closely to gauge whether it reaches this support level.
In summary, the emergence of a head and shoulders pattern in Ethereum signals a bearish sentiment. Traders and investors should exercise caution, closely track the neckline support, and keep an eye on the 200-day moving average as a potential support level.
Looking forward to read your opinion about it.

ETHUSD - Top Cap IndicatorUsing the Top Cap indicator to plot the next bullrun
each bullrun the top cap is touched or nearly touched
I think the previous bull run was just a taste of what we are yet to see on ETHUSD
Bars patterns show my thoughts
Daily Chart

SOLANA LongSOLUSDT Downtrend resistance was successfully broken. Now bulls have power to reach $24.50 level...

Ethereum ETH and the US Debt CeilingNegotiators from Democratic and Republican parties finalized an agreement on Sunday night.
Instead of raising the limit to a specific level, they have opted to suspend it entirely until 2025. This strategic move ensures that their bills can be paid until that date, while also guaranteeing that the next battle to raise the ceiling will not coincide with the upcoming presidential election.
The resolution of the debt ceiling issue brings optimism and stability to the financial landscape, which has a positive ripple effect on the cryptocurrency market.
Bitcoin and the broader crypto market stand to benefit from increased investor confidence, reinforced safe-haven status, enhanced institutional adoption, regulatory clarity, and the overall positive impact on global markets.
ETH/USDT
Entry Range: $1800 - 1900
Take Profit 1: $1950
Take Profit 2: $2010
Take Profit 3: $2100
Stop Loss: $1730

ETHUSD - One More Move UpI think we will experience one more move up comparable to that of DEC 18 where price bottomed and we experienced a short move up.
We are in the last stages of this short move up.
RSI analysis.

ETH/USD 4H Price TargetsLooking at the 4-hour time frame of Ethereum, we see see flat price action for the past month. The price has been floating over this 1645 level that hasnt been retested, but neither has $1284 on that March low.
Just like the banking contagion in May, i’m expecting some upside because the crypto markets really liked the banks failing. There’s the downside potential of ETH retesting 1,645, which would break the current market structure, but if we hold this current level around 1,820, i’m expecting another retest of 1,995, the EQ of this range and a psychological level for Ethereum.
This downwards move I believe was the weekly / monthly low being created, and i’m looking now for upside to 1,995 and 2,120. These two targets would complete and reach the top of the range, then we look for our expansion candle outwards to 2,407.
As always please do your own research, this is not financial advice.

ETHUSD - Hourly Falling WedgeA falling wedge pattern which are considered a bullish pattern once completed.
This bullishness we might see once ETH stops hovering around these 1700 - 1800 levels.
Im still bullish on ETHUSD right now.

Crypto Summer: Ether to $2200? Clean retracement to .78 on the fibs and we're holding strong. I think that we should go retest the highs and break $2150 over the next few weeks.

Ethereum minimum growth of ➕10%!!!🚀Ethereum seems to have created a 🐻bear trap🐻 (but the 100-SMA held Ethereum well).
According to Elliott Wave theory, Ethereum is completing a c orrective structure .
Ethereum correction structure can be Expanding Flat(ABC/3-3-5) or even Double Three Correction(WXY) .
I expect Ethereum to go up to 🟡 PRZs(Price Reversal Zones) 🟡 after breaking the downtrend line .
Ethereum Analyze ( ETHUSDT ), 4-hour time frame ⏰.
Do not forget to put Stop loss for your positions (For every position you want to open).
Please follow your strategy, this is just my Idea, and I will be glad to see your ideas in this post.
Please do not forget the ✅' like '✅ button 🙏😊 & Share it with your friends; thanks, and Trade safe.

ETHUSD - Could It Double Top?Would the previous peak lead to a double top with the current peak?
Bars pattern just shows my thoughts if price did double top and price moved down

ETHUSD - Gaussian Channel Favouring BullsThe Gaussian channel is turning green!
Price is moving up slowly but for now it has perched itself above the middle line which is a really good support.
ETH may continue to move up as the channel continues to turn.

ETHUSD - Precarious Monthly Gaussian ChannelETHUSD on this Monthly timeframe shows higher lows sitting just above the top of the channel.
If we are able to recover and hodl this Monthly upper line the bulls are still on for the long term.
Higher lows present.

ETHUSD - Sharp RiseA sharp rise following a curved trend
I think BTC is going to 700K so naturally ETH will follow
Attaching some relevant ETH charts

ETHUSD - Third Test of Middle Channel LineThe middle line within an up channel
third test it looks like the bears are strong but strong bounces have been seen off the line already
Perhaps the bulls will maintain the middle line?
4Hr Chart

Ethereum potential to $1900 over this weekend? Been getting good on trading at the beat of my own drum recently. A sweep above $2,000 and I'm expecting us to return to $1900 at least where we have Fibs retracing to below .78. If we break $2,000 with momentum, I'll look to $2030 about as a target.

ETHUSD Cup and HandleLong term cup and handle pattern
Will we see the bullish phase during the handles structure?
I am bullish on ETH.

Ethereum ETH Price Targets after the FOMC meeting this weekThe upcoming FED meeting on May 3rd could cause a further decline in the crypto market due to the potential rate hike and ongoing unease around banking system developments.
The outlook for the crypto market after the upcoming FED meeting on May 3rd is bleak.
Fears of a deep credit crunch caused by Silicon Valley Bank's collapse have not yet materialized, and the financial situation is much steadier.
Additionally, inflation remains elevated, and with evidence of stubbornness in underlying inflation, it could be in the 4% to 5% range, far above the 2% inflation target. The markets are pricing in a 25bp Fed Funds rate hike to 5.25% at the May FOMC meeting, and given the steadiness in financial markets, persistence in price pressures, and continued decent activity, this could contribute to a further downturn in the crypto market.
ETH/USDT short
Entry Range: 1800 - 1950 usd
Take Profit 1: 1710 usd
Take Profit 2: 1620 usd
Take Profit 3: 1480 usd
Stop Loss: 2150 usd

Ethereum ETH Price Targets after the FOMC meeting this weekThe upcoming FED meeting on May 3rd could cause a further decline in the crypto market due to the potential rate hike and ongoing unease around banking system developments.
The outlook for the crypto market after the upcoming FED meeting on May 3rd is bleak.
Fears of a deep credit crunch caused by Silicon Valley Bank's collapse have not yet materialized, and the financial situation is much steadier.
Additionally, inflation remains elevated, and with evidence of stubbornness in underlying inflation, it could be in the 4% to 5% range, far above the 2% inflation target. The markets are pricing in a 25bp Fed Funds rate hike to 5.25% at the May FOMC meeting, and given the steadiness in financial markets, persistence in price pressures, and continued decent activity, this could contribute to a further downturn in the crypto market.
ETH/USDT short
Entry Range: HKEX:1800 - 1950
Take Profit 1: HKEX:1710
Take Profit 2: TSE:1620
Take Profit 3: TSE:1480
Stop Loss: TADAWUL:2150

ETHUSD - Layering ChannelsAn idea for ETH supporting some of my previous posts, with a reversal at around ~1800
I have drawn channels against all of the trend lines available
Linking related posts below

ETHBTC may be putting in a major fakeoutAs usual, what follows isn't financial advice but a mere observation.
This idea is to be considered as a follow-up of the one that can be found linked below.
As explained in my last study, we're witnessing extremely low levels of volatility on the weekly timeframe for ETHBTC.
While price action wasn't exactly confidence-inducing until a couple days ago, tides might be beginning to change.
We can observe how since july 2020, the 21EMA (yellow) and the 55EMA (green) have never had the chance to bearishly cross.
This brings me to a very simple point, if we can see a weekly ETHBTC close above both EMAs, essentially producing a fakeout, the idea that the expansion phase coming from this extremely low volatility environment will be to the upside will begin to appear more probable.
The horizontal ray that's marking the march 2023 high (0.073544) is the obvious line in the sand for me, a weekly close above that level will make me consider that ETHBTC is putting in a major - possibly even macro - low.
Keep in mind that as long as the price keeps being held down by both the 21EMA and the 55EMA this is just a possible scenario waiting to unfold, but still unconfirmed.
Furthermore, a weekly close below this current week low (0.062037) will very likely result in a much more severe downside continuation, with targets already discussed in the idea linked below.
Whatever happens, stay safe and wait for confirmation.
