ETH: The $80M "Whale Trap" (Why $1,930 Is Next)Most traders are celebrating the $80M Long that just opened on Hyperliquid.
They think this is a "Bullish Whale."
They are wrong.
My on-chain analysis confirms this is a classic Liquidity Hunt . Here is the data retail is missing:
1. The "Bait" (Hyperliquid Whale)
A fresh wallet (0x6C85) opened an $80.9M Long at ~$2,039 .
The Flaw: They used 20x Leverage .
The Math: Their Liquidation Price is mathematically pinned at ~$1,930 .
2. The "Hammer" (Trend Research)
Simultaneously, institutional fund Trend Research deposited 35,000 ETH ($80.8M) into Binance.
The Reality: While the Speculator is Longing on-chain, the Institution is preparing to Sell Spot on Binance.
The Goal: Drive the Index Price down to $1,930 to force-liquidate the Hyperliquid whale and grab that $80M liquidity pocket.
3. Technical Structure (Bearish)
Market Structure: We are trapped in a Converging Wedge with a "Bearish Order Block" overhead at $2,148 .
Funding Rates: BitMEX spiked to +0.049% (Extreme Greed). When funding goes positive during a downtrend, it signals a "Bull Trap."
🎯 The Trade Plan
I am betting AGAINST the whale. The path of least resistance is a flush to the liquidation magnet.
❌ SHORT ZONE: $2,100 - $2,125 (Rejection at Bearish OB).
📉 TARGET 1: $1,930 (Whale Liquidation).
📉 TARGET 2: $1,600 (The "Air Pocket" Vacuum).
Verdict: Do not long here. Let the institutions finish their war. We buy the blood at $1,600 , not the bait at $2,039 .
Safe Trading,
Ethereum-bitcoin

XRP Relative Strength – UpdateRelative strength across crypto is beginning to diverge, and the signal is emerging through the ETH pair first.
XRP / BTC (Daily)
XRP continues to underperform Bitcoin in relative strength
RSI remains flat, reflecting a lack of broad confirmation
Volume is showing early stabilization, but leadership has not shifted
Bitcoin remains the gatekeeper for full market confirmation
XRP / ETH (Daily)
XRP has reclaimed relative strength versus Ethereum
Price closed above daily structure, signaling early leadership rotation
Momentum and participation are improving ahead of BTC confirmation
This is a common sequence during early rotation phases:
ETH-relative strength often turns first
BTC confirmation typically lags
⭐ Final Clarity Note ⭐
Until XRP/BTC confirms, this remains selective strength, not a broad regime change.
Structure will continue to lead the read.

EUR/USD | Where to next? (READ THE CAPTION)As you can see in the 30m chart of EURUSD, it has been struggling with the
Jan 26th NWOG Low and has hit it several times, and has been moving with it like a magnet. Currently it's being traded at 1.18270, just barely below the NWOG Low. I expect EURUSD to eventually move away from the NWOG Low, going for the Consequent Encroachment of the NWOG, and then for the NWOG High.
If EURUSD manages to hold above the 1.1827 level, the targets are: 1.1836, 1.1843, 1.1850 and 1.1858.
If it fails: 1.1821, 1.18140, 1.1807 and 1.1800.

ETH/USDT | Back on track? (READ THE CAPTION)After sweeping the liquidity below, ETHUSDT managed to go high from 2110 to 2295, now being traded at 2265.
I expect Ethereum to eventually go higher and leave to Bullish OB zone.
For now, the targets are: 2297, 2320, 2345 and 2370.

ETH/USDT | What's next? (READ THE CAPTION)By examining the daily chart of ETHUSDT we can see that it has reached to the Bullish OB and after hitting the mean threshold, it made bounced back up from 2157 to being traded right now at 2305.
Targets for ETHUSDT: 2335, 2370 and 2405.

ETH/USDT | Going lower? (READ THE CAPTION)In the 4H chart of ETHUSDT we can see that after a initial reaction to the Bullish Rejection Block, it went back inside that range and even below that range, sweeping the Sellside Liquidity there, and is being traded at 2648, just below the Consequent Encroachment of the Rejection Block.
Currently Ethereum is stuck in the rejection block zone, if it makes out of there, it could go up again to 2860.
For now, the bullish targets are: 2690, 2730, 2770, 2810 and 2860.
But if it goes below the Rejection block zone, the targets will be: 2630, 2610, 2590, 2570 and 2550.

ETH/USDT | Going back up? (READ THE CAPTION)By examining the 2H chart of ETHUSDT, we can see that after reaching 3400 2 weeks ago, it experienced a drop from there all the way to 2787, reaching the Bullish OB and bouncing back up to 2933 and now is being traded at 2908.
I expect ETHUSDT to retest the FVG outlined above, and then going over the Consequent Encroachment of the FVG.
For now, the targets are: 2957, 3000, 3037 and 3074.

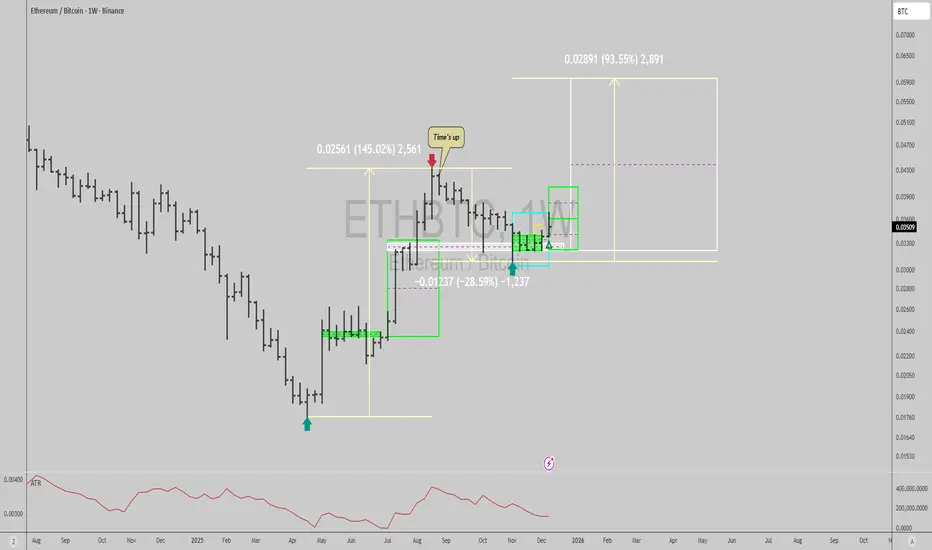
ETHBTC: A Daily and Monthly Outlook Broken DownDaily Outlook (Primary Focus)
On the daily timeframe, ETHBTC continues to respect a well-defined corrective structure following the prior impulsive advance. Price remains compressed above key support, with multiple reactions confirming the current range as technically relevant rather than transitional noise.
The immediate focus is the highlighted support zone. As long as this region holds, the structure favors continuation rather than breakdown, allowing for the development of the next leg higher. A clean push above the recent swing high would significantly strengthen the case for trend resumption and open the path toward the upper Fibonacci retracement targets highlighted on the chart.
Failure to hold this support, however, would invalidate the near-term constructive outlook and increase the probability of a deeper corrective move, aligning with the alternative scenario already mapped.
Macro Context (Monthly Justification)
Zooming out to the monthly timeframe, ETHBTC remains locked inside a large contracting triangle, a structure that has governed price action for several years. From an Elliott Wave perspective, this formation appears to be missing its wave (d)—suggesting that the broader corrective process is not yet complete.
This macro context is critical:
- The ongoing daily consolidation fits cleanly within a larger triangle environment.
- Volatility compression favors expansion rather than stagnation.
- The next directional move is likely to be decisive, not marginal.
Until wave (d) resolves, expectations should remain tactical rather than aggressively directional, with respect given to both boundaries of the formation.
Bottom Line
ETHBTC is not breaking down, it is coiling.
The daily structure defines the trade, while the monthly triangle defines the risk. A successful defense of current support keeps the upside resolution in play, while failure would simply confirm that the macro corrective process still needs more time to mature.
Patience remains the edge.

ETH bounce = resistance test, not a reversal.On the 1H timeframe, ETH remains structurally bearish despite the sharp rebound from the recent sell-off. Price is still trading below the declining EMA 98, which continues to act as dynamic resistance, aligning closely with the descending trendline a confluence that reinforces seller control. The current bounce shows corrective characteristics: overlapping candles, weak follow-through, and rejection near the 2,880–2,900 zone rather than impulsive continuation. This suggests short-covering and mean reversion, not fresh demand. As long as ETH fails to reclaim and hold above the EMA 98 with strong momentum, the dominant scenario favors another leg down, with downside targets toward 2,838 first and potentially the 2,780–2,800 demand pocket if selling pressure resumes. Only a clean break and acceptance above the EMA 98 would invalidate this bearish continuation bias.

Alert for Crypto vs Silver Swing TradeCrypto and Silver are popular within individual swing traders.
Sell crypto buy silver was a good move. I think it is time to swing back.
Sell silver and buy crypto. No leverage, not yet!

Ethereum's bullish bias remains intact —Good news and bad newsFeels like it was just yesterday when I told you that Ethereum is not likely to grow "right on Monday, it might happen on Tuesday." This is what I see happening.
Ethereum's bullish bias remains intact. People know the market is bullish. Ethereum's correction ended already two months ago. Think about it.
Some people are still having nightmares about crashes and bearish action, but there hasn't been a single new low now in two full months, since 21-November. More than that, Ethereum has been rising all this time.
With two months of a slow recovery, bullish consolidation, we can expect a strong advance next. This is good news and bad news.
It is good news because we know we get to enjoy higher prices. Bad news because we are already two months into this relief rally, which means that it will soon end. But, there is more.
Bitcoin is the one doing the relief rally. What happens if Bitcoin and Ethereum de-couple?
Notice how as Bitcoin moved lower, another five days long retrace, the altcoins market produced a strong bullish breakout. The initial reaction is marketwide but the altcoins recovered right away.
That is to say, Bitcoin can start a descent while some projects, many others, continue to grow for several weeks or months before peaking to move lower. Money will flow from Bitcoin to the altcoins, make no mistake. This is because Bitcoin is worth $2T and it is set to move below $80,000 later this year. All this capital will fuel the altcoins market bull run already in place.
Ethereum's bullish bias remains intact; trades weekly above EMA8. The action is happening above $3,000 and long-term support. Last week produced the strongest close in seven months... Rest easy, we will see additional growth.
Namaste.

ETH/USDT | From this FVG to the other! (READ THE CAPTION)By analysing the 2h chart of ETHUSDT, we can see that 3308, it dropped in price all the way down to the lower FVG's high, showing an initial reaction before dropping in the FVG zone yet again. It is currently being traded at 3109. I expect it to hit the Consequent Encroachment of the FVG and then going back up to test the high of the FVG again.
Current targets: 3113, 3124, 3136, 3148 and 3160.

ETH/USDT | Testing the FVG! (READ THE CAPTION)By analysing the 2h chart of ETHUSDT we can see that after struggling with the high of the FVG for a while, it finally managed to break free and go up to 3265, $8 lower than the low of the FVG. I'd like to see ETHUSDT test the FVG and then make a decision on which way to go.
For the time being, the bullish targets are: 3223, 3265 and 3297.
Bearish Targets: 3200, 3170, 3140.

Why Every Trend Begins and Ends With LiquidityEvery trend in crypto begins and ends with liquidity. Before a trend can move with force, the market must collect the stop orders that provide the fuel for expansion. These orders sit above equal highs, below equal lows, inside inefficiencies, and around obvious retail breakout levels. Price does not trend because sentiment magically aligns.
It trends because the market clears liquidity at one side of the structure and then expands toward the next pool. The earliest phase of any trend usually starts with a sweep: price reaches beyond a key high or low, triggers stops, absorbs the resting orders, and immediately snaps back. This wick is the first sign that the breakout attempt failed and that larger participants have used the liquidity to take positions.
Once liquidity is taken, the market shifts into structural progression. Higher highs and higher lows form not because traders collectively decide to buy, but because the market now has trapped sellers below the sweep, providing momentum as price moves toward the next logical liquidity target.
Structure becomes the visible footprint of this process. Impulse legs show aggression after liquidity collection, and pullbacks tend to remain orderly because the directional objective has not yet been completed.
Every trend is essentially a journey from one liquidity pool to the next, with structure simply describing how that journey unfolds.
The end of a trend is equally tied to liquidity. A trend rarely dies from weakening momentum alone. Instead, it typically completes when price reaches a major pool of opposing liquidity, often equal highs in an uptrend or equal lows in a downtrend.
The final move into that level is usually fast and dramatic, designed to trigger breakout traders while simultaneously running the stops of those holding late in the trend. Once the liquidity is collected, the market loses incentive to continue and snaps back inside the level, exposing the sweep as a terminal event rather than a continuation. This reversal wick marks the end of one trend and the beginning of the liquidity cycle in the opposite direction.
From there, the process repeats. Liquidity is taken. Structure shifts. Displacement confirms intention. A retest provides the entry. And the new trend begins by targeting the next liquidity pool in line.
When traders understand this cycle, trends become far easier to read. Direction is no longer based on hope, indicators, or isolated candles. It is built on recognising how liquidity motivates movement and how structure validates that movement.
Liquidity shows where the market wants to travel, structure shows how it gets there, and together they form a practical framework for identifying when trends are forming, when they are maturing, and when they are preparing to reverse.

ETHEREUM BITCOIN (BEST-CASE)CRYPTOCAP:ETH is the main platform for thousands of apps and blockchains, all powered by the Ethereum protocol.
This vibrant ecosystem fuels innovation and a wide range of decentralized apps and services.
Free and global Ethereum accounts
Pseudo-private, no personal information needed
Without restrictions anyone can participate
No company owns Ethereum or decides its future

ETH/USDT | Another try to be bullish? (READ THE CAPTION)As you can see in the Daily chart of ETHUSDT, it went through the supply zone and got rejected there. I expect a fall to the Bullish OB in 2630-2874 zone and then a reaction back to the supply zone to challenge it once more. If it fails to show a reaction and go up after reaching the Bullish OB, I expect a drop to 2117-2328 Demand zone.
Make sure to leave a comment and like the analysis in order to make me motivated to bring you analysis everyday.
Sincerely, Amirali

$ETHBTC: Weekly trend turning bullish again...Good afternoon lads,
Ethereum vs Bitcoin is now bullish in the short and mid term and can trigger a monthly timeframe trend soon if strength persists in the coming month.
Sentiment had reached the depths of hell by Friday Nov 21st, when I was at the Devconnect event, chatting with traders and people there I noticed that everyone was against my bullishness, and very keen on confronting or even ridiculing me for my views.
Since then, I started to DCA back into crypto positions after having reduced exposure massively when BITSTAMP:BTCUSD was at $115k and CRYPTOCAP:ETH circa $4k.
Let's see how things evolve, but know that reward to risk is skewed to the upside here.
Best of luck!
Cheers,
Ivan Labrie.
The Market Awaits the Fed to Set the TrendHi everyone, Domic here again.
On the chart, ETH is still holding its short-term uptrend as the 34 EMA (red) remains above the 89 EMA (blue), but the bullish momentum has clearly slowed down. Price is hovering just above both EMAs without forming any widening angle, while the EMAs themselves are being squeezed — a classic signal that the market is losing momentum, moving sideways, and waiting for new catalysts. The declining volume further confirms that buying pressure is no longer strong enough to push ETH decisively toward the 3,150–3,200 zone. This explains why, despite the uptrend remaining intact, ETH is “waiting” rather than accelerating.
On the news side, ETH is directly influenced by upcoming macro events:
The Fed meeting on December 9–10 is the key driver, and crypto markets typically go quiet ahead of such events to await direction.
Meanwhile, the DXY is weak and moving below the 100 level, but volatility is low — not enough to trigger a strong risk-on wave across crypto.
At the same time, speculation around a potential Ethereum spot ETF continues, but without any confirmation from the SEC, expectations exist — yet large capital remains cautious.
Based on these factors, I expect ETH to continue consolidating or potentially pull back to retest the 3,060–3,080 zone before showing a clearer reaction after the Fed meeting.

Altcoins are loading. BTC Dominance is in a downward retest following the recent breakout.
ETH/BTC confirmed its upward breakout.
The apparent silence is actually the sound of an impending power shift.
CRYPTOCAP:BTC.D vs. BINANCE:ETHBTC

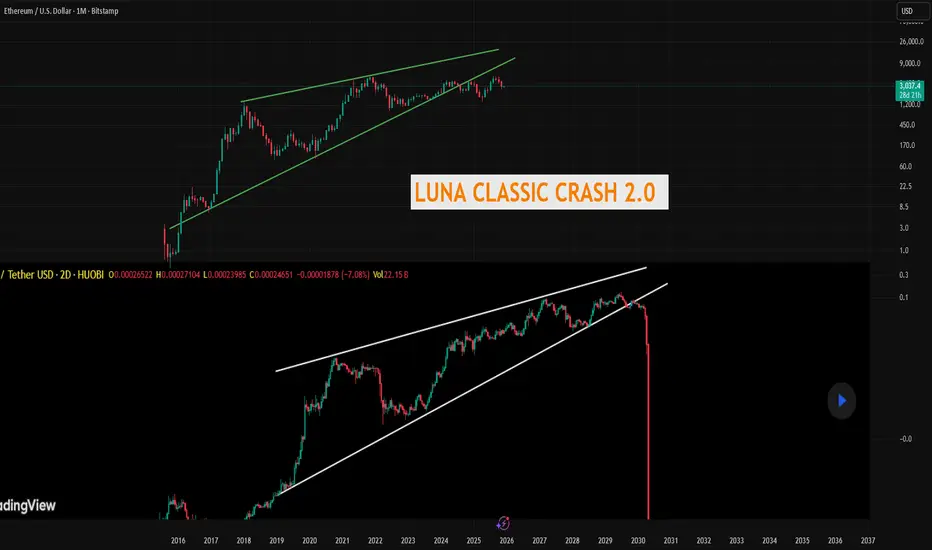
IS ETH ABOUT TO CRASH LIKE LUNA CLASSIC?I pointed this out a couple years ago you can fins my chart in my profile but I think ETH might crash like Luna Classic did. Look at the similarities with the massive rising wedge. ETH is actually outdated, clunky, the fees are stupid high, and its extremely overvalued, in my opinion. I called the Luna Classic crash down to about 50 cents from when it was at its high around 70 dollars, Ill link it below, it went waaay below even my crazy target. People thought I was crazy, go read the comments.
I think the same is on tap for Ethereum. Its already broken below if it cant get back above, I see a waterfall of red candles. What the narrative will be who knows but its coming.
The chart I added of Luna you cant even find it anymore on here this is a screenshot of that chart from my previous ideas.
Not financial advice just my opinion.
ETH/USDT | Ethereum Breaks 3000 and Momentum Still Points HigherCRYPTOCAP:ETH pushed all the way to 3000 and the bullish view is still fully intact. From the 2600 rebound to here the move has delivered more than 17 percent already and the structure still supports continuation. As long as ETH holds above the 2500 to 2700 demand zone the upside targets remain 3200, 3500, and 4000 in the next major leg. On the supply side the important zones sit at 3200 to 3300 and then 3500 to 3600 where price may slow down before the next breakout. For now momentum belongs to buyers.
Please support me with your likes and comments to motivate me to share more analysis with you and share your opinion about the possible trend of this chart with me !
Best Regards , Arman Shaban

Market Structure 101: Navigating Price ActionMost traders jump directly into indicators, oscillators, or patterns. Yet every chart has a deeper foundation that determines direction long before any tool is applied. Market structure is that foundation. When you understand how price forms highs, lows, and transitions between them, you stop reacting to noise and start reading the market’s intent. It is the base layer that allows you to build a clear, consistent bias.
Price moves because buyers and sellers interact around key levels. Structure highlights where momentum strengthens, weakens, or reverses. By tracking how highs and lows evolve, you can identify trend, consolidation, and shifts in direction with far more clarity than any indicator can offer. Market structure is objective. It gives you a rule-based lens to interpret movement across all timeframes.
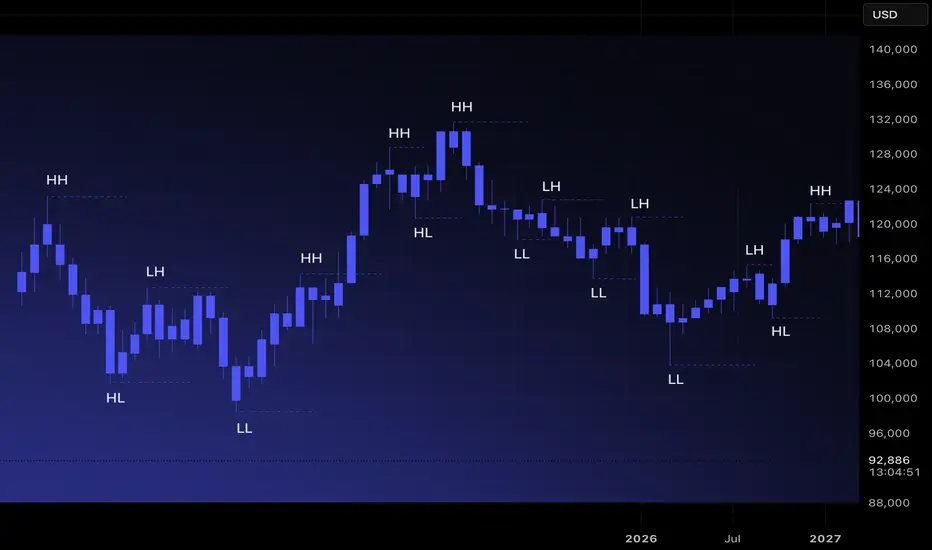
Understanding Highs and Lows
There are four structural components every trader must recognize.
Higher High (HH): Price breaks above a previous high, showing buyers in control.
Higher Low (HL): Price pulls back but stays above the prior low, confirming trend continuation.
Lower High (LH): Price rallies but fails to reach previous highs, indicating weakening demand.
Lower Low (LL): Price breaks below the previous low, signaling sellers taking control.
These sequences are the building blocks of trend identification. When mapped correctly, they remove guesswork and reveal underlying momentum.
Identifying Uptrends and Downtrends
Uptrend: A sequence of HHs and HLs. Buyers consistently push price higher and defend higher floors.
Downtrend: A sequence of LHs and LLs. Sellers control direction, rejecting higher prices and driving the market downward.
A trend remains intact until structure breaks. This is why experienced traders avoid predicting reversals and instead follow structural evidence. When the market prints new HHs and HLs, the bias remains long. When LLs and LHs appear, the bias rotates short.
Ranges and Consolidation
Markets do not trend all day. Much of the time, they move sideways. A range occurs when highs and lows stay relatively equal, creating a horizontal zone with equal highs and equal lows. This is where compression happens. Liquidity builds above the range highs and below the range lows, and trend often resumes only after one side of the range is taken.
In ranges, structure becomes neutral. Bias is formed only when price breaks out and retests with confirmation.
Break of Structure(BOS) and Trend Shift
A break of structure occurs when the market violates the pattern of the existing trend. In an uptrend, a break occurs when price prints an LL. In a downtrend, a break occurs when price forms an HH. This signals a potential shift in momentum.
Breaks of structure matter because they identify turning points without relying on subjective signals. They show where one side loses control and the other gains traction. They also create clear invalidation points for risk management.
How to Read Structure Across Timeframes
Market structure becomes even stronger when used across multiple timeframes. The higher timeframe sets the primary bias. The lower timeframe provides entry precision.
Weekly or Daily: Structural trend and major zones.
4H or 1H: Execution windows and key shifts.
15m and 5m: Entry confirmation.
When all levels of structure align, the probability of a clean move increases significantly.
Avoiding Common Mistakes
Many traders misread structure by focusing on every small fluctuation. Structure is defined by meaningful swings, not micro noise. Another common error is assuming a single HH or LL immediately reverses a trend. Context matters. Breaks followed by continuation and retests confirm the shift. A disciplined trader waits for structure to become clear instead of acting on isolated candles.
Turning Structure Into a Bias
Structure simplifies decision-making.
If the market is printing HH and HL formations, you prioritize longs.
If it is printing LH and LL formations, you seek shorts.
If highs and lows are equal, you wait for a breakout.
ETH/BTCHere is the range I'm looking at for the ETH/BTC pair. A bounce in this box means buying Ethereum will be more profitable than Bitcoin.
