ETHUSD: Bulls Are Winning! Long!
My dear friends,
Today we will analyse ETHUSD together☺️
The recent price action suggests a shift in mid-term momentum. A break above the current local range around 3,822.9 will confirm the new direction upwards with the target being the next key level of 3,868.2 and a reconvened placement of a stop-loss beyond the range.
❤️Sending you lots of Love and Hugs❤️
Ethereum (Cryptocurrency)

mrmoney limited ETH/USD position trading ideaprice has approached our monthly key resistance level which made price to have a bearish turn we have a minor support zone which price reacted to and has recently givenen us bullish momentum

ETH— What the 3500 Support Means and How I’m Trading ItExactly on Friday, just before the big drop, I bought ETH at 4300.
Fortunately, I had a stop loss at 4150, which — of course — got triggered.
But instead of frustration or searching for someone to blame, I took it like a trader should — accepted it, moved forward, and focused on what’s next. Because in trading, maturity starts where ego ends.
Technical Picture
Looking at the chart, after breaking the 4300 support line, ETH accelerated to the downside and found buyers around 3500.
This level is not random — it’s defined by:
1. A major horizontal support
2. The ascending trendline from previous lows
3. And the psychological round number of 3500
Naturally, we saw an initial rebound from that area.
Trading Plan
If the market retests the 3500 zone, I’ll be looking for buying opportunities, targeting a potential retest of 4300.
However — and this is crucial — my trade will be low-volume and protected by a tight stop.
Why? Because while I believe this could be a turning point, so does everyone else.
And when every retail trader sees the same thing, I trade carefully — because as we’ve all learned now, there’s no such thing as free money.
Final Thought
Discipline is not about winning every trade — it’s about staying rational when emotions scream louder than logic.
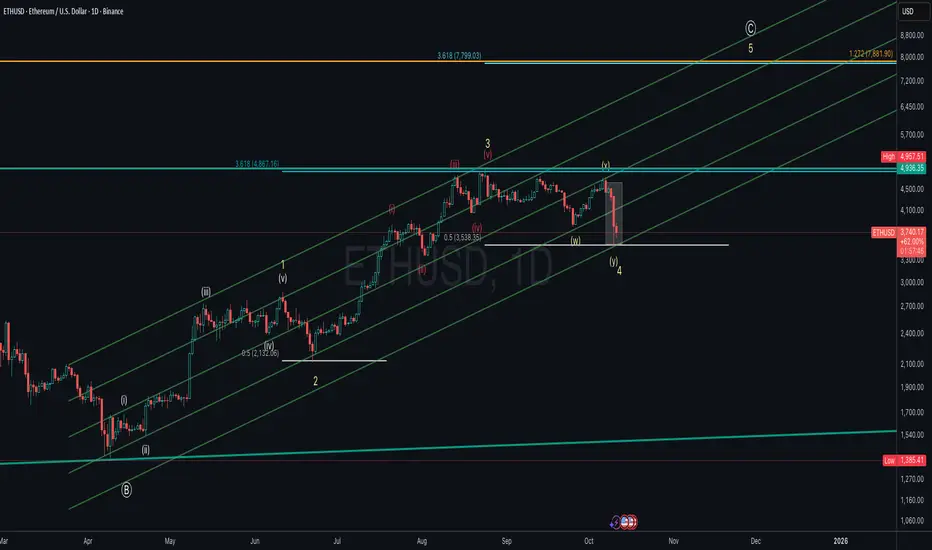
ETHUSD – Wave 4 Correction Near Completion? Preparing for the FiEthereum (ETHUSD, Log Mode) appears to be completing a Wave 4 corrective structure (W–X–Y) within the broader impulsive cycle from the March lows.
Wave 4 found strong support near the 0.5 retracement level around $3,500, aligning with the lower parallel channel of the wave 3 advance.
A potential Wave 5 rally could begin once confirmation of reversal is seen, with upside targets projected at:
$4,867 (3.618 extension of Wave 1)
$7,800–$7,900 (1.272 extension of the macro structure)
If ETH breaks below $3,500, it could invalidate this immediate bullish count and suggest a deeper correction.
Key Levels:
Support: $3,530 / $3,350
Resistance: $4,867 / $7,800
Invalidation: Below $3,500
Watching for signs of a Wave 4 bottom to confirm the start of Wave 5, potentially leading Ethereum into new all-time-high territory in the coming months.
Ethereum ShortAs U.S. Treasury yields and the U.S. dollar continue to strengthen, The crypto market continues its selloff. I have outlined some key areas where bulls will start to nibble on longs. Shorts are still open for at least another 2% down.

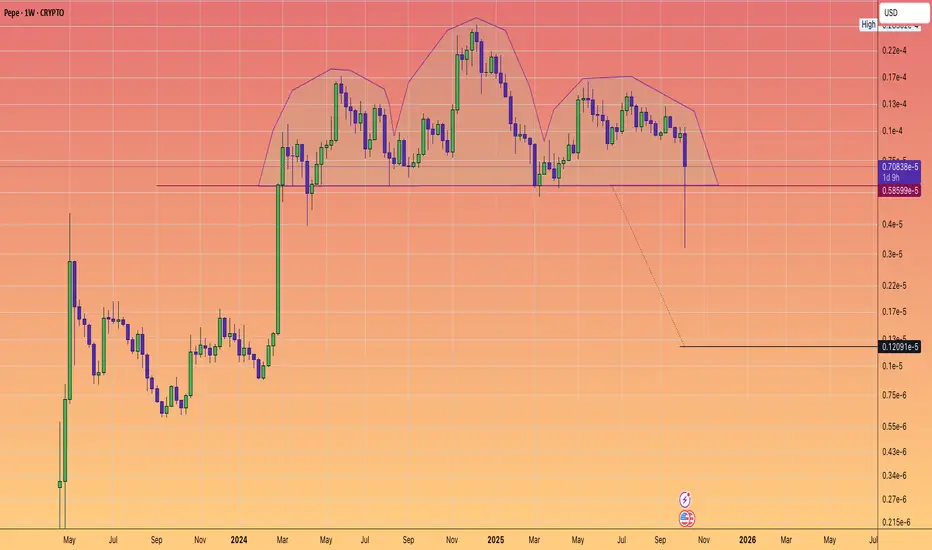
$PEPE: MAJOR HEAD and SHOULDERS BREAKDOWN WARNING.🐸🐸🐸
⚠️⚠️⚠️
Pattern formed, Big Move Ahead?
The weekly chart of #Pepe has confirmed a classic head and shoudlers pattern - a powerful bearish setup.
After over 1.5 years of building this structure, price decisively pierced the neckline with a sharp drop.
Suggesting that a weekly close below the neckline could trigger an accelerative towards the pattern target.
Key Levels
Neckline: $0.0000058599
Target: $0.0000012091
Why does it matter?
Head and shoulders are the most trusted reversal technical patterns. Coupled with declining and weakening sentiment. This pattern warns of more downside--- unless buyers can mount a quick rescue.
What's your strategy?
Are you shorting the breakdown, waiting for the target, or looking for a fake-out reversal?
Drop your thoughts/Analysis or questions in the comments!
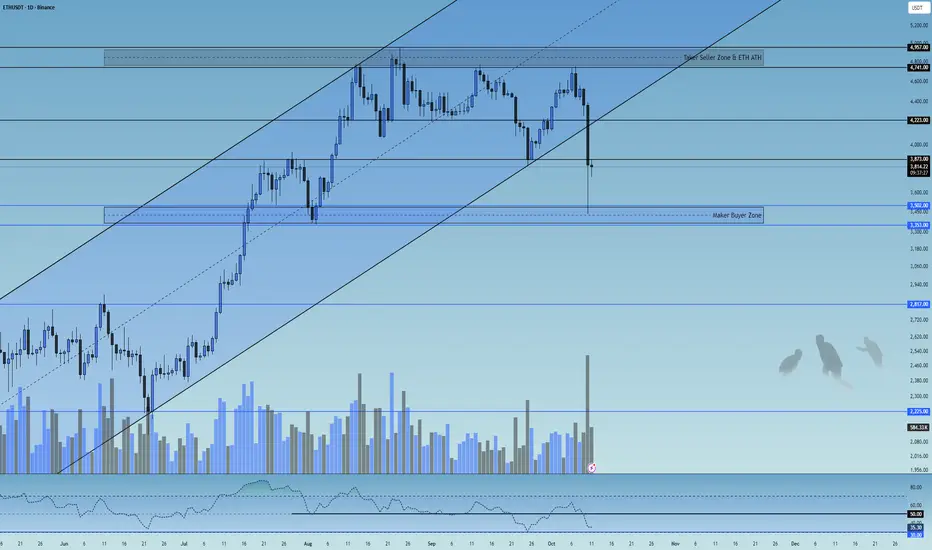
ETH 1D Analysis - Key Triggers Ahead | Day 32☃️ Welcome to the cryptos winter , I hope you’ve started your day well.
⏰ We’re analyzing ETH on the 1-Day timeframe .
👀 On the Ethereum daily timeframe, we can see that after the historic economic war between the U.S. and China, Ethereum broke its ascending channel with a high-volume whale candle and has now managed to stabilize below this channel. Currently, Ethereum is in a critical decision-making zone, with two key resistance levels at $3,873 and $4,223.
A break and confirmation above these zones, especially $4,223, could lead to a bullish continuation; otherwise, a breakdown below the channel support may trigger a deep correction and cause Ethereum to enter a risk-off phase on the higher timeframe (weekly).
🧮 Looking at the RSI oscillator, after crossing down from the 50 level, it is now heading toward the 30 and oversold region. These two zones — 50 and 30 — are our key RSI levels, and when volatility crosses these zones, it can be accompanied by a significant increase in trading volume.
🕯 The recent daily candle of Ethereum has shown a massive amount of sell volume, with an open around $4,400 and a close below $3,900 (ignoring the shadow). This indicates strong selling pressure — if buyers fail to hold Ethereum above $4,200, we could see further correction and selling pressure ahead.
🧠 Currently, there’s no specific trigger for Ethereum, but a trading range will likely form in this zone until the end of the week.
A break of either the top or bottom of this range across multiple timeframes could give us a potential long or short position.
❤️ Disclaimer : This analysis is purely based on my personal opinion and I only trade if the stated triggers are activated .
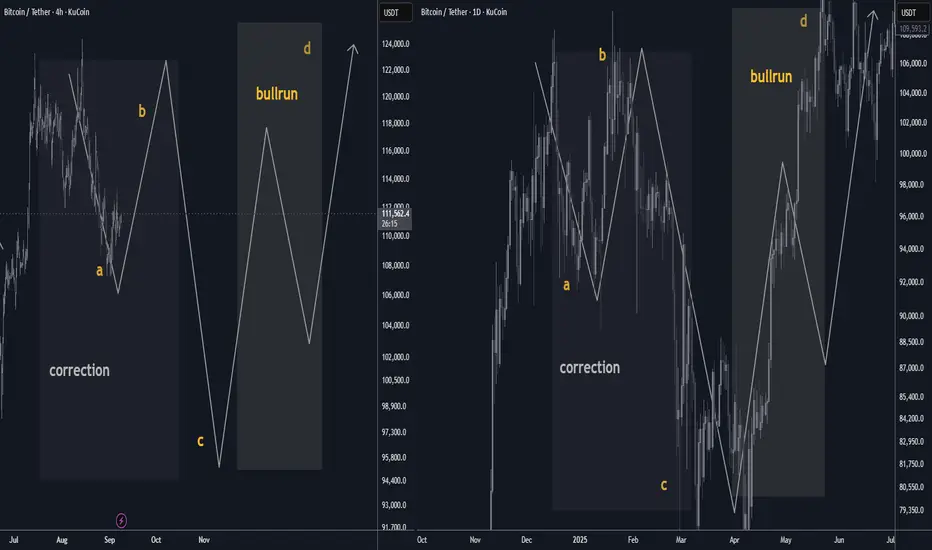
Bitcoin September 2025 Outlook: a/b/c price fractal structureBTC enters September post-ATH with a seasonal headwind. Base case: a ~10% A-leg dip toward $108k, a B-bounce into ~$122k, then a C-flush near ~$94k—echoing April’s ABC rhythm. Once complete, the uptrend should re-assert into year-end. 📉🔁📈 #Bitcoin #Seasonality #Crypto
🟠 Bitcoin September Outlook: Seasonality vs. Structure
After a fresh ATH, September’s historical bias skews mildly red. Base case is a ~10% A-leg dip that develops into an A/B/C correction before trend continuation. Think controlled pullback → consolidation → next markup. 📉➡️🔁➡️📈
________________________________________
🗓️ Seasonality Snapshot (2015–2024)
• Mean (10-yr): −2.55% · Median: −4.52%
• Red months: 6/10
• Worst September: 2019 (−13.88%)
• Best September: 2024 (+7.39%)
• Last 3 yrs avg: +2.8% (2024 +7.39%, 2023 +3.99%, 2022 −3.09%)
• Last 5 yrs avg (2020–2024): −1.3%
Read: September has tended to be weak, but the last two years printed green. Seasonality is a headwind—not a handbrake. 🌬️
________________________________________
🧩 Structure Thesis (Fractal Analog)
You’re looking for a repeat of April 2025’s A/B/C rhythm—scaled up:
• April 2025 reference: A ≈ $92k → B ≈ $106k → C ≈ $80k
• Now (projected):
o A ≈ $108k (≈ 10% pullback from recent highs) 📉
o B ≈ $122k (relief rally / lower high) 🔁
o C ≈ $94k (final flush into demand, completing the correction) 🧱
Interpretation: A measured September fade aligns with the A-leg. A reflexive B-bounce can follow as funding resets and late longs get cleaned up, with a C-leg completing the pattern before the next expansion. 🚀
________________________________________
📊 How Seasonality Supports the Call
• Typical drag: Median −4.5% and multiple red Septembers justify a down-bias.
• Volatility window: The historical 21-point spread (best +7.39% vs worst −13.88%) means a 10% dip sits well within normal bounds.
• Cycle context: With a new ATH just printed, a shallow corrective phase is constructive—not bearish regime change.
________________________________________
🧭 Levels & Triggers
• Bias line: Momentum cools into $108k → watch for seller absorption and open interest reset.
• Relief cap: $122k acts as B-rally resistance; sustained closes above $122k would invalidate the ABC idea and argue for immediate continuation. ✅
• Completion zone: $94k (C) is the buy-the-dip completion area; clean breaks below raise risk of a deeper time correction rather than a swift V-reversal. ⚠️
________________________________________
🧪 What to Monitor (Confirmation/Invalidation)
• Liquidity & OI: De-leveraging into A, controlled OI rebuild into B, washout into C.
• Spot-ETF flows / stablecoin issuance: Weakening into A, stabilizing by late month supports B→C rhythm.
• Funding/basis: Overheated → normalize during A; negative spikes near C often mark capitulation.
• Breadth (alts): Underperform into A/C; broad risk-on breadth usually returns post-C.
________________________________________
📝 Base Case Path (Textbook)
September: drift to $108k (A) → bounce toward $122k (B) → final tag of ~$94k (C) → reset + markup into Q4.
(If price reclaims and holds above $122k early, treat that as trend continuation—not a correction.)
________________________________________
🔒 Risk Notes
• Seasonality is a tendency, not a rule. Macro catalysts (CPI, policy, liquidity) can dominate calendar effects.
• This is market commentary, not financial advice. Manage risk and invalidation levels. 🛡️
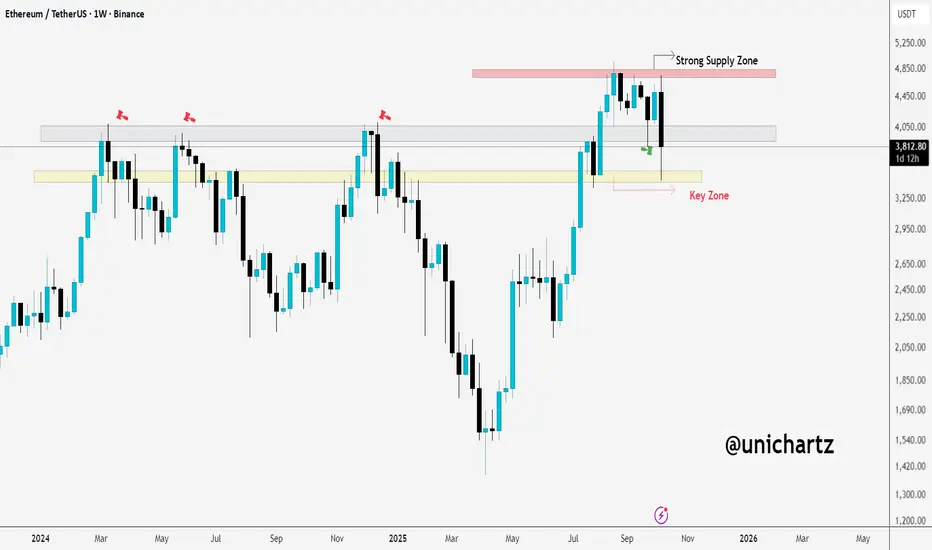
ETH in Danger: Breaking Below $3,200 Could Signal Bigger DropCRYPTOCAP:ETH is facing rejection from the strong supply zone around $4,800. The weekly candle failed to hold above that level and is now pulling back towards the key demand zone between $3,200–$3,300.
If the price fails to reclaim this support, we could see a more bearish scenario unfolding.
DYOR, NFA
Thanks for the reading
#ETH #ETHUSDT #ETHEREUM #Analysis #Update #Eddy#ETH #ETHUSDT #ETHEREUM #Analysis #Update #Eddy
According to the formed pattern, namely QM in the RTM style on the weekly block breaker, I expect an upward movement and a ceiling hunt and an ATH of Ethereum, and also in the ICT and liquidity styles, I expect a Fake BOS and a drop to the weekly block order to liquidate long positions and then continue the upward trend according to the analysis I did on the chart and the Path I drew. I expect the Ethereum currency to act accordingly.
So I expect an upward movement, a drop and a re-rise according to this analysis and explanation.
The important upper timeframe area for volatility has been identified and named.
These settings are based on a combination of different styles, including volume style with ict style and a combination of RTM and liquidity style.
Based on your strategy and style, get the necessary confirmations to enter the trade in these volatility settings.
Don't forget about risk and capital management.
The entry point, take profit point and stop loss point along with their values are indicated on the chart.
The responsibility for the transaction is yours and I am not responsible for any failure to comply with your risk management and capital.
🗒 Note: If, according to the analysis, the progress after the main rise begins, I expect the price of Ethereum to reach the targets of the latest analysis provided on Ethereum, which will be attached.
⚠️ Warning: Predicting market movements is a mistake and this analysis may be violated, so do not rush into your decisions and proceed to trade after obtaining the necessary confirmations. Market makers will always surprise us and predicting movements and future movements is a complex and difficult task.
Check out my previous analysis on Ethereum via the link below :

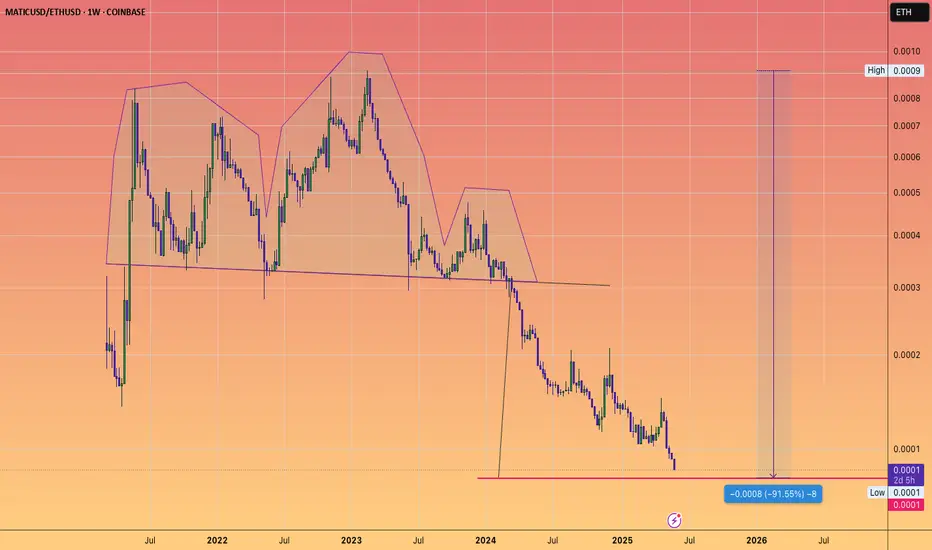
MATIC approaching Head and shoulders target...versus ETH
which would be a -91% loss of value versus the second most important crypto
$ETH market update 5-10-2025📊 Ethereum Market Update (on request)
Right now, there’s nothing major happening for Ethereum. It continues to consolidate in a range between the ATH at $4800 and the $3800 level, because of this massive bearish divergeance.
On the daily chart, the MACD is bullish and the Stochastic RSI is supportive, but momentum looks exhausted. There isn’t much conviction in this move. Bitcoin is the real superstar, while Ethereum is fading in its shadow.
From my analysis, we might still have about one more week of growth, potentially pushing to a new ATH — but don’t expect a parabolic rally. This looks more like a technical follow of BTC rather than genuine investor interest.
⚠️ That means the probability is high that we see a dump back below $4000, likely testing $3800 as support.
If bulls regain control and Bitcoin rotation restarts, ETH could resume its rally. Otherwise, we may see deeper consolidation, possibly down to $3400, before finding the energy to push again toward a new ATH.
#Ethereum #ETH #EthereumPrice #Crypto #CryptoNews #CryptoMarket #Bitcoin #BTC #Altcoins #Trading #TechnicalAnalysis #CryptoUpdate #MACD #StochasticRSI #ATH #CryptoTrading #Investing

Support at the 4403.87-4749.30 range is key
Hello, fellow traders!
Follow us to get the latest information quickly.
Have a great day!
-------------------------------------
(ETHUSDT 1D chart)
This period of volatility is expected to last until October 5th.
Accordingly, the key question is whether support can be found around 4403.87 and whether it can rise above 4749.30.
If the price fails to rise,
1st: 3900.73-4107.80
2nd: 3239.06-3438.16
3rd: 2419.83-2706.15
We need to check whether support is found around the 1st-3rd levels above.
-
To break above a key point or range and continue the uptrend,
- The StochRSI indicator must be trending upward. If possible, it's best to avoid entering the overbought zone.
- The On-By-Sign Volume indicator must be trending upward. If possible, it should remain above the High Line.
- The TC (Trend Check) indicator must be trending upward. If possible, it should remain above the 0 level.
You should determine whether the above conditions are met at critical points or ranges and consider a response plan accordingly.
Currently, the StochRSI, OBV, and TC indicators are all showing an upward trend, so we believe the key point of 4403.87 has been broken upward.
However, to sustain this upward trend, the OBV indicator must rise above its High Line, and the StochRSI and TC indicators must maintain their current trend.
Therefore, we can see that support around 4403.87 is crucial.
-
The 4403.87-4749.30 range corresponds to the HA-High ~ DOM (60) range.
If this level is broken upward, a stepwise uptrend is likely, but it is likely to act as resistance.
Therefore, as mentioned earlier, determining whether the conditions for an upward breakout of a critical point or range are met will help you decide how to proceed with your trade.
-
Thank you for reading to the end. I wish you successful trading.
--------------------------------------------------

Solana - Market structure Shift - The Levels to be aware of !In this video I look at the higher time frame and point out some key reasons of why I'm expecting a deeper pullback as well as local time frame where we can see the clear levels to be taken if your looking to accumulate or open longs .
Aside from the Solana coin I look at the Eth/Btc pair and BTC which ultimately determines the fate of the alt coin market .
Any questions please feel free to ask in the comments section below

ETHUSD: Reversal Expected Near 4100The bullish outlook remains unchanged. We are expecting the price to reverse near 4100 . The sharp move on wave a, a small correction for wave b, indicates a sharp decline and rapid rise in the upcoming days.
Previous research:
Stay Tuned!
@money_dictators
Thanks :)

ETH at Critical Support: Can $3,850 Hold?CRYPTOCAP:ETH has faced a sharp rejection from the supply zone around $4,800 and is currently trading near $4,100. There's another strong support zone around $3,850.
I'm personally expecting a sharp rebound from this level. However, if the price fails to hold, we could see a further decline towards $3,600.
DYOR, NFA

BTC Dominance: Key Levels to WatchAfter the recent correction, BTC dominance is bouncing from the support zone at 59.64%. It looks like BTC dominance will likely retest the nearest resistance zone before any further downside.
If BTC.D breaks above this resistance, we could see more pressure on altcoins.
However, a rejection from this resistance zone could signal some relief for altcoins, giving them a chance to recover.
#PEACE
THANKS for the Read

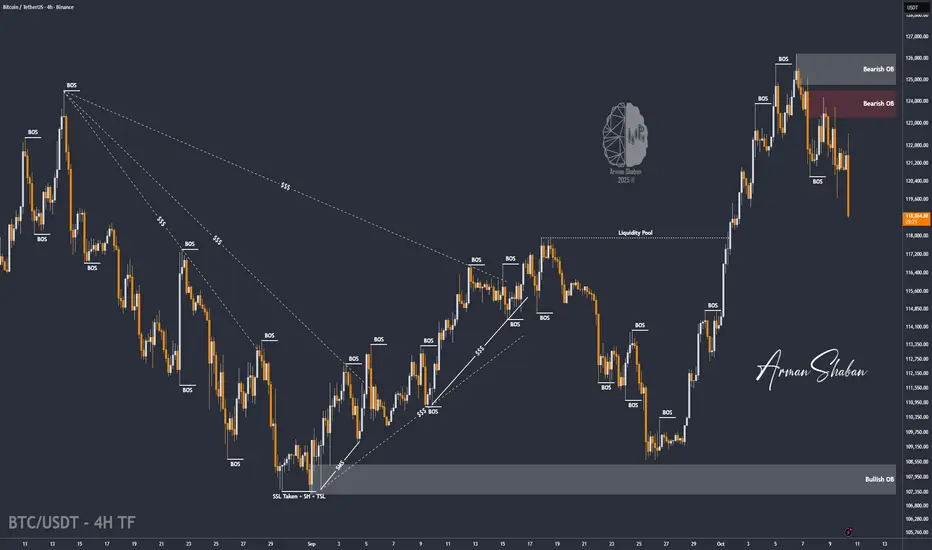
BTC/USDT | BTC Correction in Play – Will $117K Hold the Line?By analyzing the Bitcoin (BTC) chart on the 4-hour timeframe, we can see that after rallying up to $126,000 and setting a new all-time high (ATH), the price faced a sharp correction and is now trading around $119,000.
This drop could extend further toward $117,000, which is a key level to watch closely. If Bitcoin manages to hold above this zone, we could see the next bullish wave begin. Otherwise, the next major demand zones are at $115,000, $113,500, and $112,120.
Please support me with your likes and comments to motivate me to share more analysis with you and share your opinion about the possible trend of this chart with me !
Best Regards , Arman Shaban
TAO Surging Towards $415WRITE ANALYSIS
ChatGPT said:
TAO is approaching a critical resistance level near $415 after breaking above the descending trendline. This could lead to a test of the key zone, which has been a significant resistance in the past.
A successful break above this level might fuel further upside potential, while rejection could push the price back toward the support zone around $350–$375.
Keep an eye on price action around the key levels for potential breakout or pullback.
DYOR, NFA

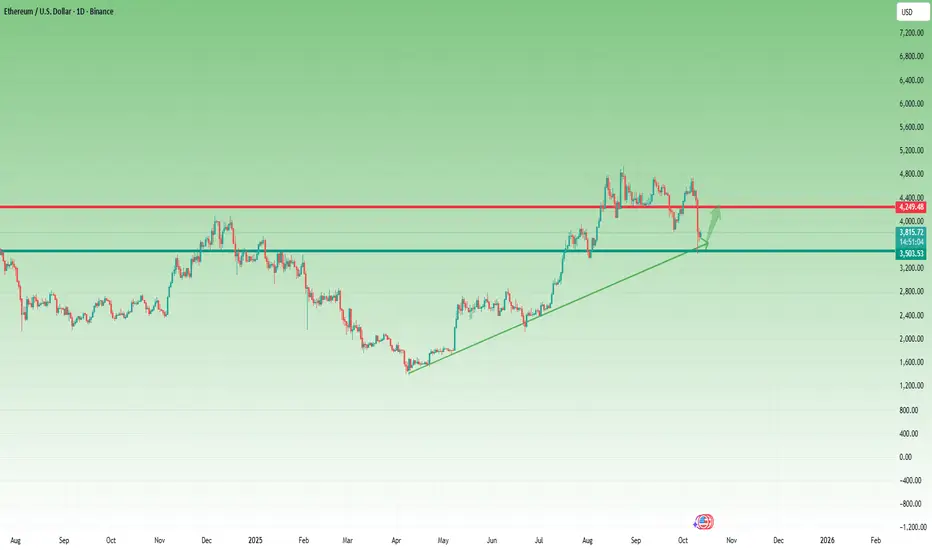
ETHUSD support at 4,263The ETHUSD remains in a bullish trend, with recent price action showing signs of a breakout within the broader uptrend.
Support Zone: 4,263 – a key level from previous consolidation. Price is currently testing or approaching this level.
A bullish rebound from 4,263 would confirm ongoing upside momentum, with potential targets at:
4,564 – initial resistance
4,654 – psychological and structural level
4,757 – extended resistance on the longer-term chart
Bearish Scenario:
A confirmed break and daily close below 4,263 would weaken the bullish outlook and suggest deeper downside risk toward:
4,180 – minor support
4,100 – stronger support and potential demand zone
Outlook:
Bullish bias remains intact while the ETHUSD holds above 4,263. A sustained break below this level could shift momentum to the downside in the short term.
This communication is for informational purposes only and should not be viewed as any form of recommendation as to a particular course of action or as investment advice. It is not intended as an offer or solicitation for the purchase or sale of any financial instrument or as an official confirmation of any transaction. Opinions, estimates and assumptions expressed herein are made as of the date of this communication and are subject to change without notice. This communication has been prepared based upon information, including market prices, data and other information, believed to be reliable; however, Trade Nation does not warrant its completeness or accuracy. All market prices and market data contained in or attached to this communication are indicative and subject to change without notice.

Eth/Usd - Bullish Trendline BreakoutTrendline Breakout Confirmed
Price has broken out of the resistance trendline, forming a bullish structure with confirmation from multiple CHoCH (Change of Character) and BOS (Break of Structure).
Entry Executed
Entry was taken on breakout retest (highlighted zone). Price is now pushing above the resistance line, showing strong bullish momentum.
Target: 4430
Based on breakout projection and previous highs, next target is set at 4430.
Structure Overview:
Support Trendline holding price structure
Resistance Trendline broken with strong bullish candle
CHoCH and BOS indicate shift in market structure
15-minute timeframe suggests short-term bullish bias.
Target: 4430
Monitor for volume confirmation and continuation.

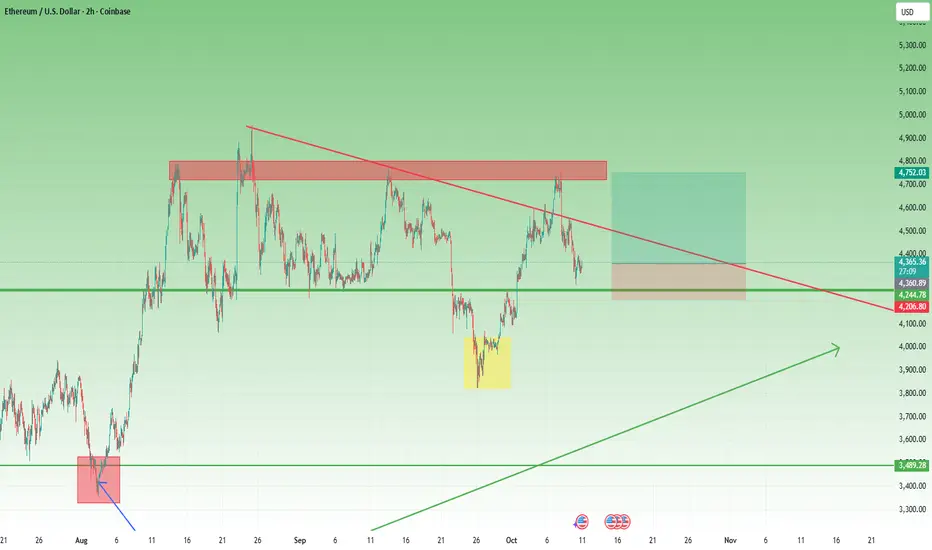
ETH Correction Complete? Bullish Setup Reemerges As I mentioned in my previous ETH analysis, while my medium-term outlook remains bullish, I was anticipating a short-term correction.
That’s exactly what unfolded. After retesting the 4750 resistance zone, Ethereum began to retrace, reaching the support area just below 4300 earlier today.
Currently, the price is rebounding, and there’s a strong probability that the corrective phase has ended.
I’m now looking to re-enter long, as even a move back to the recent highs could offer a 1:2.5 risk–reward setup — a solid short-term opportunity within the broader bullish structure.
$ETH 3rd Cycle the retest before parabolic.We can see that Ethereum has exhibited a similar pattern before every major bull run.
1st Cycle (2017)
Retest of the demand zone, followed by a parabolic rise.
2nd Cycle (2020)
Same structure, same momentum.
3rd Cycle (2025)
We are now back in the same zone, Pre-Parabolic phase after retest.
This is not just a correction, it will be the beginning of the next major wave of Ethereum.
