ETH/USDT chart analiysis !!ETHUSDT Daily Chart.
Downtrend Channel and Key Breakout
ETH traded lower in a descending channel for several months between January and April, marked by parallel lines.
A breakout above this channel in late April signaled a trend reversal, leading to a sharp uptrend.
Following the breakout, ETH reached the gray supply/resistance zone ($3,800–$3,900), which has been acting as a support and pivot area ever since.
When the price recently fell below this zone, it immediately found buyers and is attempting to reclaim it.
ETH is now forming a small descending channel from its highs, with the price at support.
The chart projection indicates a bullish reversal as long as ETH remains above gray support and breaks above the channel resistance. If this reversal mirrors previous moves, the next major upside target is $4,830.
Following the previous breakout and trend reversal, ETH is consolidating near key support. Confirmation above resistance could trigger another strong rally, so keep an eye on key areas for signals.
DYOR | NFA
Ethereum (Cryptocurrency)

SYRUP/USDT — The Make-or-Break Moment for Bulls?The SYRUP/USDT pair is now at a critical zone — after months of being trapped below the main descending trendline (yellow) since June, price is once again testing a key resistance area around 0.48–0.51 USDT.
Buyer momentum is starting to build, but the market has not yet given a confirmed breakout signal.
The latest candle shows a strong attempt to break above the trendline, but the big question remains:
➡️ Is this the start of a major trend reversal?
or
➡️ Just a classic rejection before another leg down?
---
🔼 Bullish Scenario — “The Breakout We’ve Been Waiting For!”
If price closes daily above 0.5095 and holds that level (successful retest), then the potential for a reversal becomes stronger.
Buyer strength could push the price toward:
🎯 Target 1: 0.5778
🎯 Target 2: 0.6265
🎯 Target 3: 0.6800 (previous swing high)
A confirmed breakout would mark the end of the lower-high structure and open the door to a mid-term uptrend rally.
Additional confirmation: rising volume & solid bullish candle bodies without long upper wicks.
---
🔽 Bearish Scenario — “False Breakout Trap?”
If price fails to break above 0.5095 or gets strongly rejected at the trendline (forming a bearish engulfing / rejection candle), the likelihood of a false breakout becomes high.
In this case, sellers may regain control and drive price lower toward:
⚠️ Support 1: 0.44
⚠️ Support 2: 0.36
⚠️ Support 3: 0.29
Failed breakouts are often followed by quick dumps, as trapped longs (bull traps) rush to exit positions. Beware of long wicks near resistance zones!
---
🧩 Structure & Pattern
The current setup forms a Descending Trendline Breakout Pattern, where the market is attempting to break through a long-term downward pressure line that has held for months.
This structure typically signals either:
Trend Reversal → if the breakout is confirmed.
Downtrend Continuation → if rejection occurs.
In short: A major momentum shift is building — direction awaits confirmation.
---
⚖️ Quick Summary
> “The market stands at a major crossroads. A confirmed breakout could trigger a trend reversal — but failure here might signal another bearish continuation. Stay disciplined, wait for confirmation, and manage risk wisely.”
#SYRUPUSDT #CryptoAnalysis #BreakoutAlert #TechnicalAnalysis #TrendReversal #CryptoTrading #PriceAction #ChartPattern #BullishScenario #BearishScenario #CryptoTrader #AltcoinWatch

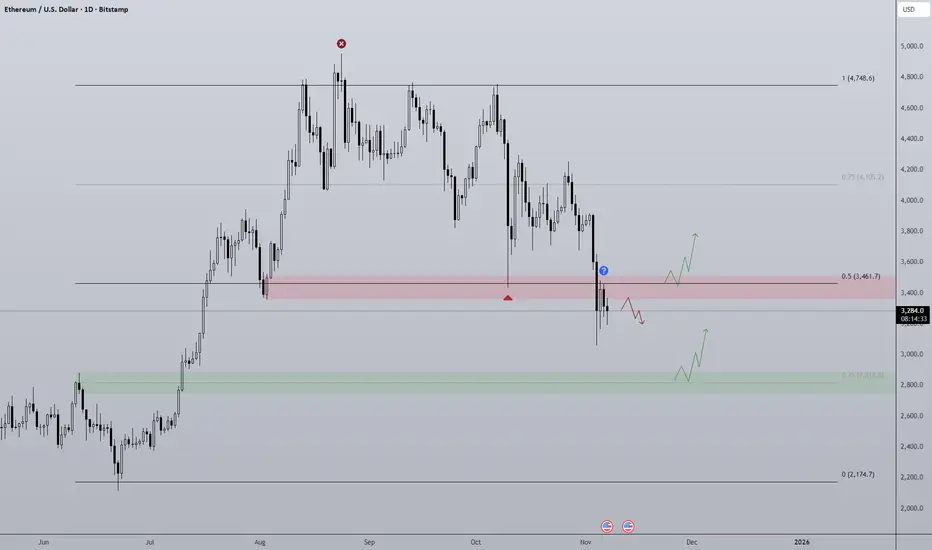
Eth/Usd - Rejection Setup Targeting $3,250Ethereum is currently trading around the $3,435 zone, testing a strong resistance area between $3,450–$3,500. Price has previously rejected this zone multiple times, forming a clear double-top pattern.
The support zone sits near $3,220–$3,260, where buyers have stepped in several times before. Unless ETH breaks above resistance with strong volume, a pullback toward the support zone remains likely.
Bias: Bearish below $3,450
Target: $3,250
Invalidation: Break and close above $3,500

See if it finds support near 3321.30 and can rise
Hello, fellow traders!
Follow us for quick updates.
Have a great day.
-------------------------------------
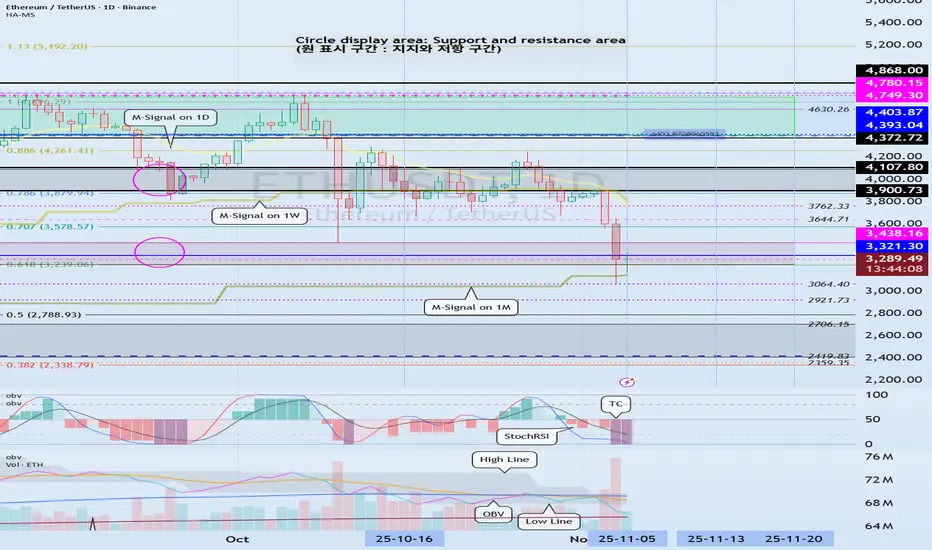
(ETHUSDT 1D chart)
There's no change from what I mentioned in my previous idea.
The M-Signal indicator on the 1M chart has been touched, so the trend will be re-determined.
At this point, it's crucial to check for support near the Fibonacci 0.618 (3239.06) - 3438.16 range.
If support fails and the price falls below the M-Signal indicator on the 1M chart, support should be checked around the 2419.83-2706.15 range.
-
Since the TC (Trend Check) indicator has touched its lowest point, a rebound is highly likely.
Therefore, determining support near the critical Fibonacci 0.618 (3239.06) - 3438.16 range is more important than ever.
Currently, ETH is in a period of volatility.
Therefore, we need to monitor the movement until November 6th.
The next period of volatility is around November 13th.
-
Thank you for reading.
We wish you successful trading.
--------------------------------------------------
ETHEREUM FREE SIGNAL|SHORT|
✅ETHUSD is reacting from a premium supply level after internal liquidity sweep and mitigation of an old imbalance. Expect bearish delivery toward the sell-side liquidity below.
—————————
Entry: 3,457.5$
Stop Loss: 3,502$
Take Profit: 3,400$
Time Frame: 2H
—————————
SHORT🔥
✅Like and subscribe to never miss a new idea!✅

Might be time to dip back into OPBTC just smashed through $100K, and ETH's hovering right around $3K.
Might be time to dip back into OP—looks like the liq map shows they flushed out every last long trader.
Entry: $0.3547
Take Profit: $0.6800
Stop Loss: $0.3098
Playing it with a 1:8 RR.
If this one gets stopped out, I'll eye the next entry around $0.26 +/- straight into the spot bag. All that prime liquidity's piled up overhead.

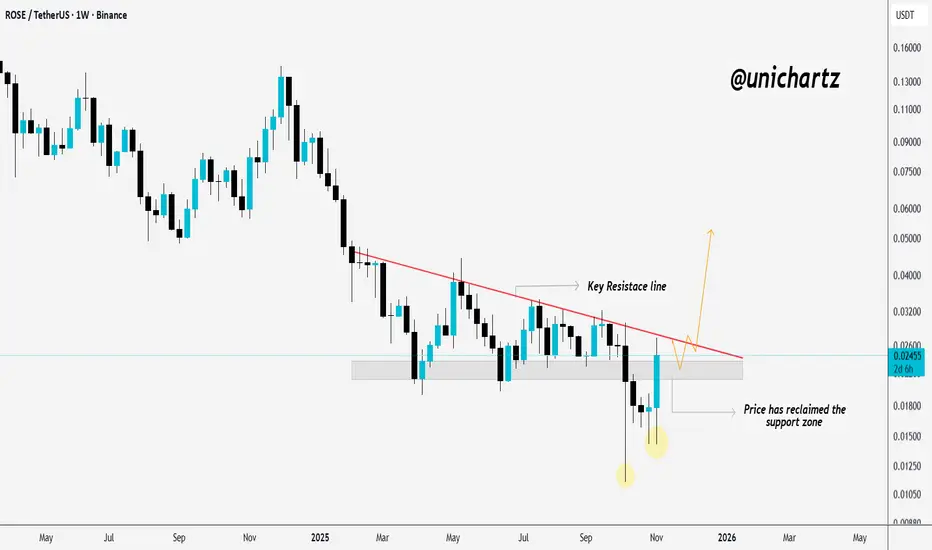
ROSEUSDT: Eyeing a Breakout Above Key ResistanceLSE:ROSE has rebounded strongly from the bottom and reclaimed its support zone.
It’s currently trading just below a key resistance trendline, if it manages to break and hold above this level, we could see a potential upside move ahead.
DYOR, NFA
ETH Losing Range Midpoint? Similarly to Bitcoin, Ethereum finds itself around the midpoint of the high time frame range, only ETH has already lost the level and has rejected when retesting. Such a lack of strength is concerning for the project as well as the broader altcoin market.
So there are a few actionable moves I'm looking out for:
Bullish scenario is we maybe chop for a while around/under the midpoint then with high volume the midpoint gets flipped with conviction. That would open the door for the top half of the range to be accessible again. I think this scenario relies on the US Government shutdown coming to an end and QT also ending. Right now there just isn't the liquidity needed to prop up prices hence the slow bleed.
Bearish scenario is a simple continuation of the local bearish trend where 0.25 ($2,800) is the target. This area signaled the break in structure responsible for the previous rally and so I believe it will provide support but is also the target for the bears to reach.
GOLD vs. TOTAL MARKET CAP. Gold touched the top band of the HTF rising wedge structure and the 0.618 Fib channel... then rejected.
This view appears to be a multi-year high.
So where is Total Market Cap at this point?
At the base of the same structure...
Is one's journey ending and the other's run beginning?
The crypto market is just beginning to gather its strongest momentum.
Target: The upper band of the rising wedge.
This view is HTF analysis.
Please do not confuse it with hourly and daily timeframes.

ETHUSDT.P - November 7, 2025ETHUSDT.P is showing continued signs of short-term bearish momentum after rejecting from the $3,370 resistance zone. A short position is positioned around $3,280, targeting a move toward the $3,179 profit level for a quick scalp.

SPK/USDT – Final Pressure Before a Major Breakout?The market is watching SPK/USDT closely as it approaches a make-or-break zone.
After months of steady decline under a well-defined downtrend line, price is now testing the critical demand zone at 0.034–0.030 — the same level that previously triggered a massive rally earlier this year.
The current structure hints at a potential shift in momentum, but failure to hold this area could invite a deeper sell-off.
---
Pattern & Technical Structure
SPK is shaping a descending wedge / descending triangle pattern — a classic formation that often precedes a trend reversal when sellers lose steam and buyers begin to accumulate around a key support area.
The 0.034–0.030 zone acts as a strong defensive wall.
If this zone holds and price breaks above the yellow downtrend line, it could signal the start of a medium-term bullish reversal.
However, a clean break below this level would confirm bearish continuation, likely driving price down toward the 0.0225 support zone.
---
🟢 Bullish Scenario
A daily candle close above the downtrend line confirms a momentum shift.
Breakout must be supported by increasing volume for validation.
Upside targets:
0.0465 → first key resistance
0.0565 → confirmation of a trend reversal
0.0885 → extended bullish target if sentiment strengthens
Watch for the formation of a higher low post-breakout — a reliable sign of a structural reversal.
---
🔴 Bearish Scenario
A daily close below 0.030 confirms bearish dominance.
Potential for accelerated drop toward 0.0225 (previous major low).
If breakdown occurs on high volume, it may signal the final phase of capitulation before a deeper accumulation phase.
---
💡 Market Outlook & Sentiment
SPK is standing at a major inflection point.
The 0.034–0.030 zone is not just a support range — it’s a battlefield between accumulation and continuation.
A breakout above the trendline would ignite a new chapter in SPK’s price structure, while a breakdown could extend its bearish cycle into year-end.
Smart traders will wait for daily candle + volume confirmation, not emotional reactions.
The next decisive move here could define the market direction for months ahead.
---
🎯 Key Technical Levels
Main Support: 0.034 – 0.030
Next Support: 0.0225
Immediate Resistance: 0.0465
Major Resistances: 0.0565 / 0.0885 / 0.1250
---
🧭 Market Perspective
Although SPK remains within a downtrend, the slowing bearish momentum near this demand zone might indicate early accumulation by smart money.
If a breakout occurs, expect a possible short squeeze rally toward 0.05–0.06 as short positions unwind above the descending trendline.
---
#SPK #SPKUSDT #CryptoAnalysis #Breakout #Downtrend #TechnicalAnalysis #PriceAction #AltcoinSetup #CryptoTrading #ReversalZone #SupportResistance

Stop!Loss|Market View: BTCUSD🙌 Stop!Loss team welcomes you❗️
In this post, we're going to talk about the near-term outlook for the BTCUSD ☝️
Potential trade setup:
🔔Entry level: 105019.48
💰TP: 110424.25
⛔️SL: 102201.32
"Market View" - a brief analysis of trading instruments, covering the most important aspects of the FOREX market.
👇 In the comments 👇 you can type the trading instrument you'd like to analyze, and we'll talk about it in our next posts.
💬 Description: The global prospects for a decline to 90000 are lingering, but for now, unless the price pushes toward 100000, the decline will have to wait a bit longer. The most likely scenario now is a price move toward 104000, where a breakout toward 110000 is expected. Near this resistance, not only are technical factors stopping the price but also a accumulation of selling liquidations, so the price will likely drift toward this area in the short-term.
Thanks for your support 🚀
Profits for all ✅
❗️ Updates on this idea can be found below 👇

Stop!Loss|Market View: GBPUSD🙌 Stop!Loss team welcomes you❗️
In this post, we're going to talk about the near-term outlook for the GBPUSD currency pair☝️
Potential trade setup:
🔔Entry level: 1.31268
💰TP: 1.28032
⛔️SL: 1.32581
"Market View" - a brief analysis of trading instruments, covering the most important aspects of the FOREX market.
👇 In the comments 👇 you can type the trading instrument you'd like to analyze, and we'll talk about it in our next posts.
💬 Description: As previously predicted, the USD's dominance is strengthening and is likely to continue in the mid-term. For the pound, all key short-term targets have been completed, as have the mid-term targets outlined in previous reviews. Further downward movement is currently expected toward 1.27130, which is the next significant support level. Given the current situation, sell opportunities are currently only located above 1.31590, should the price return there for a retest.
Thanks for your support 🚀
Profits for all ✅
❗️ Updates on this idea can be found below 👇

Heading into key resistance?The Ethereum (ETH/USD) is rising towards the pivot which is a pullback resistance and could reverse to the 1st support.
Pivot: 3,691.29
1st Support: 2,954.96
1st Resistance: 3,919.62
Disclaimer:
The above opinions given constitute general market commentary, and do not constitute the opinion or advice of IC Markets or any form of personal or investment advice.
Any opinions, news, research, analyses, prices, other information, or links to third-party sites contained on this website are provided on an "as-is" basis, are intended only to be informative, is not an advice nor a recommendation, nor research, or a record of our trading prices, or an offer of, or solicitation for a transaction in any financial instrument and thus should not be treated as such. The information provided does not involve any specific investment objectives, financial situation and needs of any specific person who may receive it. Please be aware, that past performance is not a reliable indicator of future performance and/or results. Past Performance or Forward-looking scenarios based upon the reasonable beliefs of the third-party provider are not a guarantee of future performance. Actual results may differ materially from those anticipated in forward-looking or past performance statements. IC Markets makes no representation or warranty and assumes no liability as to the accuracy or completeness of the information provided, nor any loss arising from any investment based on a recommendation, forecast or any information supplied by any third-party.

Bearish on ETHETH is likely to see a short-term rebound before declining below $3,000 to test the Monthly Demand zone.
I anticipate strong performance in January and February, with the potential for ETH to reach the $6,000 level.
We may have roughly one more month of bearish movement before the next upward phase begins.

ETHUSDT.P - November 6, 2025ETHUSDT has broken below its ascending trendline, signaling potential bearish momentum. The setup suggests a short bias with a profit target near $3,275 and a stop level around $3,485, aligning with a risk-reward structure favoring downside continuation.

ZKUSDT - A long upward journey is about to beginWe literally caught the bottom in the previous analysis — no doubt about it.
The chart looks extremely bullish and is showing massive upward momentum.
There’s a huge falling wedge pattern that has broken out and been successfully retested on the daily timeframe, with a potential target of 5x from here.
Best Regards:
Ceciliones🎯

Bitcoin Sitting on Crucial 50 EMA Support!Finally, CRYPTOCAP:BTC has reached a key confluence zone, sitting right on the 50 EMA support, a level that has acted as dynamic support since 2023.
Technically, I’m expecting a potential bounce from here. However, if the current candle fails to reclaim this support, we could see a deeper correction, especially with ongoing geopolitical uncertainty weighing on the market. 📉
DYOR, NFA
Thanks for reading! Appreciate your support and engagement

LTC/USDT | LTC Holding Steady Above $76 – Bulls Eye $136!By analyzing the #Litecoin chart on the weekly timeframe, we can see that after correcting to $79, the price has started to rise again and is now trading around $88.5.
If Litecoin manages to stay above $76, we can expect further upside momentum. The next potential targets are $97, $106, $118, and $136.
Please support me with your likes and comments to motivate me to share more analysis with you and share your opinion about the possible trend of this chart with me !
Best Regards , Arman Shaban

ETH/USDT | ETH Under Pressure – Watching Major Demand at $2,500!By analyzing the Ethereum chart on the weekly timeframe, we can see that Ethereum, similar to Bitcoin, has started a correction — dropping as low as $3,050 earlier today and now trading around $3,300.
Key demand zones to watch are at $2,900, $2,700, and especially $2,500, which is a major support area. If price dips into this zone, I expect a strong bullish reaction from buyers. This analysis will be updated once confirmation appears on the chart.
Please support me with your likes and comments to motivate me to share more analysis with you and share your opinion about the possible trend of this chart with me !
Best Regards , Arman Shaban

ETH key support buy signalETH Technical Analysis and Signals: After a sharp drop to the $3000 mark, ETH reversed course. A further pullback to confirm support is possible, and traders should pay close attention to buying opportunities around the $3330-$3260 support level. This support area is crucial; a valid reversal here could lead to a rise to the $3500-$3600 resistance zone. Selling can be initiated upon reaching this resistance zone, depending on real-time market conditions.

ETHEREUM hit its 1W MA50. Can this save the Bull market?Ethereum (ETHUSD) just hit its 1W MA50 (blue trend-line) for the first time in 4 months since it broke above it on the week of July 07 2025. This pattern looks very similar to the 1W tests after the March 11 2025 and November 08 2021 Highs (latter as also a Cycle Top).
In both cases the 1W MA50 failed to hold as a Support (did also the same on the Jan 13 2025 test) and the price declined further completing -48% and -52% total drops respectively.
As a result, there are high probabilities currently for ETH to extend its decline by at least -48%, in which case it may reach $2600.
Based on the 1W RSI, the most probably level for a bounce is the 38.50 (RSI) level, which is the Symmetrical Support that initiated the rebounds of September 02 2024 and January 24 2022. The September 18 2023 and November 07 2022 Lows also came very close to it and rebounded.
-------------------------------------------------------------------------------
** Please LIKE 👍, FOLLOW ✅, SHARE 🙌 and COMMENT ✍ if you enjoy this idea! Also share your ideas and charts in the comments section below! This is best way to keep it relevant, support us, keep the content here free and allow the idea to reach as many people as possible. **
-------------------------------------------------------------------------------
💸💸💸💸💸💸
👇 👇 👇 👇 👇 👇

ETHUSDT – Short-Term Bounce Before Another DropEthereum is currently showing signs of a mild recovery after the sharp selloff seen earlier this week. Despite the ongoing bearish sentiment in the crypto market, a short-term rebound is forming as price finds support around the $3,300 zone.
Recent news highlights large outflows from Ethereum ETFs, signaling cautious investor sentiment. However, on-chain data also points to short-term accumulation, suggesting that some traders are taking advantage of lower prices to re-enter the market. This has helped ETH recover slightly toward the $3,700 region — a key resistance area aligned with the descending trendline and previous supply zone.
Still, the $3,700 area remains a potential turning point. If buyers fail to sustain momentum here, sellers may regain control, pushing ETH back down to $3,300 or lower in the next sessions.
